Rep:Mod3:sweetkiss666
Physical Computational Laboratory
Introduction
Potential energy surfaces lie at the heart of all mechanistic chemical interpretations.[1] A potential energy surface (PES) is represented by illustrations as the one in Figure 1. These surfaces specify the way in which the energy of a molecular system varies with small changes in its structure. It can be thought of as a mathematical relationship of the molecular structure with the resultant energy.
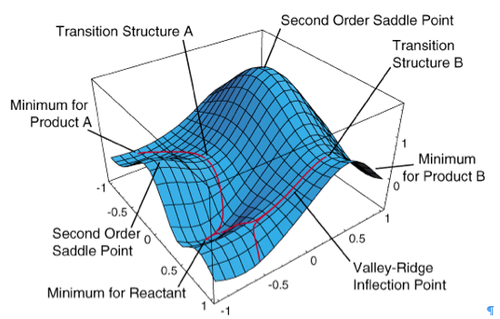
The PES diagram presented above considers only two of the degrees of freedom within a molecule and plots the energy above the plane defined by them, creating the surface. A few important points have to be accounted for:
* minimum for reactant: a point at the bottom of the valley from which motion in any direction leads to a higher energy structure,
* local minimum: the lowest point in a limited region of PES,
* global minimum: the lowest point located on PES,
* saddle point: a point corresponding to a transition state structure.[3]
The main focus of this module is locating transition states in larger molecules which participate in two of the most famous and investigated reactions in organic synthetic chemistry: the Cope rearrangement and Diels-Alder reaction.
In the first part, study of the low-energy minima and transition structures of 1,5-hexadiene were undertaken in order to determine the preferred reaction mechanism.
In the second part, Cope rearrangement reaction study was carried out and the preferred transition state shape was found and analysed.
In the third part, Diels-Alder reactions between ethene and butadiene as well as cyclohexa-1,3-diene and maleic anhydride were studied. The issue of transition state geometries, regioselectivities and secondary orbital overlaps were addressed.
The last part is purely optional - own study of an interesting reaction of dimerisation of ketenes.
Molecular species in the transition state are usually approximated by a single molecular transition structure although it is known that a state consists of a considerable number of structures with Gaussian energy distributions under specified conditions of temperature and pressure. It is remarkable that many energy barriers associated with computed transition structures agree so closely with literature measured barriers.[1]
Transitions states are characterised by one and only one imaginary vibrational frequency. Strictly speaking, a transition state is a first order saddle point. Like minima, the first order saddle points are stationary points with all forces zero. Unlike minima, one of the second derivatives in the first order saddle is negative. The eigenvector with the negative eigenvalue corresponds to the reaction coordinate. ‘’A transition state search thus attempts to locate stationary points with one negative second derivative.’’ The structure associated with the first order saddle point will exhibit one imaginary frequency and the normal mode of vibration along associated with this frequency should resemble the motion along the reaction coordinate.[3]
Cope Rearrangement Study
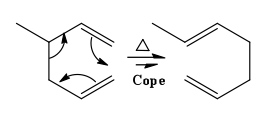
The Cope rearrangement is a [3,3]-sigmatropic rearrangement with only carbon atoms in the ring.[4] Since the reaction takes place at thermodynamic conditions, the product is the most thermodynamically stable regioisomer, hence the one with the most substituted alkene formed. An example of this fascinating reaction is shown in Figure 2. If a hydroxyl group is introduced in the molecule, the rearrangement is now referred to as the oxy-Cope rearrangement. The OH substituent acts as an enthalpic driving force towards rearrangement because of formation of the more stable C=O through enol-keto tautomerism, as shown in Figure 3.
 |
 |
The first step in the investigation of the Cope rearrangement involved locating the minimum energy conformations using the HF/3-21G level of theory. HF stands for Hartree-Fock, the most common type of ab initio computational calculations. Ab initio (Latin: from the beginning) represents computations whose solutions are derived directly from theoretical principles, completely independent of empirical data. This is an approximate quantum mechanical calculation, which uses mathematical approximations to differential equations. The primary approximation is the central field approximation, in which the Coulombic electron-electron repulsion is taken into account by integrating the repulsion term. The energies generated are always greater than the experimental energies and tend to a limiting value called the Hartree-Fock limit as the basis set is improved. [5]
Conformational Analysis of 1,5-Hexadiene Using HF/3-21G
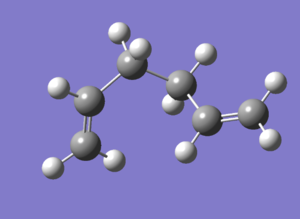
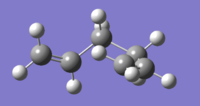
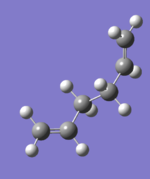
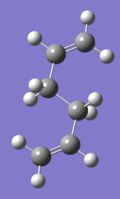
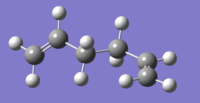
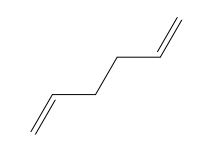
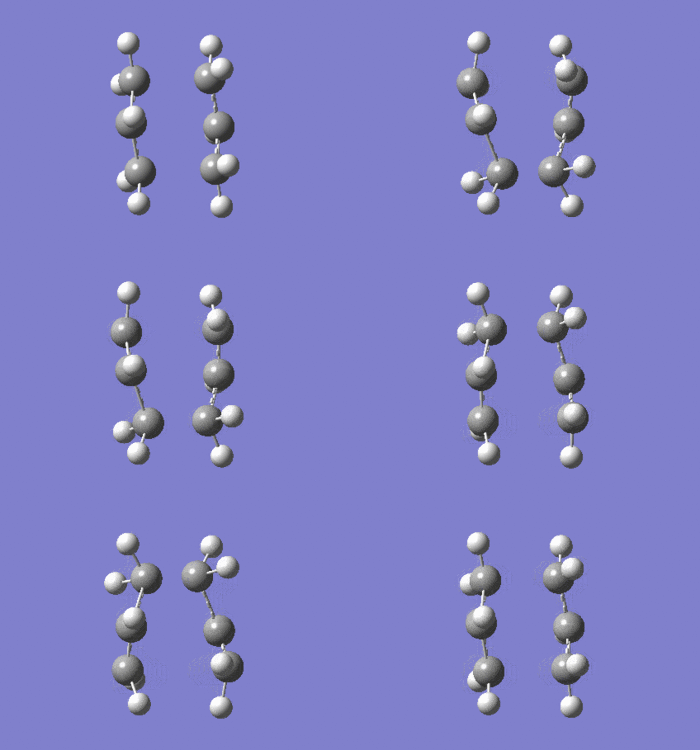
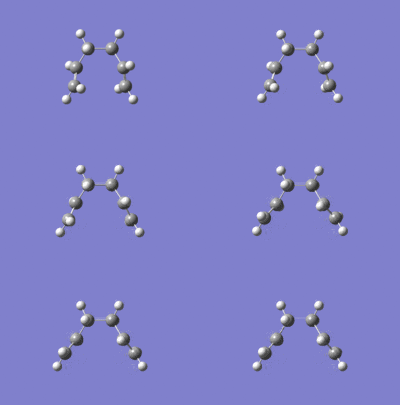
Conformational analysis is fundamental to the understanding of organic reactions. It enables chemists to devise rules for a range of chemical interactions like folding in protein systems. The molecule of 1,5-hexadiene is presented in Figure 4. There are three free rotating C-C bonds in the structure and three rotational minima around each bond. Theoretically, twenty-seven different conformations of 1,5-hexadiene can be identified however because of the symmetrical nature of the molecule and enantiomerism present in the conformations only 10 of them are distinct. 12 structures are depicted in Figure 5. It is important to mention that among these, D and F as well as J and L are enantiomeric pairs. Rotation about the central C-C bond with antiparallel vinyl groups gives conformations A, B and C. By rotation about the central C-C bond with parallel vinyl groups, one ends up with conformations D, E and F. Rotation about the central bond with one of the C-C sp3- sp3 bonds in an s-cis orientation. Lastly, one arrives at conformers J, K and L by rotating around the central bond with both C-C sp3- sp2 bonds arranged in an s-cis orientation.
 |
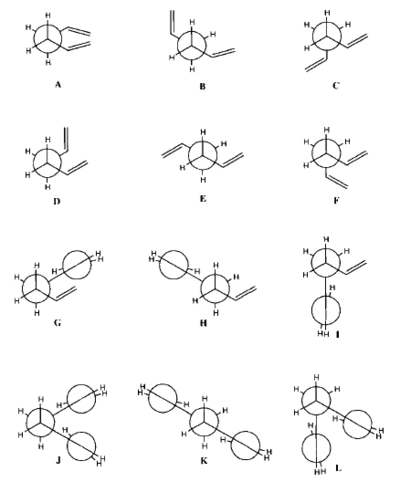 |
There is a systematic method for naming the conformers. The name indicates the approximate values of torsional angles about the three readily rotating bond. The outer double bonds can adopt one of two gauche conformations or an s-cis conformation. The two gauche conformations are g120 and g-120. The central C-C bond can also adopt one of the two gauche of an anti conformation. The two gauche conformers would be referred to as g60 and g-60.[6]
Hartree-Fock calculations were performed on a PC using Gaussview 5.0. The energy minima were found through complete geometrical optimisation of the initially drawn conformers using 3-21G basis set. When a conformational search was done on an initially drawn, unidentified gauche rotamer, the torsional bonds: C-C sp3- sp3 and the two adjacent C-C sp3- sp2 bonds were marked for rotation in the quest for the remaining 5 gauche conformations. The method was repeated to locate the anti conformers. The energies and point groups of all the conformations, together with rotatable models can be found in Tables 1 and 2.
The global minimum is the Gauche conformer 3, represented as D on the Newman projections in Figure 5. According to Gung at al[7] a reason for this is a plausible attractive interaction between the π-orbital and the vinyl proton. The energy difference between the conformers B and E represented by the ball-and-stick models Anti 1 and Anti 1, respectively is negligible and equals 0.04 kcal/mol.
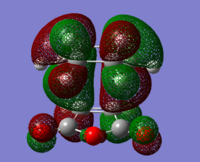
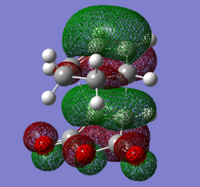
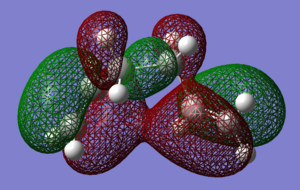
To check for any overlaps between molecular orbitals, an MO analysis was undertaken. HOMO orbitals of Gauche 3 and Anti 2 are presented below.
 |
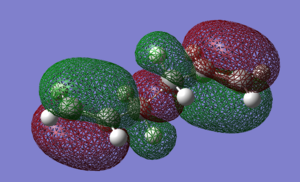 |
The favourable overlap between π orbitals of two double bonds in Gauche 3 is clearly visible on the HOMO picture. The same interaction is absent in the Anti 2 conformer. There is however a bonding interaction between the methylene proton and the π orbital which is, most probably, another stabilising factor for this conformation.
This is in contrast to the classic example of n-butane, where the staggered conformations are the low-energy conformation and among these, the antiperiplanar conformation with the two methyl groups opposite each other, is the most stable of all. The methyl groups are large enough to make steric factors contribute significantly to the energy distribution of the conformers on an energy diagram, as shown in Figure 8.
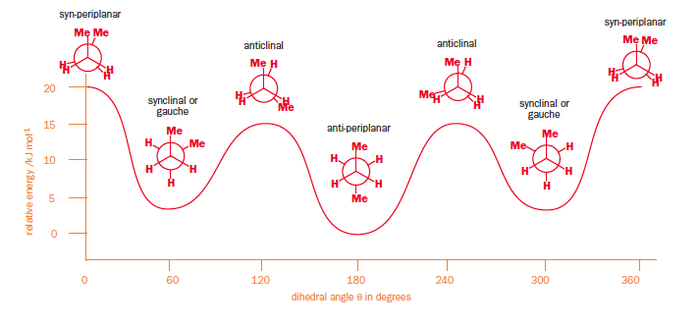
There are 3 important effects which dictate the relative stability of conformers in n-butane, however the ideas can be extrapolated to many different organic systems:
* Effect 1: The antiperplanar conformation comprises four sets of σC-H/σ*C-H orbital interactions and two sets of σC-C/σ*C-C interactions whereas the gauche conformer possesses only sets of the former. In agreement with the Deslongchamps theory that two stereoelectronic reactions are better than one, app conformer is more stable.
* Effect 2: The bond-bond Pauli repulsion energy disfavours the gauche conformation.
* Effect 3: The distance between the C1 and C4 proximal hydrogens in gauche n-butane is 2.35 Å. H-H contacts are not present in the antiperiplanar form, favouring it slightly.[8]
The net result is that the antiperiplanar conformer is more thermodynamically stable than its gauche counterpart and difference between the anti and gauche forms in n-butane are twice as large as in 1,5-hexadiene.
There is no such close contact of hydrogen atoms in any of the conformers A-F. Conformer C, corresponding to Gauche 1 in Table 1, is the highest energy CH-eclipsed form as its vinyl protons are only 2.5 Å apart. In addition, the distance between the sp2 carbon atoms C2 and C5 is 3.0 Å, making it a repulsive interaction. Conformers Anti 1 and Anti 2 lack this interaction and are hence lower in energy than Gauche 1. In fact, it is forms Gauche 2, 3 and 4 which are comparable in energy to Anti 1 and 2, unlike for n-butane.[7]
Rocque and al[6] on the other hand disputes with the previously mentioned journal and criticizes the authors for the use of less sophisticated treatment of electrons in conjunction with larger basis sets. Using HF with DZP, cc-pVTZ and cc-pVZQ sets, Rocque predicted conformation B (Anti 2) to be the global minimum in all cases. The precision of neither approaches allows to draw conclusions as to the relative ordering of the energy conformations simply because of the small energy differences. The development of methods to determine the correlation contributions accurately and efficiently is still a highly active research area in conventional quantum chemistry. Electron correlation is mainly caused by the instantaneous repulsion of electrons which is not covered by the effective HF potential. Pictorially speaking, the electrons get often too close to each other in the HF method because the electrostatic interaction is treated only in an average manner.[9]
Conformational Analysis of 1,5-Hexadiene Using DFT B3LYP/6-31G(d)
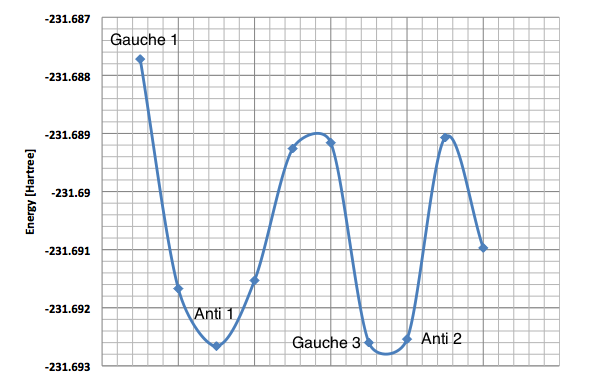
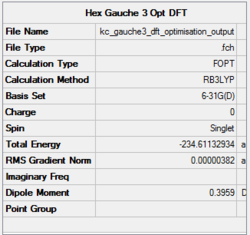
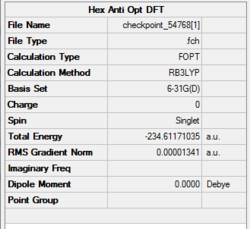
Figure 9 shows a simple energy versus conformation plot for the existing rotamers of 1,5-hexadiene. The global minimum conformation, Gauche 3 and two local minima, Anti 1 and Anti 2 were reoptimised using DFT Method with 6-31G(d) basis set. The premise behind DFT (Density Functional Theory) is that the energy of a molecule can be determined from the electron density instead of a wavefunction. The advantage is that the integrals for Coulomb repulsion need to be done only over the electron density and electron correlation can be included in the calculation. This results in faster calculations than HF and a higher level of accuracy.[5] The basis set used, 6-31G(d), a polarised basis set which, in comparison with split valence basis sets such as 3-21G or 6-31G, allow the orbitals to change both size and shape during calculations by adding d functions to carbon atoms (in this case) and sometimes p functions to hydrogen atoms.[10] The basis set gives very good descriptions of equilibrium and transition state geometries in organic molecules.
|

|
|
||||
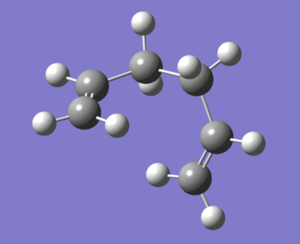
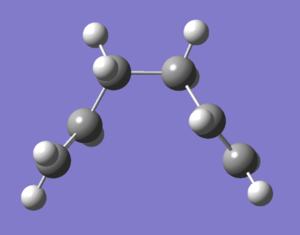
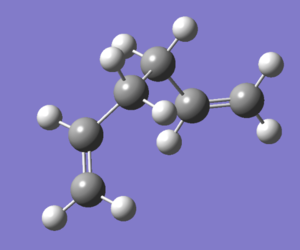
| Summary for Gauche 3. DOI:10042/to-12302 | Summary for Anti 1. DOI:10042/to-12303 | Summary for Anti 2. DOI:10042/to-12304 |
DFT theory results suggest that the lowest energy conformation is Anti 1 with Anti 2 falling behind only slightly. HF, according to Rocque et al[6] treat 1,5-hexadiene too much like n-butane to provide quantitative results, because of the lack of electron correlation. Now that the effect is included, the expected results match with computational findings - the stabilising overlap of the antiperiplanar allyl groups lowers the energy of both anti conformers with respect to Gauche 3.
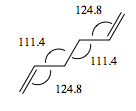
The Anti 2 conformer which takes part in Cope rearrangement was analysed more thoroughly in terms of geometries. The typical bond lengths are 1.54 Å for C-C, 1.35 Å for C=C and 1.50 Å for C-C sp3- sp3. All the bond lengths generated using DFT are significantly more accurate than HF ones - the differences being rather small, however pronounced enough to confirm DFT as a more accurate method for treatment of this molecular system. No literature data was obtained on bond angles, however analysis in terms of typical sp2 and sp3 bond angles would not suffice - there are too many steric interactions in the molecule which would distort the perfect theoretical bond angles. The dihedral angle in the DFT optimised Anti 2 conformer is however perfectly accurate, 180°.
Vibrational Frequency Analysis
In order for geometry to correspond to an energy minimum, the curvature of the energy surface must be positive - the minimum must lie at the bottom of the potential energy well. The surface's curvature is described by the eigenvalues of the Hessian which is the matrix of second derivatives of the energy with respect to geometrical coordinates, all of which must be positive.[11] Positive Hessian elements yield real frequencies and only these ones are desirable in the following vibrational analysis of the Anti 2 conformation.
In principle structural optimisation carried out in the absence of symmetry must result in a local minimum. If one imposes symmetry, one might end up with a structure which is not a global minimum because motion in certain directions will be restricted. To prevent this, no symmetry was imposed on the Anti conformer during optimisation.
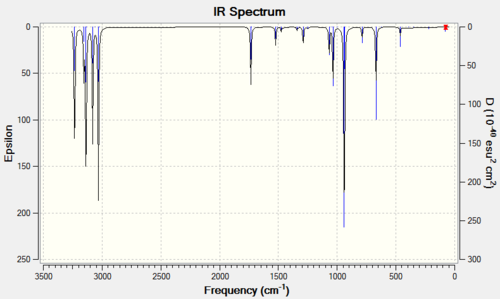
The results of vibrational analysis are presented in Figure 11.
| Stretch Type | Animation | Frequency [cm-1] | Intensity |
|---|---|---|---|
| C=C Asymmetric | 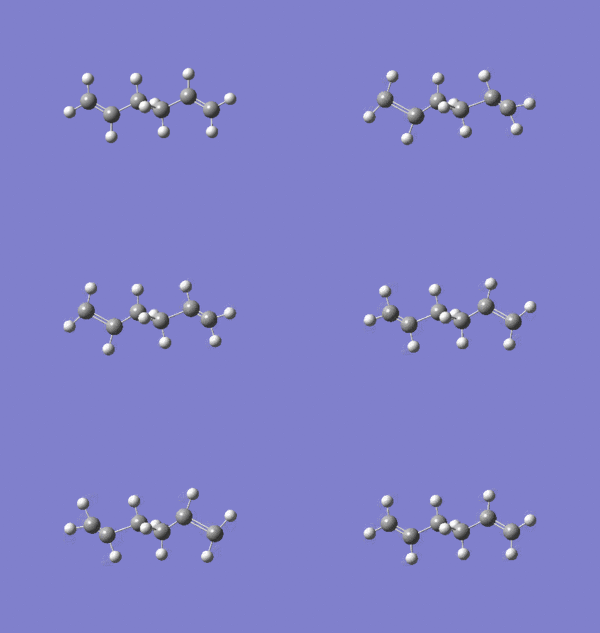 |
1734 | 18 |
| C=C Symmetric | 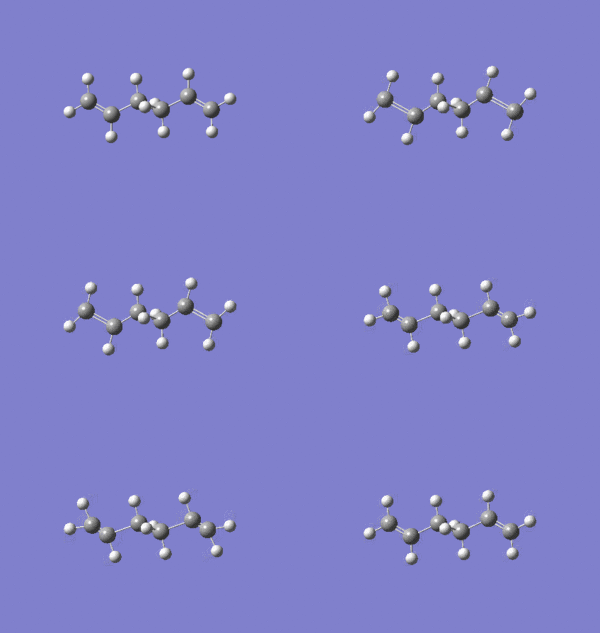 |
1731 | 0 |
The optimisation was a success as no negative frequencies were recorded. The stretches at 1734 and 1731 cm-1 correspond to asymmetric and symmetric C=C stretches, respectively. Other vibrations were not included because most of them have to be treated as bands, like those for CH3 and CH3 stretches. Their location on the spectrum should be familiar to all chemists.
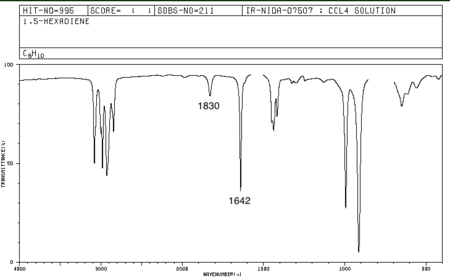
The literature 1,5-hexadiene spectrum was obtained from SDBS. The frequency values obtained do not match with experimental ones, at 1643 and 1830 cm-1. It must however be noted that the IR technique does not distinguish between conformations as rotations around C-C bonds are to fast to be detected on the IR timescale. The experimental IR is therefore an "average picture" of the conformations. The spectrum is available below.
Thermochemistry Analysis
The thermochemistry file, part of vibrational analysis, is presented below, in Figure 13.

It is interesting to compare any values one can find in literature with computational findings. Literature values from the script, obtained using DFT B3LYP/6-31G(d) are accurate to 5 decimal places for the sums of: electronic and zero point energies and electronic and thermal energies. This further confirms that Anti 2 has been detected in the investigation.
Chair and Boat Transition States
The mechanism of the Cope rearrangement involving 1,5-hexadiene has been the subject of heated debate for many years. One of the pathways reconcilable with kinetic experiments suggests that the activated species is an aromatic transitions state with highly delocalised electrons and in which bond breaking and bond making occur simultaneously. There are also studies which present a different point of view in which bond breaking and making are consecutive steps separated by a diradical intermediate.[13]
Shea et al[14] gives a detailed study of the transition states of the reaction. Despite any uncertainties to the mechanism of the reaction, the synthetic utility of the Cope rearrangement is undiminished due to the possibility of formation of 2 transition state conformers: a four-centre or chair-like TS is found to be more stable than the six-centre or boat-like TS. In substituted Cope reagents, the substituents orient themselves such that to occupy the less sterically hindered quasi-equatorial position.
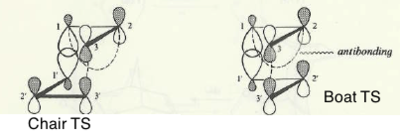
For a comparison, in aliphatic systems the main reasons for the chair preference is an unfavourable through-space secondary orbital interaction present in the boat conformation. Since the original analysis by Woodward and Hoffmann, the chair-boat energy difference has been attributed to secondary orbital interactions which originate from antibonding interactions between two component allyl fragments, as shown in Figure 14.

Attention should be paid particularly to the overlap between C3 and C5, which is greater in the boat transition state. The actual TS for the Cope rearrangement is a resonance hybrid of the two extremes. A study was proposed by the same authors to investigate the importance of the secondary orbital overlap by introducing substituents on both structures and record the effect of the perturbation. It was found that the secondary orbital overlap plays only a minor role in explaining the energy differences between the two conformations.
Computational Location of Transition States
To summarise the concepts from Introduction, chemists recognise a transition state as the structure that lies at the top of a potential energy surface connecting reactant and product. The geometries of transition states on the reaction coordinate are not easily predicted let alone characterised experimentally. While measurements of activation energies relate to the energies of transition states and activation entropies and activation volumes as well as kinetic isotope effects may imply some aspect of a TS, however no experiment can provide direct information about physical properties of an activated species.[11]
To confirm discovery of a transition state using computational methods one must perform two tests:
- Verify that there is only one vibrational frequency by carrying out a normal mode analysis on the anticipated TS. In the previous study of conformations of 1,5-hexadiene the absence of imaginary frequencies was the proof for energy minimisation.
- Verify that the normal coordinate corresponding to the negative frequency smoothly connects reactants and products. To confirm this, an animation is required.
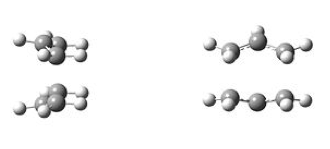
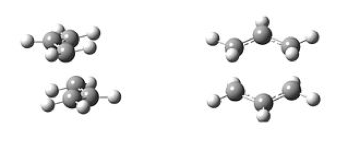
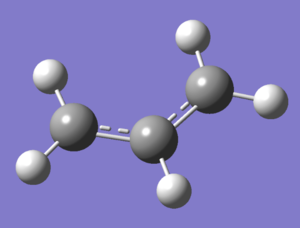
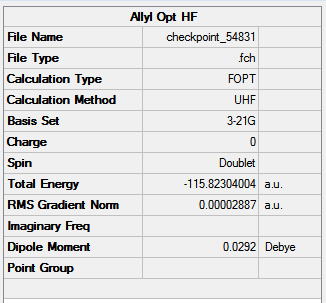
The job of chair and boat transition state optimisation was undertaken in parts and using different approaches to confront the techniques and understand their basic underlying principles. At the very beginning of the journey, an allyl fragment was drawn and optimised using the HF/3-21G level of theory. Manually, a transition state-like structures were assembled and the terminal ends of the two fragments established to be approximately 2.2 Å apart. The chair and boat-like species resembled very closely the ones presented in Figure 15. The results of this optimisation are shown in Figure 16. The rotatable structure is available here.
 |
 |
|||
| Boat TS (C2v Point Group). | Chair TS (C2h Point Group). |
 |
 |
The optimisation facility can be used to locate transition structures as well as ground state structures since both correspond to stationary points on the potential energy surface. Finding a desired transition state directly by specifying a reasonable or educated guess for its geometry might make the task much easier and ensure that one arrives at a global maximum, rather than a local maximum.
Chair Transition State Optimisation Using HF/3-21G
Approach 1
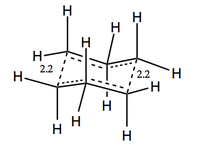
The first approach to optimising the chair transition state was using the Berny Algorithm and optimising to a saddle point making use of the internal coordinates. The method is however sensitive to the potential energy surface curvature and the importance of an accurate first guess structure cannot be emphasised more.
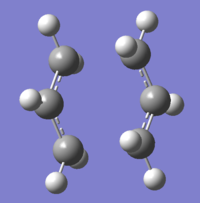
The chair structure was optimised to a TS Berny using HF/3-21G using the keyword Opt=NoEigen, which prevents the calculation from early termination in case a higher order saddle point is found. The results of this job are presented in Figure 17.
 |
 |
 |
The results of this optimisation are satisfying: only one imaginary frequency was located at 818 cm-1 and the animation corresponds to the bond making-breaking synchronisation of the structure.
Approach 2
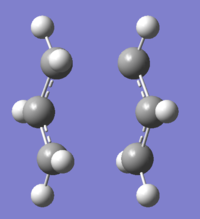
The frozen coordinates method is different from the previously mentioned in its approach to structural restrictions. Prior to an optimisation, the bond breaking and making distance is set to a frozen value of 2.2 Å. This approach can be used if reliable literature values are known and the guessed structure is not far from the actual structure as the calculation is very likely to fail for points far away from TS where the curvature of the space may differ significantly. The method is employed by applying the relevant changes in Redundant Coord Editor and the distinguishable keyword is not Opt=ModRedundant. The results of this optimisation on the chair structure are presented in Figure 18. The rotatable structure can be accessed here.
 |
 |
 |
It can be stated with high certainty that the transition state has been reached as only one imaginary frequency was generated in the optimisation process. It's magnitude is 818 cm-1. The animation clearly shows the carbon terminal ends approaching each other to form a new bond and other carbon atoms moving away from each other which corresponds to bond breaking.
Comparison of Results
Table 5 contrasts the two obtained result sets with regards to crucial parameters that characterise the transition state and confirm it has been traced. These are C-C fragment bond lengths, imaginary frequencies and energies.
| Parameter | TS Berny Optimisation Value | Frozen Method Optimisation Value |
|---|---|---|
| Terminal C-C Bond Length [Å] | 2.02 | 2.02 |
| Energy [Hartree] | -231.6193 | -231.6193 |
| Imaginary Vibrational Frequency [cm-1] | -817.93 | -818.05 |
The optimised C-C terminal bond lengths between the two allyl fragments are found to be 2.02 Å using both optimisation approaches. The initial bond length of 2.2 Å guess was slightly overestimated, however since the RMS gradient is found to be smaller than 0.0003, the tolerance of the root-mean-square of the forces for convergence, it can be assumed that optimisation was successful and that convergence criteria were met. The bond length is significantly longer than the typical C-C bond length, 1.54 Å[16], which suggests that the bond in TS has not been fully formed.
Comparison of the two approaches with regards to important molecular parameters of the chair TS suggests a highly precise set of bond lengths, vibrational frequencies and energies. The latter are in perfect agreement with each other to the nearest 4 decimal places.
The literature electronic energy of the chair TS is -231.619322 Hartree (HF/3-21G), which is again in excellent accordance with the computed data. This proves TS Berny optimisation to be an efficient and reliable tool in finding and defining transition states.
Approach 3
Successful location of a transition state through the above optimisations is however not a guarantee of the right transition structure that connects the reactants and products on a potential energy surface. Examination of the normal mode corresponding to the deformation of the structure is on way to confirm the TS. A more precise method for determining what points on a potential energy surface should be connected by a given TS is an IRC calculation. It examines the reaction path leading down from a transition state. Such a calculation starts at the saddle point and follows the path in both directions from the TS, optimising the geometry of the molecular system at each point along the path. In this way, an IRC calculation definitively connects two minima on the potential energy surface by a path which passes through the transition state between them.
To run an IRC calculation one must:
- optimise the starting transition structure,
- run a frequency calculation on the optimised structure and verify the formation of the transition state,
- perform the IRC calculation to examine the structures that are downhill from the saddle point.
It might be necessary in some cases to increase the number of steps taken in the IRC in order to get closer to the minimum. The MaxPoints option specifies the number of steps to take in each direction as its argument. In the case of the chair transition state, the PES is symmetrical, hence the reaction coordinate will only be computed in the forward direction.
One must however realise that real molecules have more than infinitesimal kinetic energy and will not follow the intrinsic reaction path. Nevertheless, the IRC method provides a convenient description of the reaction profile.[17]
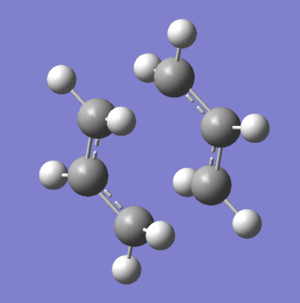
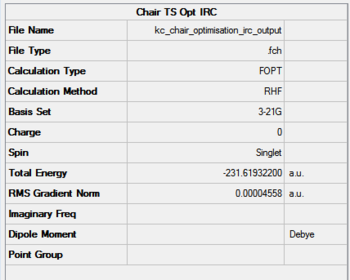
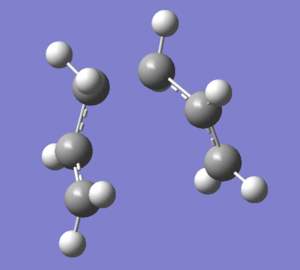
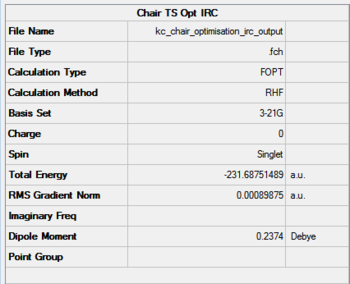
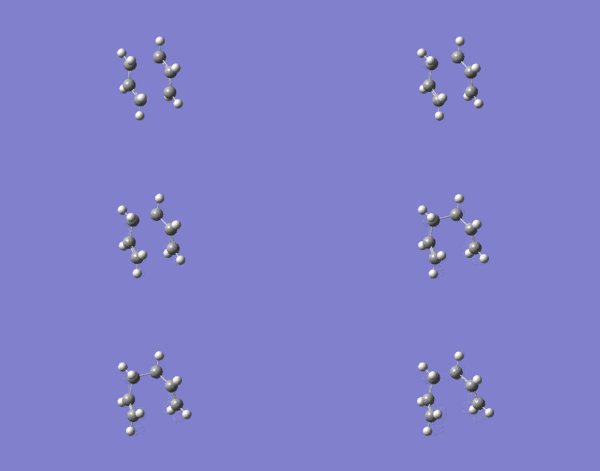
The initial IRC analysis for the chair transition state included taking 50 step from the saddle point under HF/3-21G. The results are presented in Figures 19-21. Figure 19 presents the summary and structure of the first iteration, while 20 the last point. The IRC animation is present in Figure 21.
 |
 |
 |
 |
The most important data in the IRC method are energy and RMS gradient graphs. One recognises that a minimum geometry has been reached if the RMS gradient approaches zero. The convergence criteria states that the root-mean-square of the forces must be below 0.0003. From Figure 22 it is obvious that the minimum geometry has not been found and the IRC method has to be modified.
 |
 |
There are 3 different ways one can improve on the initial IRC failure:
- Taking the outcome of the last IRC interaction and performing a TS Berny optimisation on it - the method is very simple and quick, however if one is far from the minimum, there is a risk of ending in the wrong one. This method will be referred to as Method 1.
- Increasing the number of points to reach the minimum geometry - might provide good results however if too many points are specified, the wrong structure might be determined. This method will be referred to as Method 2.
- Performing a full IRC analysis which computes force constanst always at every step - thought to be the most reliable however also most computationally expensive method, very often impossible to be used for large molecule. This method will be referred to as Method 3.
Method 1
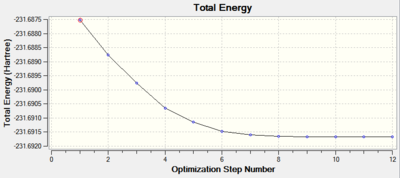
The results of this approach are presented in 23.
 |
 |
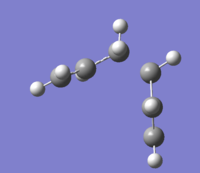
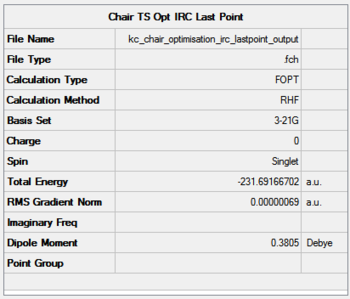
It can be seen that the progress of reaching the minimum energy is smooth, however the gradient changes dramatically throughout to finally converge to a desired value of less than 0.0003. The optimisation summary, structure and optimisation animation are shown in the Figure below. For a rotatable structure, click here.
 |
 |
 |
Method 2
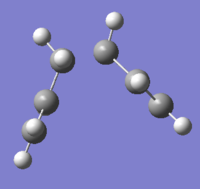
The results of Method 2 are presented below. The number of steps taken down the reaction pathway in the forward direction is 100.
 |
 |
It can be seen that the progress of reaching the minimum energy is smooth and that the gradient smoothly converges to a value of 0.00001. The optimisation summary, structure and optimisation animation are shown in the Figure below.
 |
 |
 |
Method 3
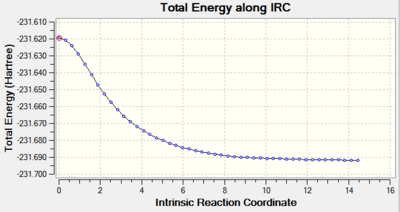
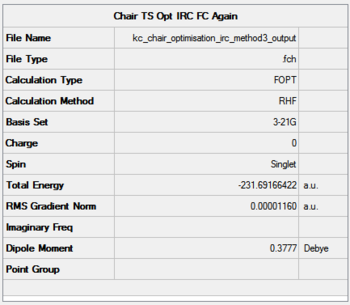
The results of Method 3 are presented below. 50 steps were computed to reach the energy minimum and force constants were calculated at each point.
 |
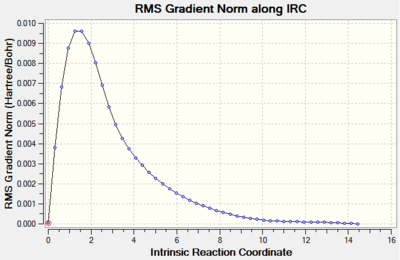 |
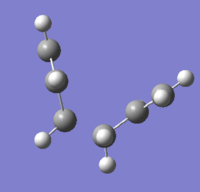
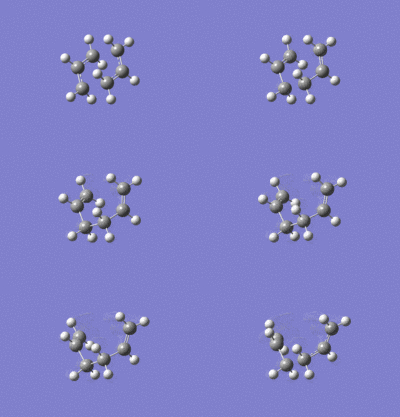
It can be seen that the progress of reaching the minimum energy is smooth and that the gradient smoothly converges to a value of 0.00001. The optimisation summary, structure and optimisation animation are shown in the Figure below. For a rotatable model, click here.
 |
 |
 |
Comparison of Results
The energies yielded by the different methods are:
- Initial IRC: -231.68751489 Hartree
- Method 1: -231.69166702 Hartree
- Method 2: -231.69166522 Hartree
- Method 3: -231.69166422 Hartree
The electronic energy of the chair TS (HF/3-21G) as outlined in the script is -231.619322 Hartree which is in a rather poor agreement with the computed values. The energies are however very precise and in the case of Methods 2 and 3, they agree to four decimal places. The lowest energy was computed using Method 2.
The energies of Methods 1, 2 and 3 match the Gauche 2 conformer energy very closely, as shown below.

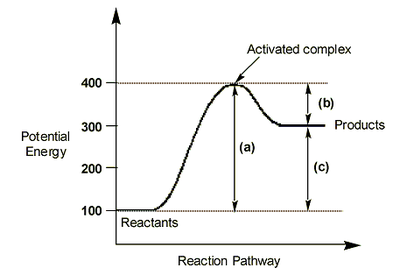
The Cope rearrangement proceeds via the lowest energy conformation Anti 2 as determined by DFT analysis. It is not relevant to compare calculations generated using two different methods, HF and DFT and different basis sets. As seen from the set of data obtained above via HF method, the chair transition state is a late transition state occurring in the product channel as its energy determined by IRC resembles one of the 1,5-hexadiene conformers, Gauche 2. This has been concluded on the basis of the Hammond Postulate introduced in 1955. An illustration is presented below.
Chair Transition State Optimisation Using DFT B3LYP/6-31G(d)
Starting with the HF/3-21G TS Berny optimised chair structure, a DFT B3LYP/6-31G(d) calculation was performed. DFT methods are appealing to computational chemists as they include the effects of electron correlation - the fact that electrons in a molecular system react to one another's motion and keep out of one another's way. HF calculations only include this effect in an average sense - each electron sees and responds to an averaged electron density in a molecule - while methods including electron correlation account for the instantaneous interactions of electrons with opposite spin. This causes HF to be, most probably, less accurate for the 1,5-hexadiene system.
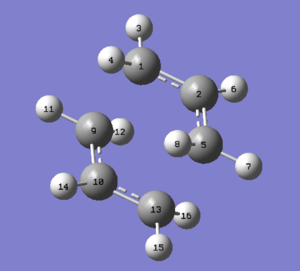
The results of the performed DFT optimisation on the HF TS Berny chair structure are presented in Figure 30 below. For a living optimised chair TS, click here.
|
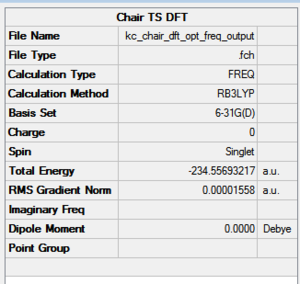
|
There are a few important points that have to be mentioned before any further vibrational analysis is carried out. The characteristics one is probably the most interested in are the RMS gradient and energy convergence. These can be extracted from the log files. Below is a proof of a successful optimisation: four times YES for convergence.

For the sake of later analysis, the key phrases in the log file excerpt above are explained below. For a successful convergence:
- the forces must be essentially 0 and the maximum component of the force must reach a value below 0.00045 - in this case, a value of 0.000037 was recorded,
- the previously mentioned RMS gradient must be below 0.0003 - in this case it is 0.000007 - an almost ideal value,
- the displacement for the next step must be smaller than 0.0018 - in this case the value is 0.000157 - this is satisfactory,
- the RMS of the displacement for the next step must be 0.0012 - in this case it is 0.00057.
The electronic energy of the chair TS computed, -231.556332 Hartree, agrees very well with the script value, -234.556983. This suggests that the HF level of optimisation produced a result good enough to yield an excellent agreement in the next optimisation step. No comparison between DFT and HF generated energies will be made as it is not possible to relate the values to each other. The assumptions between the two methods disqualify direct comparison of energies.
Table 6 shows a comparison of geometric parameters of the chair TS using two different levels of theory.
| Geometry Parameter | HF/3-21G Optimisation | DFT B3LYP/6-31G(d) Optimisation |
|---|---|---|
| C-C Interfragment Bond Length [Å] | 2.02 | 1.97 |
| C-C Bond Length [Å] | 1.39 | 1.41 |
| C-C-C Angle [°] | 120.53 | 119.91 |
| C-C-C-C Dihedral Angle [°] | 68.5 | 65.2 |
The bond lengths and angles generated by the two different methods are very precise, differing by no more than 0.05 Å in the case of bond lengths and 3° in the case of angles. The DFT interfragment C-C bond length is however closer to the true C-C bond length of 1.54 Å. This suggests that bond has not yet been fully developed.
To complete the DFT optimisation of the chair structure, one has to examine any imaginary frequencies generated in the calculation. The sole negative frequency, -569 cm-1, proves the location of a TS. The value differs significantly from the HF vibration at 818 cm-1. A possible explanation for the discrepancy lies in the C-C interfragment bond length. The closer one gets to the single C-C bond length, the closer one gets to the reaction product. The DFT optimised chair resembles the product more than the HF optimised one. This has a pronounced effect on the imaginary frequencies - they disappear once the minimum energy has been found. Once past the saddle point in the direction of the products, provided no higher order saddle point are present, a bond develops and the structure steps down the energy ladder to end up in the lowest energy conformation. The frequency animation is shown in Figure 31 below.
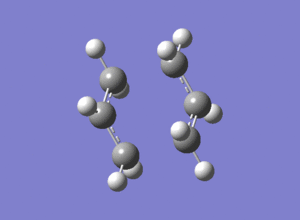
Boat Transition State Optimisation Using HF/3-21G
It is high time to move on to the boat TS structure and optimise it using the available techniques. One which was not yet explored in this investigation is the QST2 method. The option requires an input of two structures, the reactant and the product. The algorithm is to interpolate between the two to locate a transition state somewhere half way in between. For any calculations to work, one must number both structures correctly so that each reactant atom corresponds to its counterpart in the product accordingly.
Since the Cope rearrangement takes place in the Anti 2 conformation. The molecules were placed on the Gaussview input space simultaneously and arranged as shown in Figure 32.
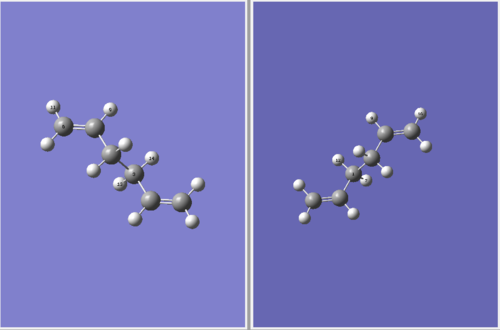
Via the Atom List editor, one an renumber the atoms, if necessary. Unfortunately due to technical problems, it is impossible to visualise labels on all the atoms.
The results of the optimisation are shown in Figure 33 below. Clearly, the job failed and the resultant structure resembles the chair TS. The central C-C bond is now 5.94 Å as the program did not allow for rotation. For a rotatable structure, click here.
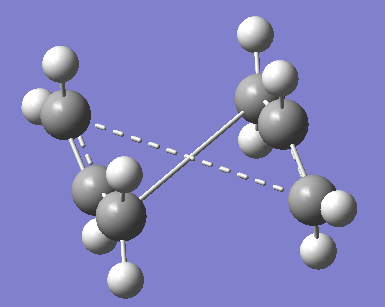
It is therefore obvious that starting with the above reactant and product structures will not locate the true boat transition state. To fix the problem, a slight modification must be introduced: the central C-C-C-C dihedral angle should be adjusted to 0° and the two inside C-C-C bonds to 100°. A visualisation of these changes is shown in Figure 34.

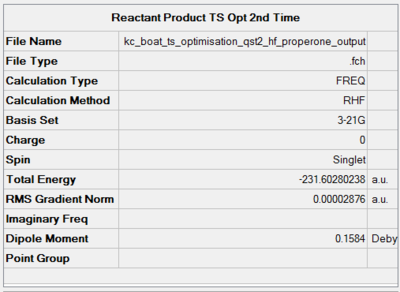
The results of the QST2 optimisation are presented in Figure 35. To rotate the optimised structure, click here.
 |
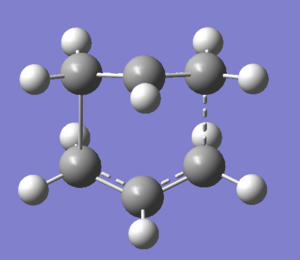 |
The optimisation was a success as the RMS gradient is 0.000028. The computed electronic energy is in perfect agreement with the script value under HF/3-21G, -231.602802 Hartree. This suggests a reasonable guess reactant and product geometries to begin with. A possible expansion of this method could be guessing a transition state and running a QST3 job.
To confirm location of the TS, the imaginary frequency has to be investigated. The unique value is 840 cm-1 and the vibration mode is shown in the animation embedded in Figure 36.
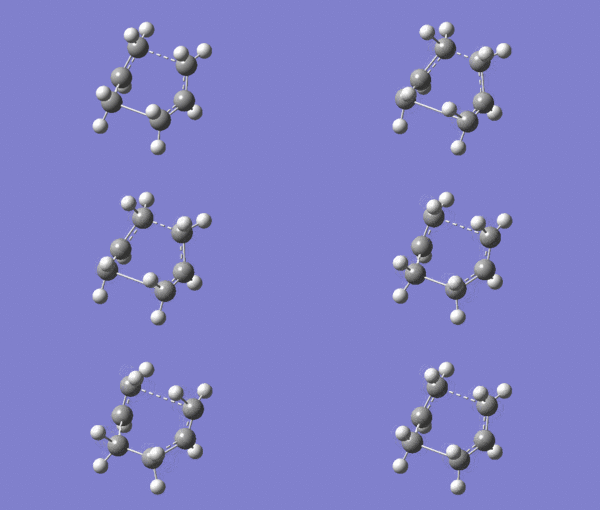
Similar to the chair TS, an IRC analysis was run on the optimised boat TS. The four employed methods were the same: Initial IRC and Methods 1, 2 and 3.
Initial IRC
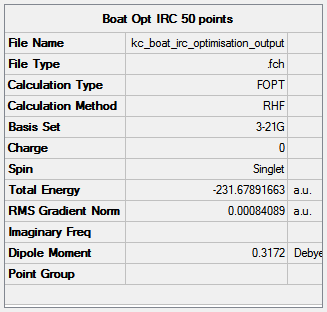
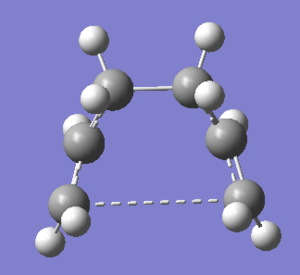
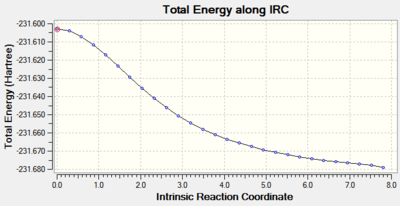
The results of the initial IRC analysis are presented in Figures 37 and 38. 50 steps were set along the reaction pathway in the job.
 |
 |
The most important part of the analysis is inspection of both energy and RMS gradient curves.
 |
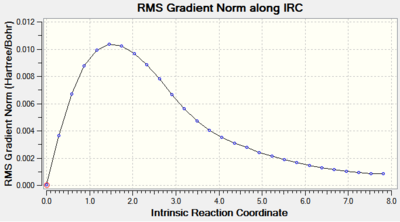 |
Clearly the IRC was not successful as the RMS gradient value is way off the maximum limit - 0.0008. This is depicted in the RMS Gradient Plot by the curve not managing to converge to 0.
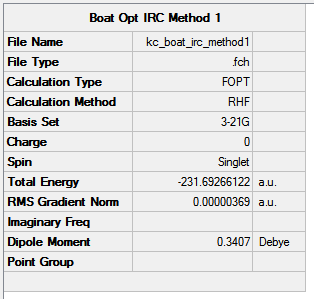
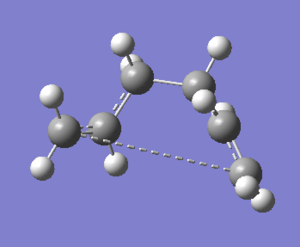
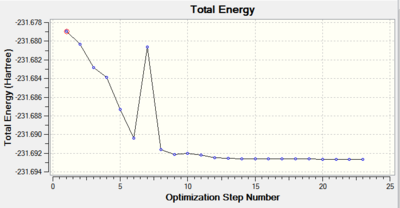
Therefore, Method 1, with the same principles must be employed in the next stage. The results are presented here.
 |
 |
 |
 |
The convergence criteria were clearly met: RMS gradient value of 0.000004 is close enough to 0 for the optimisation to be considered successful.
Method 2
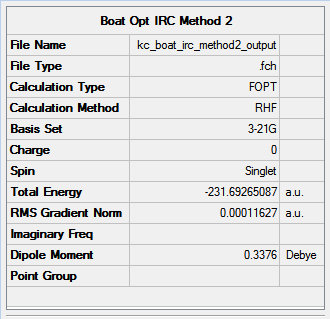
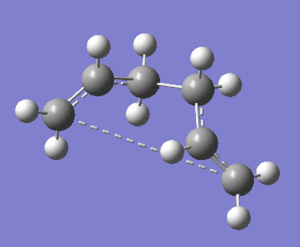
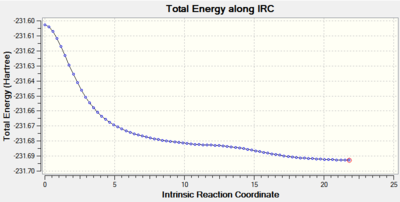
Method 2 was employed in exactly the same way as in the case of chair: 100 steps were taken along the reaction pathway. The results can be found in Figures 41 and 42.
 |
 |
 |
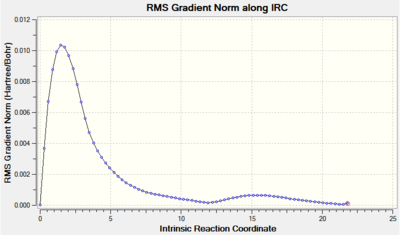 |
The RMS gradient after smoothly converging to a stationary point veers off in the wrong direction, eventually ending up at the minimum value of 0.0001. The value is however still quite close to the limit of 0.0003, hence the above IRC analysis cannot be called entirely successful.
Method 3
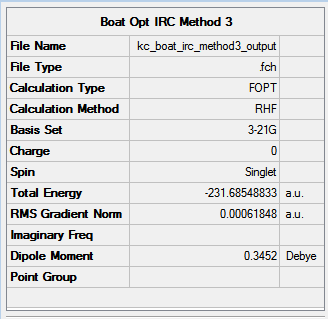
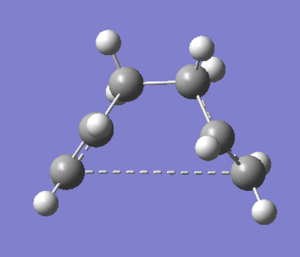
The results of Method 3, employed in exactly the same way as on the chair TS, are presented below.
 |
 |
 |
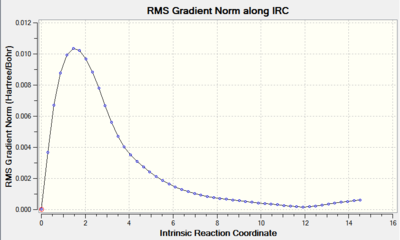 |
The RMS gradient value is larger than 0.0003 by 0.0003 which disqualifies Method 3 for Boat TS. Convergence criteria have not been met.
Comparison of Results
Having performed full IRC analysis on the boat species, it is high time to compare the results. The generated electronic energies are:
- Initial IRC: -231.67891663 Hartree
- Method 1: -231.69266122 Hartree
- Method 2: -231.69265087 Hartree
- Method 3: -231.68548833 Hartree
The energies are fairly precise, oscillating about a value of -231.69 Hartree. The lowest energy was computed using Method 1 and together with an excellent RMS gradient of 0.000004 this job was probably the most successful of all. The energy value is very similar to the Gauche 3 conformation energy of -231.69266, suggesting that the TS occurs in the product channel and possesses a late activation barrier. The HF computation therefore establishes that the transition state closely resembles the Gauche 3 conformer shown immediately below. The optimisation visualisation for Method 1 is shown in Figure 45. It is also possible to see the structural resemblance of the boat TS and Gauche 3.

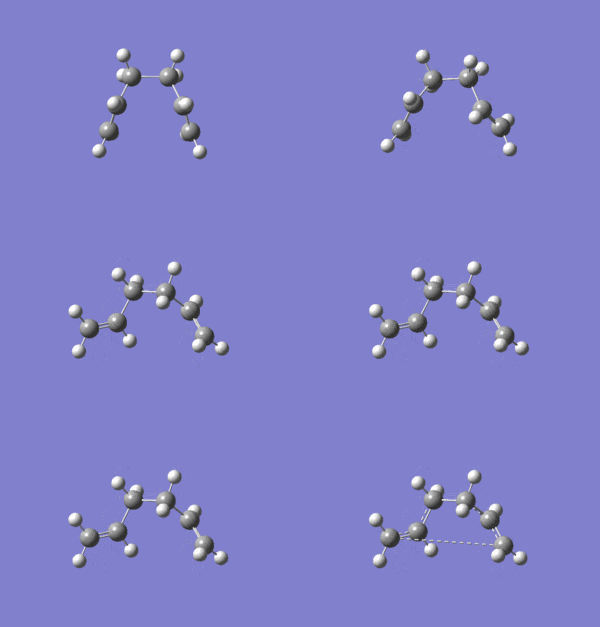
Boat Transition State Optimisation Using DFT B3LYP/6-31G(d)
The HF/3-21G generated boat TS was reoptimised using a higher level of computational theory. The results can be viewed in Figure 46. Access a clickable structure here.
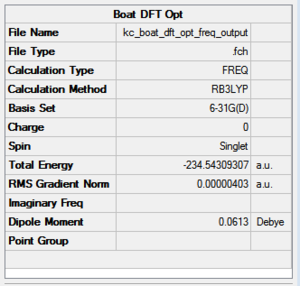 |
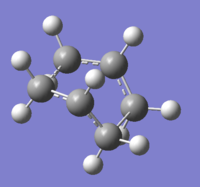 |
The computed energy agrees very well with the script value, -231.54309 and -231.54309 Hartree. This suggests a highly accurate level of TS optimisation using the previous HF method.
To confirm that the boat transition state has been tracked down, an inspection of frequencies was made. The only negative vibration happens to be at -530 cm-1. Just like in the case of the chair structure, there is a huge discrepancy between the imaginary frequencies of 310 cm-1. For geometrical analysis, refer to Table 7.
| Geometry Parameter | HF/3-21G Optimisation | DFT B3LYP/6-31G(d) Optimisation |
|---|---|---|
| C-C Interfragment Bond Length [Å] | 2.14 | 2.21 |
| C-C Bond Length [Å] | 1.39 | 1.41 |
| C-C-C Angle [°] | 121.68 | 122.27 |
| C-C-C-C Dihedral Angle [°] | -64.78 | 64.19 |
Most of the presented parameters are very precise within the two given methods. The biggest difference arises in the C-C interfragment bond length. The HF optimized fragment is 0.08 Å longer than its DFT counterpart. The previous argument about bond length and imaginary frequency value does not seem to hold in this case. A possible reason for this might be, just like with electronic energies, the incompatibility of the two different methods employed. Most probably, frequency values are intrinsic to each method. The animated imaginary frequency is shown in Figure 47.
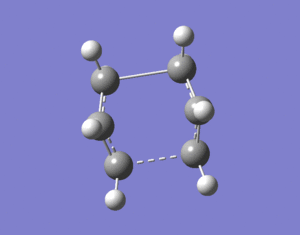
Chair and Boat Transition State Activation Energies
All frequency calculations include thermochemical analysis of the system. By default, this is carried out at 298.15 K and 1 atm using the most abundant isotope for each element. Gaussian also anticipates various important thermodynamic quantities at the specified temperatures and pressures, including thermal energy corrections, thermodynamic parameters such as, among all, vibrational or rotational temperatures.
The thermochemistry output section also provides data on the zero-point energy of the system. The zero-point energy is a correction to the electronic energy of the molecule to account for the effects of molecular vibrations even at 0 K.
The thermochemistry section of the DFT optimised chair transition state is presented in Figure 48.

When comparing calculated results to thermodynamic quantities extrapolated to zero Kelvin, the zero point energy needs to be added to the total energy. As with the frequencies themselves, this predicted quantity is scaled to eliminate known systematic errors.
In order to anticipate the energy of a system under investigation at a higher temperature, a thermal energy correction must be added. This allows for the inclusion of the effects of molecular translation, rotation and vibration at a different temperature and pressure.[17]
The output presents the following values:
Sum of electronic and zero-point energies = E0 = Eelec + ZPE(zero-point energy)
Sum of electronic and thermal energies = E = E0 + Evib + Erot + Etransl
Sum of electronic and thermal enthalpies = H = E + RT
Sum of electronic and thermal free energies = G = H - TS
The computed data agrees very well with the script values. The sum of electronic and zero-point energies for the latter is -234.414919 and the sum of electronic and thermal energies is -234.408998 Hartree. The values therefore agree to 3 decimal places and can be considered very accurate.
The thermochemistry section of the boat transition state, optimised through the same method is shown below.

This time as well, the computational data is in excellent agreement with the script reference values. In the case of the sum of zero-point and electronic energies the value is correct to 3 decimal places. In the other case, the numbers are the same until the second decimal point.
Once the IRC analysis has established the minima connecting the saddle point, it is possible to calculate an activation energy of the reaction. This is the difference in the sum of the electronic and thermal energies between the TS and the product. The general meaning of activation energy is a minimum internal energy barrier that has to be overcome for a chemical reaction to occur.[19] It is related to temperature by the Arrhenius equation. The activation energies for both chair and boat transition states for DFT B3LYP/6-31G(d) are presented in Table 8 below.
| Transition State Geometry | Activation Energy at 298.15 K [kcal/mol] using HF/3-21 | Activation Energy at 298.15 K [kcal/mol] using DFT B3LYP/6-31G(d) | Activation Energy at 0 K [kcal/mol] using HF/3-21 | Activation Energy at 0 K [kcal/mol] using DFT B3LYP/6-31G(d) | Experimental Activation Energy at 0 K [kcal/mol] |
|---|---|---|---|---|---|
| Chair | 44.7 | 33.2 | 45.7 | 34.1 | 33.5 ± 0.5 |
| Boat | 54.8 | 41.3 | 55.6 | 42.0 | 44.7 ± 2 |
Theoretical values generated using DFT B3LYP/6-31G(d) agree relatively well with experimental data for the boat transition state at 0 K with the difference between about 3 kcal/mol. The chair TS activation energy was on the other hand predicted with a better accuracy of 1.4 kcal/mol. The Hartree-Fock generated values are in poor agreement with literature, being out by about 10 kcal/mol each time.
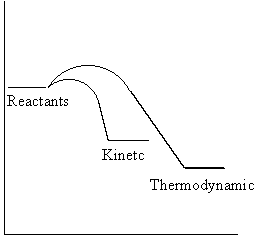
For each set of values, activation energy is always higher for the boat transition state. It has a higher activation energy and a higher energy barrier to be overcome by the molecules. This means that a lot of heat must be supplied to the system to achieve a reasonable reaction rate. The chair TS is more accessible and hence under kinetic control (lower temperatures, short reaction times), the reaction will proceed via the chair-like transition state. For very high temperatures and long reaction times (thermodynamic control), the system has enough energy to equilibrate and the boat-like TS reaction pathway is accessible. This is represented on the graph below.
With increasing temperature, the activation barrier height decreases which is reflected by the trend in the activation energies above. This is because the molecules possess certain kinetic energy which makes them more likely to surmount the barrier than those at 0 K, where only zero-point energy, which allows them to oscillate at absolute zero in order to preserve the Heisenberg uncertainty principle.
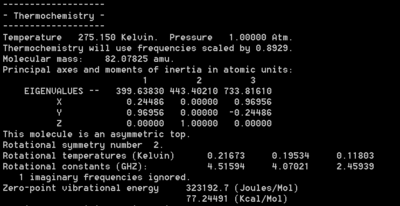
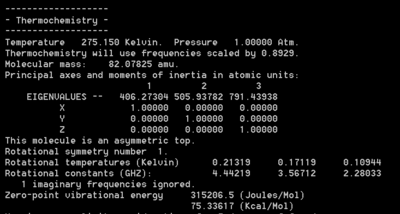
A similar analysis was also carried out using the utility program FreqChk to obtain a thermal correction to the sum of electronic and thermal energies at room temperature, 273.15 and 1 atm. The new zero point energy in the chair TS is 77.2 kcal/mol and in the boat TS it is 75.3 kcal/mol. The proof can be found below in Figure 60.
 |
 |
The electronic energy of the chair TS is lower than that of the boat TS by 0.01389 Hartee. The value may not seem large but one must bear in mind the units. In kcal/mol, the difference equals 8.7. It still seems too low, bearing in mind the experimental value of 11.1 kcal/mol.[21] Generally it is held that the reaction proceeds via a four-centre, chair-like geometry with C2h symmetry.[13] An asynchronous mechanism where bond formation preceded bond cleavage giving a biradical intermediate was suggested.[22] It is shown in Figure 61.
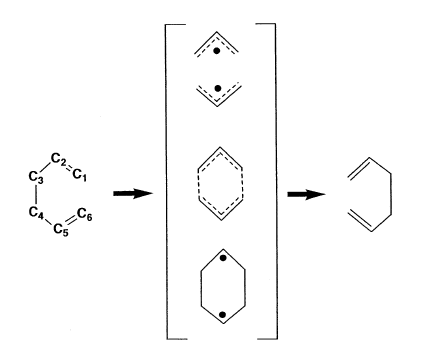
The reason for this destabilisation of the boat-like transition state are 1,4-flagpole interactions and eclipsing interactions between vicinal hydrogens. Flagpole interactions should bring the energy of the boat transitions state much higher than in reality, however because carbon atoms C2 and C5 each carry only one hydrogen and eclipsing relationship is less severe because of the separating distance, the difference in energy is not that pronounced.[11]
Another reason is provided by Fleming.[23]. Inspection of frontier orbitals of both transition states reveals an unfavourable antibonding interaction, absent in the chair TS.
Diels-Alder Cycloaddition Study
For more than 70 years, the Diels-Alder reaction, or [4+2] cycloaddition reaction has remained as one of the most powerful organic transformations in chemical synthesis, particularly in obtaining polycyclic rings. In most cases the cycloaddition proceeds quite well by simply mixing the substrates because the usual dienophiles have a carbonyl or equivalent group that, through conjugation, lower the energy of the LUMO antibonding π orbital to an appropriate level for the reaction with the diene HOMO.[24]
In the Cope rearrangement Hartree-Fock and DFT were employed to perform calculations, in Module 2 the main focus was on density functional theory, pseudopotentials and the differences between different basis sets whereas in Module 3 the large organic systems were modelled using Molecular Mechanics. In the Diels-Alder study all calculations are carried out using semi-empirical methods.
The main disadvantage of ab initio is their cost. It is possible to introduce further approximations in order to significantly reduce cost while still retaining the underlying quantum mechanical formalism. AM1 is certainly one of the most popular methods for application to organic chemistry. It provides a good account of equilibrium structures and usually reproduces transitions state geometries obtained from higher level calculations. It is less satisfactory dealing with geometries of the molecules incorporating second row and heavier elements.[11]
Reaction of Butadiene and Ethene
In the reaction of butadiene and ethene, the former is the diene and the later is the dienophile. The diene component in the Diels-Alder reaction can be open-chair or cyclic and it can have many different kinds of substituents. There is only one limitation - it must be able to take up the s-cis conformation. Butadiene normally prefers the s-trans conformation with two double bonds far away from each other for steric reasons.
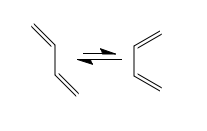
The popular dienes used in Diels-Alder reaction usually have an electron withdrawing group conjugated to the alkene. There must be some conjugation - at least a phenyl group or a chlorine atom - or the cycloadditon does not occur. The reaction under investigation, the Diels-Alder reaction of butadiene and a simple ethene occurs in poor yield.[4]

In the above pericyclic reactions two new σ bonds are made and it is believed that the process is concerted. Most such reactions are little influenced by Coulombic forces - the polarity of the solvent has little effect on the rate of Diels-Alder reactions. It can therefore be concluded that the main factor in charge of the reactivity is the size of the frontier orbital interaction.[23] The first step in the study being undertaken is therefore optimisation of cis-butadiene and ethene geometries and generation of their molecular orbitals using the AM1 semi-empirical molecular orbital method.
Molecular Orbital Analysis of Reactants
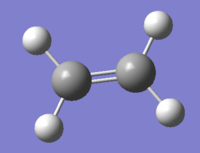
The HOMO and LUMO orbitals of ethene and butadiene were generated by optimising the geometries and accessing the Edit: MO tab in Gaussview. The results of this work are shown in Figures 64 and 65.
 |
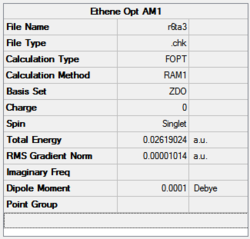 |
The energy value clearly converged to a minimum since the RMS gradient is 0.000001.
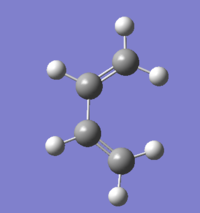 |
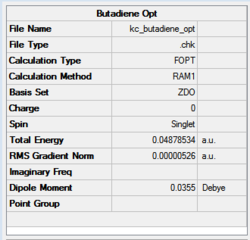 |
Similarly, in this case, the energy value clearly converged to a minimum since the RMS gradient is 0.000005.
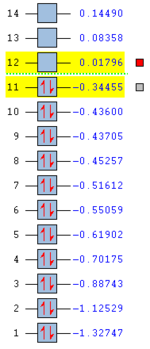
The HOMO-LUMO orbital pair for butadiene looks like the one shown in Figure 66.
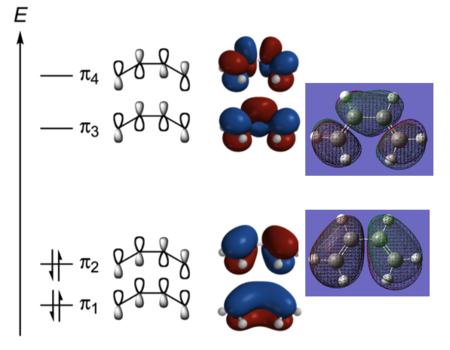 |
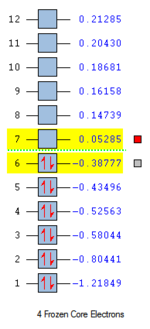 |
The HOMO of butadiene possesses a node between C2 and C3 which represents the area of no possible overlap between the green and red orbitals. The bond order is 1 and the orbital contains two electrons. The molecule is destabilised with respect to HOMO-1. The orbital is antisymmetric with respect to the plane of symmetry.The LUMO of butadiene is an overall antibonding orbital with two nodes which is symmetric with respect to the plane of symmetry. The bond order is -1. The HOMO-LUMO gap is about 156 kcal/mol. This is a considerable energy difference to overcome. The Gaussian generated MOs correspond very well with the simplified LCAO approach molecular orbitals.
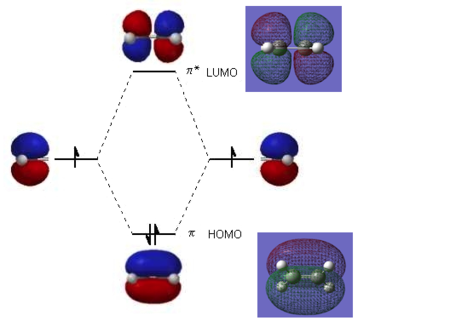
The HOMO and LUMO orbitals for ethene were generated to look like the ones below.
 |
 |
The ethene LUMO has two nodes and is a result of an overlap of two p orbitals. The presence of a node destabilises it, making it an antisymmetric antibonding orbital. The HOMO orbital is a bonding orbital formed in the linear combination of p orbitals on the carbon. It is a symmetric orbital. The HOMO-LUMO gap is 289 kcal/mol which that it is difficult for ethene to access its LUMO. The computationally generated molecular orbitals of ethene correspond very well with literature ones.
Transition State Localisation using AM1
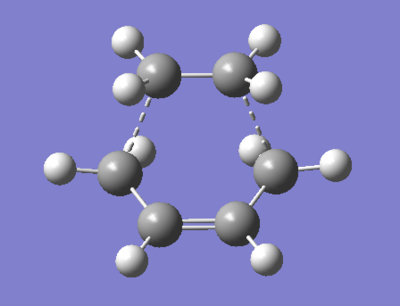
The transition state for the reaction has an envelope-type structure in order to maximise the overlap between the π orbitals of ethene and butadiene. Its sketch is shown in Figure 70 below.
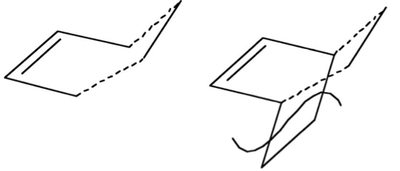
The transition state was drawn using the bicyclo template and removing the -CH2CH2- fragment. The two fragments were then optimised separately using AM1 and recombined to reform the transition state. The interfragment distance was set to 2.2 Å, as found in literature.[27]
The results of the TS Berny optimisation are shown in Figure 71 below. For a rotatable structure, click here.
 |
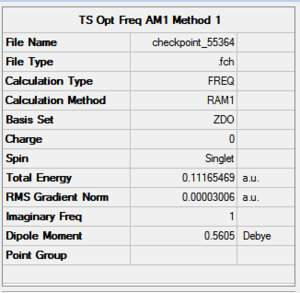 |
The RMS gradient is 10 times smaller than the limit value for convergence of 0.0003. The frequency analysis has revealed only one negative frequency - a proof of formation of the transition state. The motion is animated below.
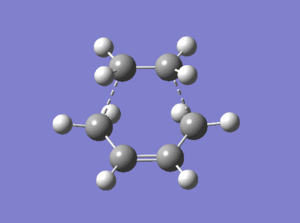
The motion is an illustration of the concerted bond breaking and making in a Diels-Alder cycloaddition. One can also observed the change of hybridisation of the carbon atom - from sp2 hybridised ethene to sp3 hybridised ethyl moiety. The H-C-H bond angle changes from 120 to 109.5°.
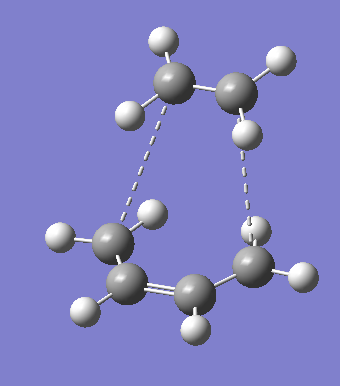
The next step in the analysis was IRC calculation using force constants. Because of the computational demand, the method takes a few minutes longer than the simple TS Berny optimisation. The results are presented in Figure 73.
 |
 |
The RMS gradient value for this IRC analysis is the lower than 0.0003, however still significant enough to discard to call the method relatively satisfactory. The IRC method with computation of force constants at every step for 50 iterations is the most reliable, so it was the natural choice bearing in mind the limited time available for assignment completion. Whether this is just an incomplete calculation or failure of IRC analysis on this particular AM1 optimised system is not know. To be able to comment on it, one would have to complete analysis of different molecular systems and compare with literature values.
Transition State Localisation using DFT B3LYP/6-21G(d)
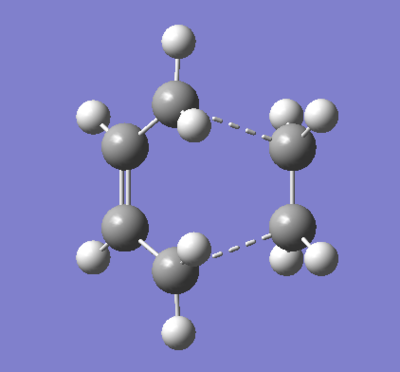
A similar study was carried out using a more computationally advanced method, the well known DFT B3LYP/6-31G(d). First, the ethene and butadiene fragments of the envelope transition state were optimised to a minimum energy, reconnected to form the transition state with the guessed C-C interfragment bond length of 2.2 Å and optimised using the the 'Opt+Freq' job type to a TS Berny. The results are presented in Figure 74.
 |
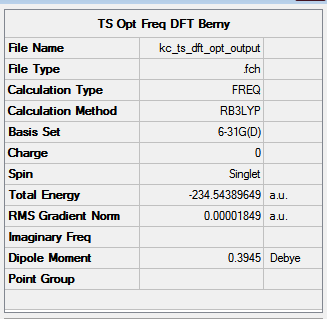 |
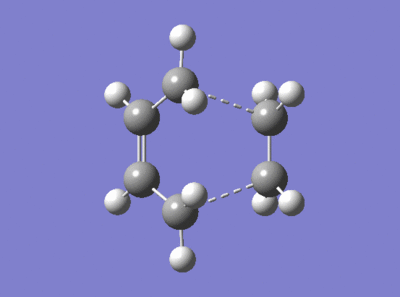
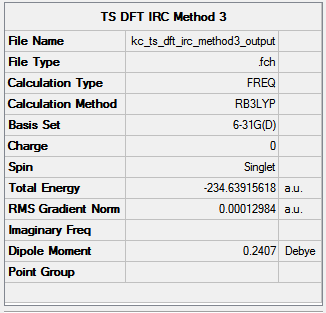
To prove a successful Berny TS optimisation one must identify one imaginary frequency. The visualisation of the unique negative frequency at 525 cm-1 is represented in Figure 75.
Another IRC calculation was carried out, this time on the DFT optimised transition state. A quick recap: this calculation type keyword requests that a reaction path be followed by integrating the intrinsic reaction coordinate. IRC calculations require initial force constants to proceed - these are provided in the checkpoint or formatted checkpoint file from the preceding frequency calculation.[28] The specific keyword for this job type is CalcFC. The results are presented below, in Figure 76.
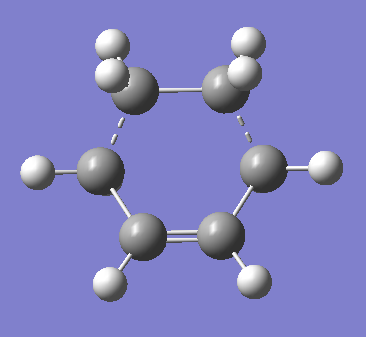
The bell-like shape of the energy graph suggests successful convergence to a minimum along the reaction pathway from the saddle point. The RMS gradient, near the end of the iterations, falls down to a minimum value of 0.0001, similar to the one obtained via the IRC analysis of the AM1 optimised transition state. The summary and structure of the envelope are present in Figure XXX.
 |
 |
 |
 |
Comparison of Results
Geometries of the TS Berny optimised structures were contrasted with each other and typical literature values.
| Geometry Parameter | AM1 Optimisation | DFT B3LYP/6-31G(d) Optimisation | DFT Literature Values[29] |
|---|---|---|---|
| C-C Interfragment Bond Length [Å] | 2.12 | 2.27 | 2.27 |
| C-C Bond Length [Å] | 1.38 (former ethene)
1.38 (former diene) |
1.39 (former ethene)
1.38 (former diene) |
1.39 (former ethene)
1.38 (former diene) |
| C=C Bond Length [Å] | 1.40 (newly formed) | 1.41 (newly formed) | 1.41 (newly formed) |
The literature structures (taken from the same source) with labelled bond lengths of the TS, reactants and products are available in Figure 78.

The DFT generated bond lengths of the transition state are in perfect agreement with literature for all the values. The AM1 values, although the foundations of the method and calculations employed differ, give similar results, differing only for the interfragment bond.
To complete the geometry analysis, in Table 10 the typical C-C and C=C bond lengths were collected.
| Bond Type | Length [Å] |
|---|---|
| C-C | 1.54 |
| C=C | 1.35 |
| C-C sp2-sp3 | 1.50 (newly formed) |
It can be seen from the values that the DFT transition state has more loose character than its AM1 counterpart because of its length. The bond formed between the fragments is a C-C sp3- sp3 bond, typically 1.54 Å in length. This implies that the AM1 transition state is a later transition state than the DFT one as it resembles the products more. The former double bonds of the diene and ethene are about 1.38-1.39 Å, longer than the typical double bond length but still not a fully sp3- sp3 hybridised bond. The central former butadiene bond in the transition state is now about 1.40-1.41 Å, still not yet a fully developed double bond, however much shorter than a typical C-C single bond. The butadiene-ethene DA reaction transition state is most probably located in the product channel and to tip the system over to the product site, molecules have to possess vibrational energy of the correct phase.
Molecular Orbital Analysis of Transition State
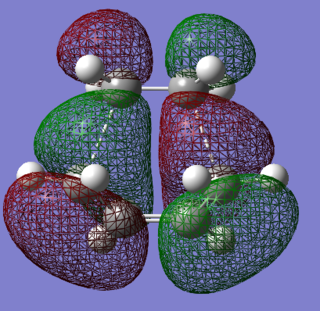
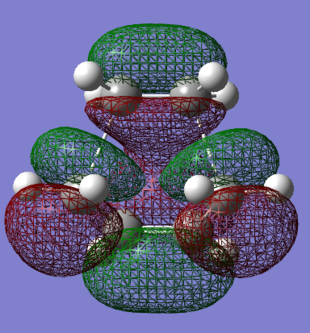
The HOMO and LUMO of the envelope transition states were generated using AM1 semi-empirical methods. They are presented in Figures 79-81.
 |
 |
 |
The HOMO orbital is asymmetric and has an energy of -0.32 Hartree, while the LUMO is a symmetric orbital with an energy of 0.023 Hartree. The HOMO-LUMO gap is therefore equal to about 215 kcal/mol. The resultant orbitals can be characterised as follows:
- HOMO: a weakly bonding orbital, destabilised by the presence of nodes, formed by an overlap of the ethene LUMO and butadiene HOMO orbitals
- LUMO: antibonding orbital, mdestabilised by the presence of more nodes than in HOMO, formed by an overlap of the ethene HOMO and butadiene LUMO orbitals
In the above orbitals, the orbital being formed is bonding wherever new bonds are being made. A favourable orbital interaction is the one in which the electron demand is fulfilled - the electron-rich butadiene HOMO donates its electron density into the low-lying π* LUMO of the electron-poor ethene. The best overlap is formed between orbitals of similar energies and sizes - the splitting is large and the bonding orbital experiences significant relative stabilisation.
Reaction of Maleic Anhydride with Cyclohexa-1,3-diene
One of the most popular Diels-Alder reaction is that of maleic anhydride and cyclopentadiene. However, as cyclopentadiene undergoes dimerisation readily, it cannot even be stored in a refrigerator for longer periods of time without considerable self-cycloadditon. The reaction to be presented in this section can be performed in a wet lab more conveniently, however for computational uses, the more atoms the system possesses, the higher the technical demand. In this case however, addition of an extra carbon should not cause a problem in terms of its computational cost.
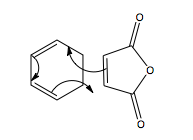
The reaction is a [4+2]-cycloaddition and proceeds as follows to yield the products: endo and exo adducts.
 |
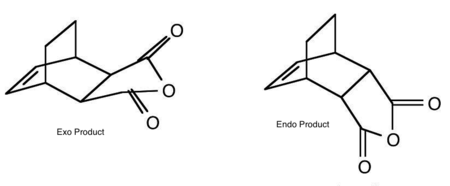 |
Molecular Orbital Analysis of Reactants
In the following study, all the molecules were optimised using DFT B3LYP/6-31G(d) for higher accuracy of results.
The activity started off with optimising geometries of maleic anhydride and cyclohexa-1,3-diene to obtain the lowest energy conformation. The fragments were then combined to form adducts leading to endo and exo transition states. Afterwards, the structures were TS Berny optimised.
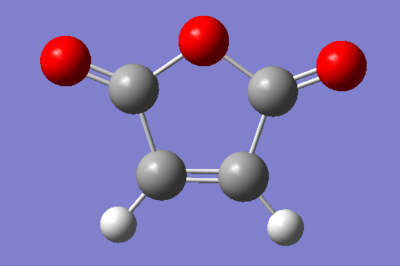
In Figure 83, optimisation process of maleic anhydride is presented. For a rotatable model of the molecule, click here.
 |
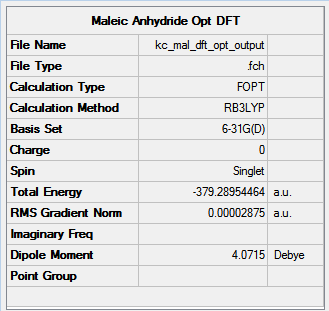 |
The optimisation was a success with the RMS gradient value of 0.00003.
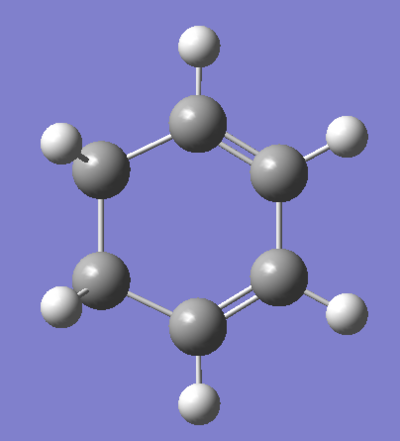
Cyclohexadiene was optimised using the same method. The results are shown in the Figure below. Click here to rotate the compound.
 |
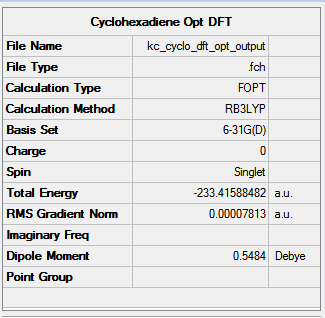 |
The RMS gradient hit 0.00007, a value small enough to consider the minimisation of energy as successful.
The reason why reactions happen lies in the molecular orbitals of reactants. Investigation of Gaussian generated orbital brings undergraduate chemists further in their analysis of reaction mechanisms and bits and pieces of theory which seemed like empty word can now actually make sense.
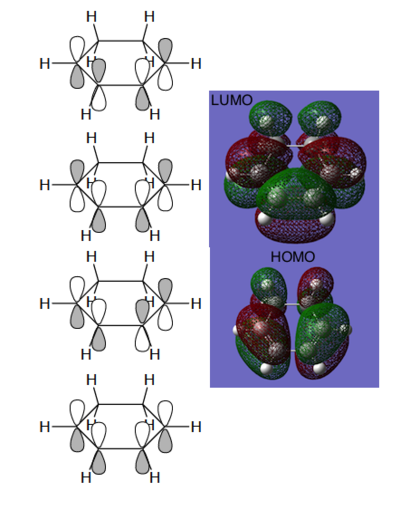
The HOMO and LUMO molecular orbitals of maleic anhydride, together with energy levels, are presented in Figure 85.
 |
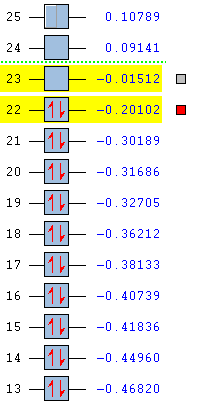 |
Since LCAO approach molecular orbitals of cyclohexadiene were found, it is now possible to relate the bonding and antibonding relationships in the computed MO to the overlap of the white and black lobes. Clearly, HOMO possesses 2 bonding interactions between C2-C3 and C4-C5 and an antibonding relationship between C3-C4. This orbital is therefore weakly bonding. The node in the middle is clearly observable in the Gaussian picture. Overall, the orbital is antisymmetric.
The LUMO orbital is on the other hand symmetric. Its nodes are situated between C2 and C3 as well as C4 and C5. These antibonding interactions make it more destabilised than HOMO by 138 kcal/mol - the HOMO-LUMO gap for cyclohexadiene. Lobes of the LCAO picture correspond very well with the computational visualisation.
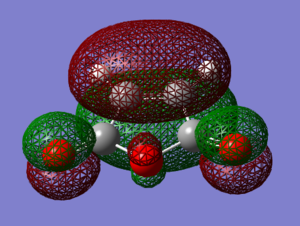
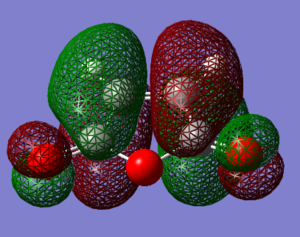
MO diagrams for maleic anhydride are presented in Figure 86.
 |
 |
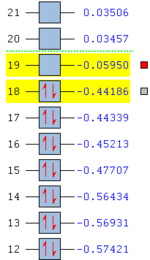 |
HOMO of maleic anhydride is a mainly bonding orbital due to the overlap of orbitals on the cyclopentene ring. It is a symmetric orbital with its energy level at -0.44 Hartree. One can also notice the p orbitals situated on the oxygen atoms.
LUMO of maleic anhydride is an antibonding orbital, destabilised by the presence of a node on the C=C bond. It is antisymmetric and it lies at -0.060 Hartree. The HOMO-LUMO gap is much larger than that for cyclohexadiene and equals about 275 kcal/mol.
The low-lying LUMO of maleic anhydride accepts electrons from the HOMO of electron-rich cyclohexadiene more readily than LUMO of the latter. The overlap is favourable - an antisymmetric orbital overlaps with an antisymmetric orbital. The reverse interaction is less favourable as it does not bring that much of a stabilisation and smaller splitting. The greater the splitting, the more stabilised the bonding orbitals.
Transition State Localisation
The search for a transition state was performed using the familiar TS Berny optimisation. Bearing in mind the regioselectivity, two TS structures - exo and endo - were guessed. The forming C-C bonds were predicted to be 2.1 Å.
Exo Transition State
The guessed structure for the TS leading to an exo adduct looks like the one in Figure 87.
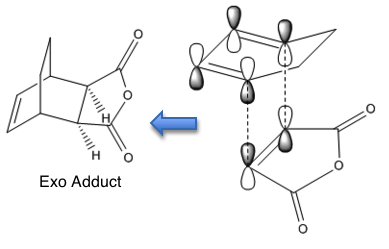
The results of TS Berny optimisation are available below.
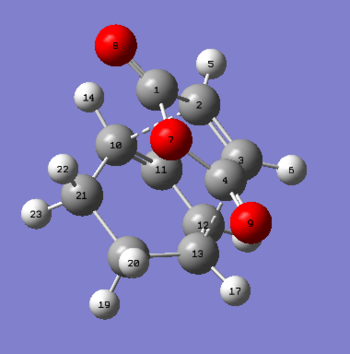 |
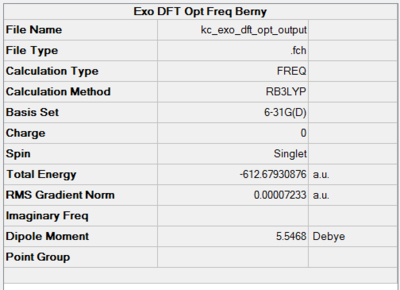 |
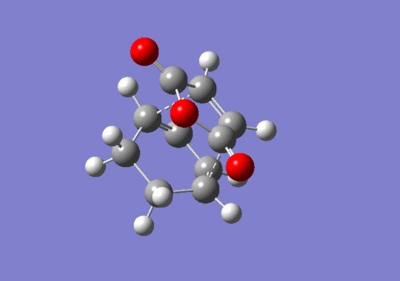
For a living exo TS, click here. The optimisation was a success as the RMS gradient dropped to as low as 0.00007. The ultimate proof for the formation of the TS is inspection of imaginary frequencies - only one is desired. Indeed, only one negative value was spotted at 449 cm-1. Its animation is shown in Figure 89. The motion corresponds to the bond breaking and making process in the adduct.
Endo Transition State
The predicted transition structure is presented in Figure 90.
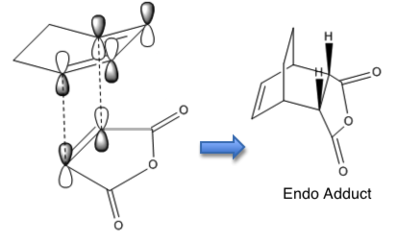
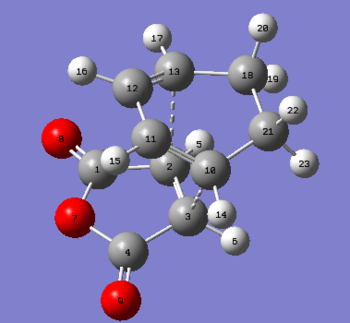
The results of TS Berny optimisation are shown below.
 |
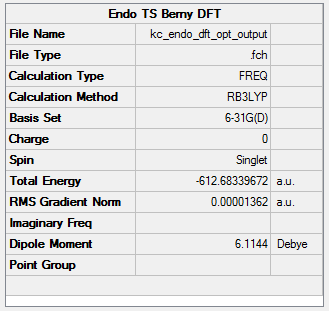 |
The RMS gradient, as low as 0.00001 is low enough to call the TS Berny optimisation a success. Another piece of evidence for this is the location of a single imaginary frequency at 447 cm-1, animated below. Click here to have a closer look at the endo adduct TS.
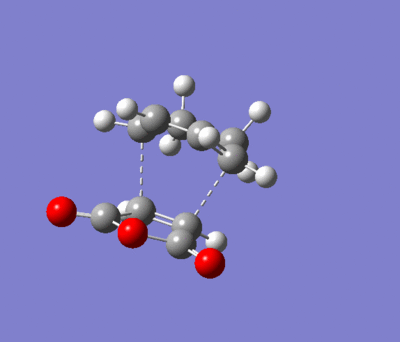
Comparison of Results
To account for the reaction selectivity and for which product is the kinetic product and which is the thermodynamic product, one must compare the geometries and energies of formation as well as activation energies. Table 11 summarises the important parameters later to be analysed.
| Geometry Parameter | Exo TS | Endo TS |
|---|---|---|
| C-C Interfragment Bond Length [Å] | 2.29 (C2-C10 & C2-C13) | 2.27 (C2-C13 & C3-C10) |
| C-C Bond Length [Å] | 1.48 (C1-C2 & C3-C4) | 1.48 (C1-C2 & C3-C4) |
| C=C Bond Length (Former C-C) [Å] | 1.40 (C11-C12) | 1.40 (C11-C12) |
| C-C Bond Length (Former C=C) [Å] | 1.40 (C2-C3, C10-C11 & C12-C13) | 1.40 (C2-C3, C10-C11 & C12-C13) |
| Through Space Distance (C=C)-(C-C) [Å] | 2.97 | 2.87 |
Exo and endo bond lengths are the same but for the interfragment C-C bond length. Even there, the difference is very small, only 0.02 Å. Changes in geometry are extremely important and indicative of a reaction taking place. The electrons do not rotate as shown in Figure 82 - in reality two π bonds disappear and two σ bonds take their place by the electrons moving smoothly out of the π orbitals into the σ orbitals. A double bond will therefore be formed in place of the central C-C diene bond and the double bond in maleic anhydride will be replaced by a single bond. The bond between C11 and C12 is 1.40 Å, only 0.05 Å from the typical C=C bond length, whereas the former diene and maleic anhydride double bonds are all 1.40 Å and quite significantly off from the literature C-C bond length. There large difference in length between the two joining molecules suggests formation of a transition state which is difficult to classify as being early or late. Most probably, energy analysis of reactants, products and TS would allow to draw a reaction profile and state in which channel, reactant or product, the TS occurs. The C-C through space distance between the -(C=O)-O-(C=O)- fragment and the C atoms of the opposite CH2-CH2 for the exo and the opposite -CH=CH- for the endo were also measured. In the exo adduct, they are 0.1 Å longer, hence experiencing less steric repulsion between the fragments. Both transition states experience steric hindrance as the van der Waals radius for C-C is 3.2 Å. At smaller distance, the interaction energy becomes repulsive as shown by the Lennard-Jones potential. This is consistent with Clayden's observation[4] that the exo product is more stable because it experiences less steric hindrance between the anhydride ring and the brigde.
The endo product is less stable that the exo product and yet it is preferred in irreversible DA reactions - it must be the kinetic product of the reaction. Do the generated energies support literature findings?
The endo transition state has slightly lower electronic energy than the exo TS, -612.683 Hartree compared to -612.679 Hartree, respectively, which corresponds to about 2.5 kcal/mol difference. A very important piece of information is provided by activation energies. One must compare the sum of the electronic and ZPE at 298.15 K for both reactants with the same quantity for exo and endo TS. The results are presented in Tables 12 and 13. All energy units are Hartrees.
| Energy | Cyclohexa-1,3-diene | Maleic Anhydride | Sum of Energies |
|---|---|---|---|
| Electronic Energy | -233.4189 | -379.2895 | -612.7044 |
| Sum of Electronic and ZPE at 298.15 K | -233.2909 | -379.2285 | -612.5194 |
| Energy | Exo TS | Endo TS |
|---|---|---|
| Electronic Energy | -612.6793 | -612.6834 |
| Sum of Electronic and ZPE at 298.15 K | -612.4980 | -612.5021 |
| Activation Energy | 0.0214 | 0.0173 |
It can be observed that activation energy leading to exo transition state is higher, meaning it requires 2.6 kcal/mol more reach the saddle point leading to exo adduct. What is the origin of these observations?
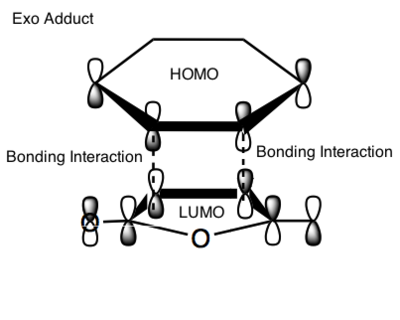
The simplest explanation comes from the frontier orbitals. The experimental observation is that the undergoing reaction gives the exo adduct although the endo adduct is thermodynamically more stable. The exo TS is stabilised by interaction of those parts of the frontier orbitals which are not directly taking part in forming new bonds. This is called the secondary orbital overlap, shown in Figure 93. It is referred to as SOO later in the text.
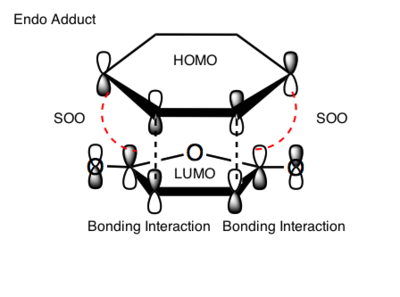
The black dashed lines represent the sites of the new bonds. The red dotted lines represent sites of further interactions which do not lead to bond formation but which lower the energy of the transition state relative to that of the exo transition state, where SOO is not possible.[23] This is investigated in Figure 94.
Another way to look at the endo rule is presented in Clayden[4]. It might seem funny but the simplistic concept makes it easy to understand. Entropy may also be useful in explaining the results. A very precise orientation of the reactants is necessary for two sigma bonds to be formed at once. These reactions have large negative entropies of activation because there is an increase in order when aligning the two fragments together to form the transition state. The through-space attractive HOMO/LUMO interaction between the molecules leads to an initial dissociation that can be compared to a squishy sandwich with too much mayonnaise. The two rings are like slices of bread and the electrons that are the filling that holds them together and allows them to rotate until the right atoms come together for bonding.
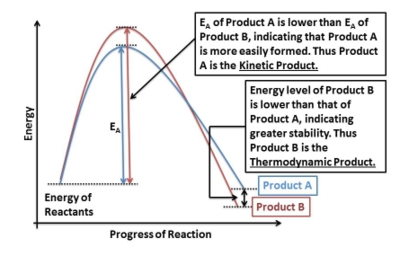
The exo adduct is the thermodynamic product of the reaction. Under thermodynamic control - high reaction temperatures, longer reaction periods - the system has enough energy and time to establish a dynamic equilibrium and shift to the side of the most stable product - the one with the lowest energy. At low temperatures however, transition states with the lowest activation barriers will be reached fastest and these products will dominate. It is easier to see it on the diagram provided below.
Molecular Analysis of Transition States
To complete the reaction analysis, one has to look at the generated MOs for exo and endo transition states. Immediately below in Figure 96 are the HOMO and LUMO orbitals for the exo transition state.
The HOMO orbital is antisymmetric, formed by the overlap of the antisymmetric HOMO orbitals of cyclohexadiene and LUMO of maleic anhydride. One can clearly see the bonding interaction between the two fragments. The HOMO orbital has the energy of -0.242 Hartree while the LUMO -0.0784 Hartree, making the HOMO-LUMO gap equal about 200 kcal/mol.
The HOMO-1 orbital is symmetric and is formed through the interaction of the diene LUMO and dienophile HOMO. Naturally, as predicted, there is no secondary orbital overlap between the fragments.
The LUMO orbital is antisymmetric and is localised mainly on the maleic anhydride ring as it has a low lying LUMO contributing the most to the antibonding orbitals.
The endo HOMO orbital is formed, like in the exo case, from the overlap of the diene HOMO and dienophile LUMO. It is located at -0.201 Hartree on the energy diagram, 132 kcal/mol apart from the LUMO orbital. It is an antisymmetric orbital.
The HOMO-1 orbital is formed by the interaction of the cyclohexadiene LUMO and maleic anhydride HOMO. The secondary orbital overlap is clearly distinguishable - the π bonding orbital of the diene double bond (red lobe) interacts with orbitals of the same wavefunction sign on the oxygen atoms (they are in phase). Since both TS were characterised using DFT, their energies can be compared directly. The molecular orbitals of endo are clearly more low-lying than those of the exo TS because of the SOO effect. The orbital is symmetric.
The LUMO orbital with its nodes in the central fragment is clearly a highly antibonding orbital with antisymmetric character.
To summarise, inspection of HOMO and LUMO shapes for both transition state as well as their energies has proved the endo rule - endo is the kinetic product of the reaction as it forms fastest because of its lower activation energy. The secondary orbital overlap is the determining factor. Although in terms of geometry it is less sterically hindered than endo, the exo transition state is the minor product of the reaction. Under thermodynamic control, the ratios are inverted and the exo adduct becomes the major product.
Extra Reaction: Dimerisation of Ketene
Ethylene does not dimerise readily upon heating. This fact is easily explained by Frontier Molecular Orbital theory (FMO) which requires that HOMO and LUMO of ethylene have opposite symmetries and do not produce an overlap during a face-to-face encounter. In other words, this sterically reasonable pathway is forbidden by orbital symmetry. This is illustrated in Figure 98.

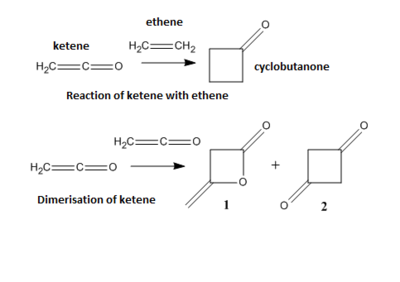
FMO suggests that cycloadditions involving pairs of alkenes will be rare because the frontier orbitals of most alkenes are similar to those of ethylene. An apparent exception to this rule is ketene, shown in Figure 99. It undergoes cycloadditions both with alkenes to form cyclobutanones and with itself to form an unsymmetrical dimer, 1.[11]
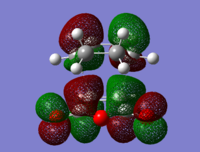
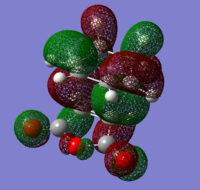
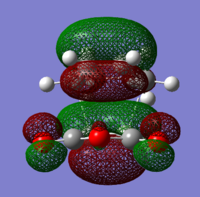
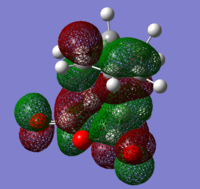
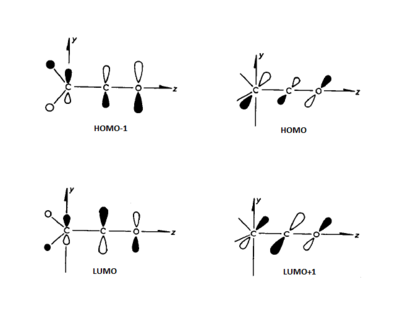
The reaction of ketenes with alkenes only appears to be forbidden but in fact ketenes possesses two sets of π orbitals at right angles to each other and are able to overlap with orthogonal orbitals. HOMO-1, HOMO, LUMO and LUMO+1 orbitals of ketene are displayed in Figure 100.
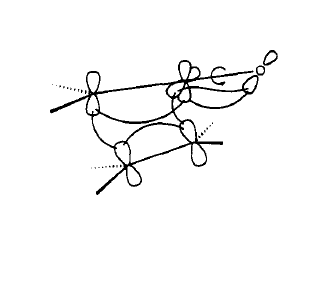
Since the mid-1950s it has been known that diketene, the sole product of dimerisation of ketene has the structure 1 rather than the more symmetrical 1,3-cyclobutanedione. This observation has been made despite the fact that diketene is nearly isoenergetic with 1,3-cyclobutanedione. It is also interesting to note that many substituted ketenes dimerise to form the cyclobutanedione-like structure, rather than the diketene-like one. The pathway proceeds through an unsymmetrical transition state in which all three π bonds are involved.[32] An example overlap of ketene and ethene orbitals is shown in Figure 101.
Molecular Orbital Analysis of Reactants
The study of dimerisation of ketene involved using HF/3-21G calculations to determine whether the observed formation of structure 1 is controlled by thermodynamic or kinetic factors. Structures of ethene and ketene were built and their geometries optimised. HOMO and LUMO orbitals of each molecule were also calculated. The results of the first part of the investigation are presented and labelled in Figures 102-105.
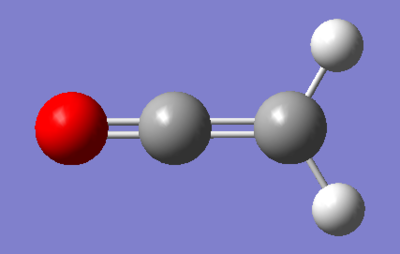 |
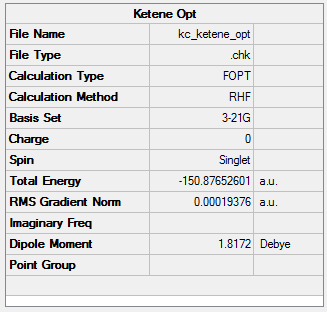 |
The computed HOMO and LUMO orbitals of ketene are shown below.
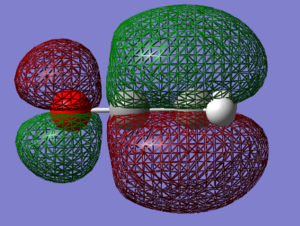 |
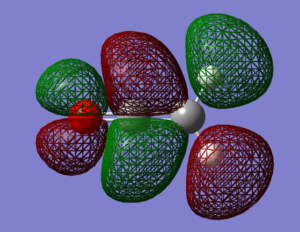 |
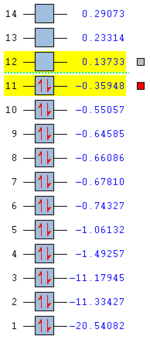 |
The optimisation to a minimum energy structure was a success as the RMS gradient reached a value of 0.0002, small enough to assume convergence to 0. The HOMO of ketene lies at -0.359 Hartree, while its LUMO at 0.13733. The HOMO-LUMO gap is calculated to be 312 kcal/mol. Both orbitals are antisymmetric and while HOMO is only weakly bonding, LUMO is very antibonding because of the increased number of nodes.
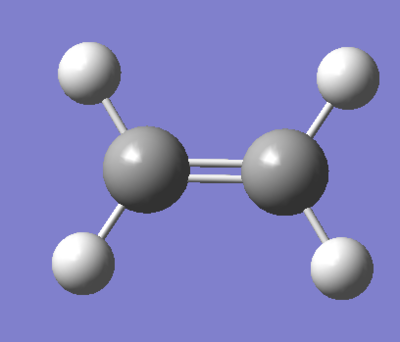
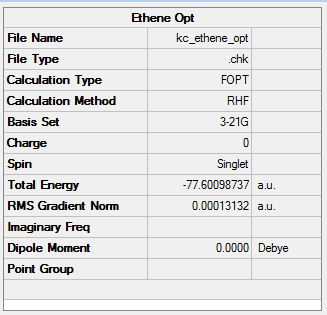
For comparison, the same study but with ethene molecule is presented below.
 |
 |
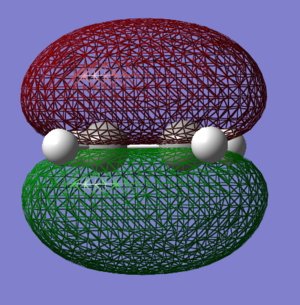
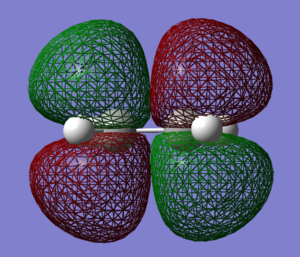
The computed HOMO and LUMO orbitals of ketene are shown below.
 |
 |
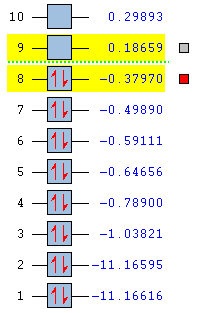 |
Just like in the case of ketene, this optimisation was also a success, yielding the RMS gradient of 0.00013. THE HOMO-LUMO gap in the ethene molecule is greater than for ketene and equals 355 kcal/mol. Ethene therefore possesses a higher-lying LUMO and a lower-lying HOMO than ketene. Molecular orbitals of ethene were discussed in the Diels-Alder reaction of butadiene and ethene.
It is interesting to note the dipole moments - a symmetrical ethene molecule possesses no net dipole (0 Debye), while the presence of an electronegative oxygen atom in a ketene molecule shift the dipole moment to 1.82 D.
Transition State Localisation
The dimerisation of ketene serves as an intriguing test of the Woodward-Hoffmann selection rules for 2 + 2 cycloaddition reactions. According to these selection rules, the 2S + 2S pathway, involving suprafacial attack on both reactants is thermally forbidden but these rules do allow for a 2S + 2A mode of attack, which involves suprafacial attack by one reactant and antarafacial attack by the other.[32] To clarify, reactions in which the new bonds are being formed on the same surface are described as being suprafacial (S) on that component. The opposite of suprafacial is antarafacial (A) in which attack takes place with one bond forming to one surface but the other bond forming to the other surface.[33]
In 1968 Huisgen and Otto proposed the transition state for the dimerisation of ketene to look like the one in Figure 106.
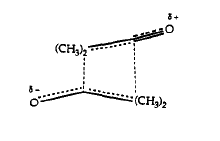
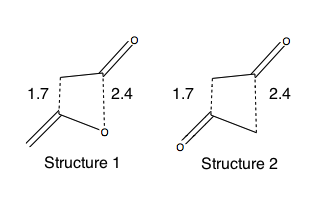
Transition States leading to structures 1 and 2 were found using the following algorithm:
- 1 and 2 were built and their structures optimised using HF/3-21G,
- the optimised structures served as input files for TS Berny optimisation,
- the bond lengths were modified as shown in Figure 107 - asynchronous transition states were produced to account for the best HOMO-LUMO overlap forming more rapidly and giving shorter bond lengths.
Thermodynamic Control
To find the thermodynamic product of the reaction, one has to compare the relative energies of 1 and 2 and locate the lowest energy structure as the most thermodynamically stable one. This means that at high temperatures and prolonged reaction times equilibrium will shift to the side of the lowest energy molecule.
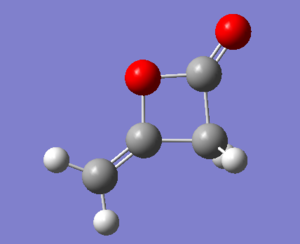
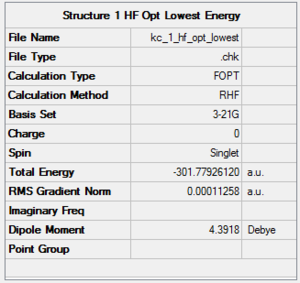
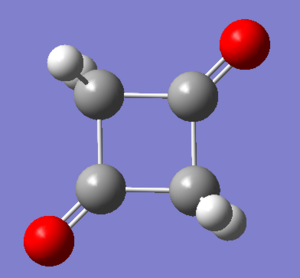
The results of minimum energy optimisations for 1 and 2 are shown in Figures 108 and 109. For rotatable structures, click here.
 |
 |
 |
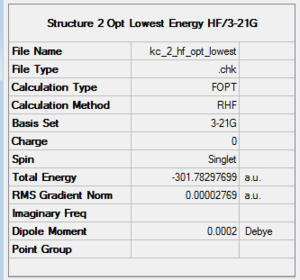 |
Structure 1 was optimised successfully, giving the RMS gradient value of 0.0001, however a better one was obtained for Structure 2, 0.00002.
After energy analysis, 2 is lower in energy than 1 by 2.33 kcal/mol and it is hence the thermodynamic product of the reaction. A possible reason for this could be the preference of formation of a stronger C=O double bond rather than a single C-O bond.
Kinetic Control
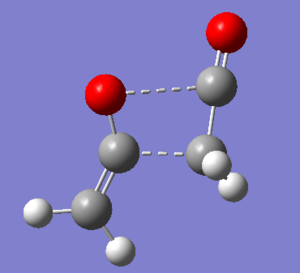
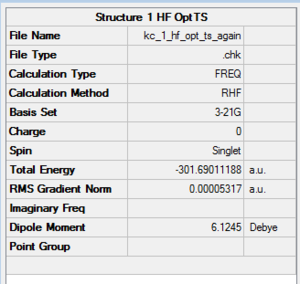
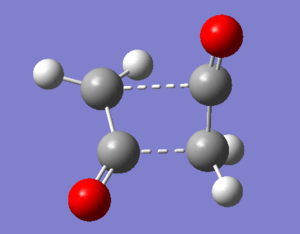
Structures presented in Figure 107 were built and optimised using TS Berny algorithm. The results are presented below. For rotatable structures click here.
 |
 |
 |
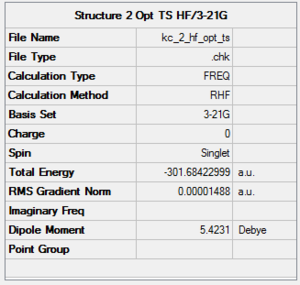 |
To verify that the two transition states were found, vibrational analysis has to be performed. One and only one imaginary frequency must be observed for the study to be considered successful.
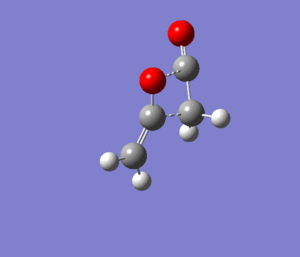 |
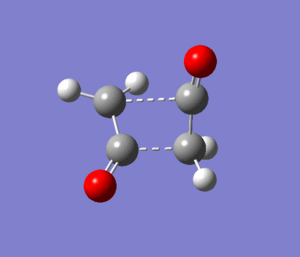 |
Transition state 1 is about 3.76 kcal/mol lower in energy than Transition State 2. The former is hence more easily accessible to the molecules as it requires them to follow a lower energy reaction pathway with a lower activation barrier. Under kinetic control (low temperatures, short reaction times) the reaction will follow the pathway connecting transition state 1 and product 1.
Conclusions
The investigation allows a chemist to investigate familiar "wet laboratory" reactions such as Diels-Alder or Cope Rearrangement from a completely different point of view. Advances of computational chemistry enable a chemist to predict, analyse and verify any values, hypotheses and difficulties in the reaction undertaken. Different conformations of complicated systems, intermediates not resolved by femtosecond spectroscopy and fleeting transition states can be easily studied using computational models. The availability of different methods like AM1 or DFT present a chemist with a choice of the best possible computational technique applicable to a specific system.
Let me summarise the entire computational laboratory with a famous quote by Dirac:
The underlying physical laws necessary for the whole mathematical theory of a large part of physics and the whole of chemistry are thus completely known and the difficulty is only that the exact application of these laws leads to equations much to complicated to be soluble. P.A.M. Dirac 1902-1984
Can his statement, made when quantum mechanics was still an underdeveloped theory, now only be half true nowadays?
References
- ↑ 1.0 1.1 Maskill, H.; The Investigation of Organic Reactions and Their Mechanisms, 2006, Blackwell Publishing Ltd.
- ↑ http://www.chem.wayne.edu/~hbs/chm6440/PES.html
- ↑ 3.0 3.1 Ramachandran, K. I.; Deepa, G.; Namboori, K; Computational Chemistry and Molecular Modelling, 2008, Springer.
- ↑ 4.0 4.1 4.2 4.3 4.4 Clayden, J.; Greeves, N.; Warren, S.; Wothers, P.; Organic Chemistry, 2011, Oxford University Press.
- ↑ 5.0 5.1 Young, D.; Computational Chemistry : A Practical Guide for Applying Techniques to Real World Problems, 2001, John Wiley & Sons.
- ↑ 6.0 6.1 6.2 6.3 Rocque, B. G.; Gonzales, J. M.; Schaefer, H. F.; Mol. Phys, 2002, 100, 441-446. DOI:10.1080/00268970110081412
- ↑ 7.0 7.1 Gung, B. W.; Zhu, Z.; Fouch, R.; J. Am. Chem. Soc., 1995, 117, 1783-1788. DOI:10.1021/ja00111a016
- ↑ Professor Henry Rzepa's Lecture Notes, 2nd Year Conformational Analysis, 2012, Imperial College London. http://www.ch.ic.ac.uk/local/organic/conf/
- ↑ Koch, W.; Holthausen, M. C.; A Chemist's Guide to Density Functional Theory, 2001, Wiley-VCH Verlag GmbH.
- ↑ Foresman, J. B.; Frisch, E.; Exploring Chemistry with Electronic Structure Methods, Gaussian, Inc., 2nd edition, 1996.
- ↑ 11.0 11.1 11.2 11.3 11.4 Hehre, W. J.; Shusterman, A. J.; Huang, W. W.; A Laboratory Book of Computational Chemistry, Wavefunction, Inc.; 1998.
- ↑ http://riodb01.ibase.aist.go.jp/sdbs/cgi-bin/direct_frame_top.cgi
- ↑ 13.0 13.1 13.2 Sakai, S.; Theochem-J. Mol. Struc., 2002, 582, 181-188. DOI:10.1016/S0166-1280(01)00810-7
- ↑ 14.0 14.1 Shea, K. J.; Stoddard, G. J.; England, W. P.; Haffner, C. D.; J. Am. Chem. Soc., 1992, 114, 2635-2643. DOI:10.1021/ja00033a042
- ↑ Physical Computational Laboratory Script, 2012, Imperial College London. https://wiki.ch.ic.ac.uk/wiki/index.php?title=Mod:phys3
- ↑ 16.0 16.1 Schultz, G.; Hargittai, I.; J. Mol. Struc., 1994, 346, 63-69. DOI:10.1016/0022-2860(94)09007-C
- ↑ 17.0 17.1 Foresman, J. B.; Frisch, E.; Exploring Chemistry with Electronic Structure Methods, Gaussian, Inc., 2nd edition, 1996.
- ↑ http://www.engineering-resource.com/Energy%20Changes.htm
- ↑ Seddon, J. M.; Gale, J. D; Thermodynamics and Statistical Mechanics, RSC, 2001.
- ↑ http://www.everyscience.com/Chemistry/Organic/Theory_of_Reactions/e.1068.php
- ↑ Morokuma, K.; Borden, W. T.; Hrovat, D. A.; J. Am. Chem. Soc., 1998, 110, 4474-4475.
- ↑ Baumann, H.; Voellinger-Borel, A.; Helv. Chim. Acta, 1997, 80, 2122-2123.
- ↑ 23.0 23.1 23.2 Fleming, I.; Frontier Orbitals and Organic Chemical Reactions, John Wiley & Sons, 1990.
- ↑ Da Silva Filho, L. C.; Lacerda, V. Jr; Constantino, M. G.; Da Silva, G. V.; Beil. J. Org. Chem., 14, 2005, 1-5. DOI:10.1186/1860-5397-1-14
- ↑ http://photonicswiki.org/index.php?title=File:Butadiene-pi-MOs-Spartan-3D-balls.png
- ↑ http://www.chem.ucalgary.ca/courses/351/Carey5th/Ch10/ch10-6-1.html
- ↑ Suarez, D.; Sordo, T. L.; Sordo, J. A.; J. Org. Chem., 60, 2848-2852.
- ↑ http://www.gaussian.com/g_tech/g_ur/k_irc.htm
- ↑ Goldstein, E.; Beno, B.; Houk, K. N.; J. Am. Chem. Soc., 1996, 118, 6036-6043. DOI:10.1021/ja9601494
- ↑ http://pharmaxchange.info/press/2011/03/thermodynamic-product-vs-kinetic-product-with-examples
- ↑ Fu, X.Y.; Decai, F.; Yanbo, D.; J. Mol. Struct.; 1988, 167, 349-358. DOI:10.1016/0166-1280(88)80238-0
- ↑ 32.0 32.1 Seidl, E. T.; Schaefer, H. F.; J. Am. Chem. Soc., 1991, 113, 5195-5200. DOI:10.1021/ja00014a008
- ↑ Fleming, I.; Pericyclic Reactions, Oxford Science Publications, 2002.

