Rep:Mod3:lebg
Computational Module 3: Transition States and Reactivity, by Thomas Chavas
The aim of this module is to get a feel for the different ways one can go about generating transition states in chemical reactions using the computational chemistry program Gaussian, and to try and relate the properties of the generated transition states with observed reactivity. To do so, we will focus on an example of a Cope rearrangement and two examples of a Diels-Alder reaction.
The methods we will be using to generate transition states differ to those used in previous modules, in that the latter are unable to account for changes in bonding, which is a major problem when studying transition states. Instead, the methods we will be using in this module solve numerically the Schrodinger equation, and we can thus evaluate the local variations in bonding during the course of the reactions studied.
The Cope Rearrangement
In this section, we will study the properties of the reactants and transition state involved in the Cope reaction, whose reaction scheme is shown below.
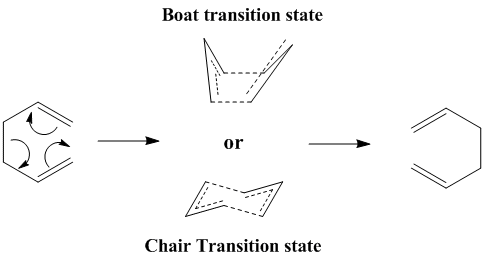
Using Hartree-Fock (HF) and Density Function Theory (DFT) calculations, we will try and predict the stability of the two possible transition states, and compare the calculated properties with experimental observations.
Optimising the Reactants and Products
Using Gaussview, a molecule of 1,5-hexadiene was first built with an "anti"-linkage for the four central carbon atoms (i.e. an approximately antiperiplanar conformation), and then optimised at the HF/3-21G level of theory. Shown below are 3D representations of the structure which was submitted for optimisation (left) and of the structure which was returned by Gaussian (right).
|
|
The energy of the optimised structure is found to be -231.69254 a.u., and the molecule belongs to the Ci symmetry point group.
Next, we build a second molecule of 1,5-hexadiene, but this time with a "gauche" linkage for the central four C atoms. As previously, we optimise the structure -using Gaussian- at the HF/3-21G level of theory. The 3D representations shown below are those of the input (left) and output (right) structures for this molecule.
|
|
We can expect this gauche conformation to be of higher energy than the antiperiplanar one that we generated earlier, since the bulky alkyl groups are further away from each other in the latter than in the former case. That is, there is less steric hindrance in the antiperiplanar conformation than in the gauche one. Surprisingly, we find that this conformer has an energy of -231.69266 a.u., which is lower than the energy of the antiperiplanar conformer shown previously. We must conclude that some favourable electronic interaction which is present in the gauche conformer (probably due to a more favourable orbital alignment) compensates the unfavourable steric interaction between the vinyl groups and stabilises the molecule. Note that this conformer belongs to the C1 symmetry point group.
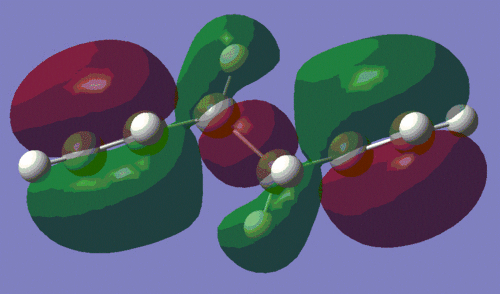
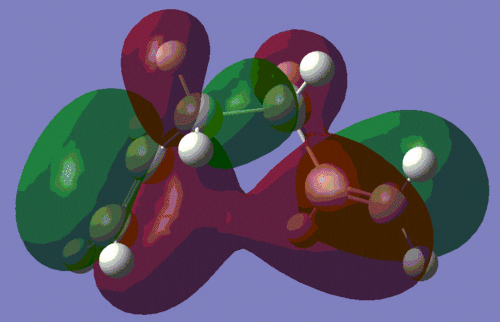
To investigate this interaction further, we shall have a look at the HOMO of both conformers, which are shown below. The picture on the left is the HOMO of the anti-conformer, and the one on the right is the HOMO of the gauche conformer, as computed during the AM1 optimisation.
|
|
This confirms our earlier intuition, that the gauche conformation must allow a more favourable orbital interaction. Indeed, we observe that the orbital alignment on the two alkene groups to interact constructively with each other, thus lowering the energy of the molecule. This interaction is in fact so stabilising for the molecule, that this conformer is lowest energy one of all those listed in the course wiki.
Let us now re-optimise the Ci anti2 conformation of 1,5-hexadiene to the B3LYP/6-31G* level of theory, i.e. using a more accurate method. The 3D representation below shows the structure of the Ci conformer optimised to the B3LYP/6-31G* level of theory.
|
As can be seen from the structure above, there is -to the eye- no noticeable difference between the two structures optimised to different levels of theory. The bond lengths are very similar in both molecules, apart maybe for the double bonds which are longer by approximately 0.02 Å in the re-optimised structure (1.34 versus 1.32 Å). The two main differences that we observe between the properties of these two molecules are in the values of the C=C-C-C dihedral angles and in the calculated energy, as summarised in the table below.
| Level of theory | C=C-C-C dihedral angle / ° | Energy of the molecule /(a.u.) |
|---|---|---|
| HF/3-21G | 115 | -231.69254 |
| B3LYP/6-31G* | 119 | -234.61170 |
Hence, we observe that the energy of the molecule calculated at the B3LYP/6-31G* level of theory is nearly 3 a.u. lower than that calculated at the HF/3-21G level of theory. However, as a general rule, the energies of two molecules predicted by different levels of theory cannot be compared. It is however possible to compare the different structural properties of a molecule optimised with two different levels of theory.
Next, we carry out a frequency analysis of the optimised B3LYP/6-31G* structure. This essentially computes the curvature of the potential energy surface, and there are two potential outcomes to such an analysis: the absence of a negative vibrational frequency tells us that the stationary point found during the optimisation step is actually a minimum (i.e. the optimisation step returned the ground state structure), while the presence of negative frequencies tells us that the stationary point found during the optimisation step is a maximum (i.e. the optimisation step returned a transition state structure).
In this case, the vibrational analysis carried out by Gaussian shows that no negative frequencies have been computed, and hence we can infer that this optimised structure represents a minimum on the potential energy surface. Note that strictly speaking, the .log file of the vibrational analysis lists four negative frequencies under the title "low frequencies" (-19, -12 and -0.0006 cm-1), but these values are sufficiently small (in absolute value) to be due to numerical difficulties. The key data to take away from this vibrational analysis is presented in the table below.
| Sum of electronic and zero-point energies/(a.u.) | -234.4692 |
|---|---|
| Sum of electronic and thermal energies/(a.u.) | -234.4619 |
| Sum of electronic and thermal enthalpies/(a.u.) | -234.4609 |
| Sum of electronic and thermal free energies/(a.u.) | -234.5008 |
The reason why these energies are of importance to us is that they can be used for comparison with experimental values.
The first of these values is the potential energy of the molecule at 0 K, and takes into account the zero-point vibrational energy (that is, the vibrational energy of the molecule at absolute zero). The second value is the energy of the molecule at 298.15 K and 1 atm of pressure and includes translational, rotational and vibrational contributions at those conditions. The third value incorporates a correction to the energy which comes from the thermal energy of the surroundings. Finally, the last value includes an entropy term to the free energy.
Optimising the "chair" and "boat" transition structures
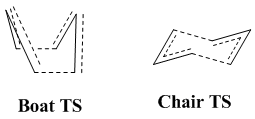
Since the transition state of this Cope rearrangement is somewhat akin to the cyclohexane molecule, it naturally arises that -just like cyclohexane itself- this transition state can adopt a "chair" and a "boat" confromation. Hence, the aim of this section will be to model the two different transition states and estimate the activation energies of the reaction for the two conformers. The two transition states are shown in the picture below.
 |
One can see that these transition states can actually be modelled by two allyl fragments, and thus one C3H5 allyl fragment was drawn out and its structure was optimised using the HF/3-21G level of theory. Shown below is a 3D representation of the optimised fragment.
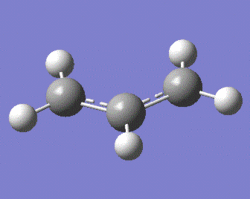 |
Note that the C-C bonds have a length of 1.39 Å, showing the delocalised nature of these bonds (indeed, a single bond has a length of 1.54 Å, while a double bond has a length of 1.34 Å, according to literature[1]).
This optimised fragment was duplicated twice, and the two fragments were set up so that their geometry mimicked that of the chair transition state, with a distance of approximately 2.2 Å between the terminal carbons of the allyl fragments, as shown below.
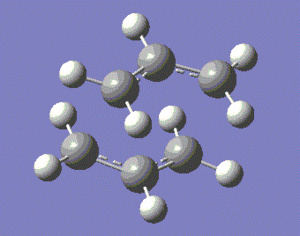 |
Obviously, the transition state modelled below is a mere guess of the actual structure of the transition state, and we need to optimise our guess to obtain a more accurate model of our transition state.
Since our structural guess for the transition state is a reasonable one, i.e. we are close to the saddle point on the potential energy surface, then the simplest way to optimise the structure is to calculate the Hessian matrix, which contains information about the curvature of the potential energy surface with respect to bond lengths. Thus, our initial guess structure was optimised to a transition state (Berny) with the HF/3-21G level of theory, and a vibrational analysis was also carried out.
The following structure was returned by Gaussian.
|
Note that the optimised distance between the terminal carbons of the allyl groups is of 2.02 Å for both termini. Moreover, the energy of the final structure is of -231.61932 a.u.. More importantly, we notice from the frequency analysis that there the returned vibrational analysis contains one imaginary frequency, whose absolute value is of -818 cm-1. The fact that the vibrational analysis has returned a negative frequency shows that this structure represents a saddle point on the potential energy surface. Indeed, the optimisation step confirmed that we are at a stationary point while the vibrational analysis, which computes the curvature of the surface, shows us that we are at a maximum (i.e. at a transition state) on that surface if negative frequencies are returned (conversely, if only positive frequencies are returned, then we know that we have a ground state structure). A snapshot of the TS vibrating at this frequency is shown on the structure below, and the displacement vectors are represented to help visualise the vibration.
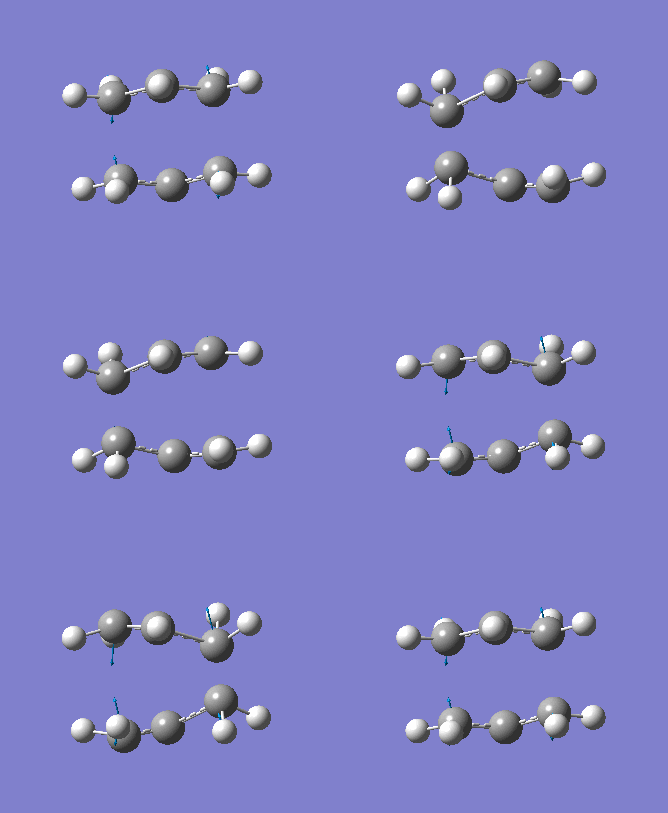
Hence, we can see that the bonds which are being broken/formed during the Cope rearrangement are the ones which are vibrating at this imaginary frequency, confirming that we have indeed generated a reasonable transition state structure. One should note that the bond formation/breaking process is an asynchronous one, contrary to the Diels-Alder reaction which we shall study in some detail in the next section.
We shall now optimise our initial guess for the transition state structure using the so-called frozen coordinate method. The latter can be useful when, for instance, computing the full Hessian matrix is time and/or resource consuming. This method involves "freezing" the reaction coordinate and optimising the rest of the molecule. Once the molecule is optimised, the reaction coordinate is "unfrozen" and the transition state optimisation is carried out, during which (hopefully!) sole differentiation along the reaction coordinate should generate a good enough guess for the Hessian.
First of all, the initial guess for our chair transition state was optimised, with the distance between the terminal allyl carbons "frozen" at 2.2 Å (this is achieved by adding the keywords "opt=modredundant"). The input command thus reads:
# opt=modredundant hf/3-21g geom=connectivity
A transition state optimisation and frequency analysis was then carried out on this structure, just as previously, except that this time the information about the force constants of the bonds we are differentiating along is contained in a guess Hessian, generated from the frozen coordinate optimisation step (in the previous method, the force constants were computed during the optimisation step). The input line now reads:
# opt=(ts,modredundant,noeigen) freq rhf/3-21g geom=connectivity
The optimised transition state also has a vibration of frequency -818 cm-1, indicating that we have indeed generated a transition state. Moreover, the distance between the terminal carbons of the allyl groups is of 2.02 Å for both termini and the energy of the molecule is of -231.61932 a.u.. These values are identical to those obtained using the first method. A snapshot of the vibration of imaginary frequency is shown below. As expected, this vibration, which is shown below, is exactly the same as the one obtained with the previous method.

Hence, we can see these two methods are equally reliable when it comes down to predicting the structure of this transition state, providing that the initial guess for the latter was a reasonable one.
Let us now optimise the structure of the boat transition state. We will do so using the QST2 method, which consists in specifying the reactant and product of the reaction and let Gaussian interpolate the two structures to find a transition state. In a Cope rearrangement, this implies that the reactant and the product must be numbered in exactly the same way. In this specific example, we will use the Ci conformer optimised to the HF/3-21G level of theory as both our reactant and product. The reactant and product were initially oriented as shown in the picture below, and an optimisation to TS (QST2) coupled to a vibrational analysis was carried out.

As can be seen in the 3D representation of the structure returned by Gaussian after this calculation, the calculation has failed. It looks like the program has simply translated the reactant over the product, without rotating either of the two molecules.
|
The resulting structure is actually quite akin to that of the chair transition state, except that in this case the reacting carbons are 3.12 Å apart, as opposed to the 2.02 Å observed in the transition state structure. Hence, it is fairly clear from this returned structure that the program is not going to find the boat transition state from the starting structures we plugged in. Consequently, we shall modify certain angles in the starting material to help the program "locate" the transition state. The C2-C3-C4-C5 dihedral angle (as labelled in the structures above) was reduced from 180° to 0°, and the C2-C3-C4 and C3-C4-C5 angles were reduced from 111° to 100° in both the reactant and product. This generated the structures shown below.

An optimisation to TS (QST2) coupled to a vibrational analysis was then carried out on this system, and shown below is the transition state that was returned by Gaussian, along with the single vibration characterised by an imaginary frequency(frequency of -841 cm-1).
|

|
The structure returned by Gaussian is in a perfect boat conformation and since we have a vibration with an imaginary frequency, we have confirmed the fact that we have a transition state structure.
Hence, we have managed to generate the chair and boat transition state structures for the Cope rearrangement of 1,5-hexadiene. Let us now analyse some of the properties of these two transition states.
The Intrinsic Reaction Coordinate Method
It is a very hard to task to try and infer the conformation of products by mere inspection of the structure of the transition states. For instance, it is impossible to tell from looking at our optimised chair and boat transition states which conformers of 1,5-hexadiene they will lead to.
To do such a prediction, we will use the so-called Intrinsic Reaction Coordinate (abbreviated IRC thereafter) method, which is supported by Gaussian. This method essentially follows the minimum energy path on the potential energy surface, until it finds the potential well which corresponds to the ground-state structure of the product.
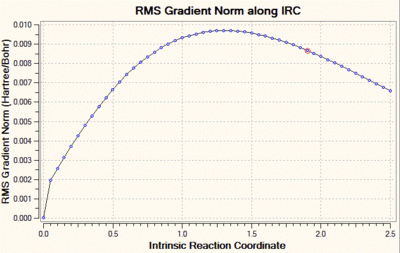
The chair transition state which had been optimised with the frozen coordinate method is used (but the transition state which was generated with the other method could also be used), and an IRC calculation is run with the following parameters: the reaction coordinate is only computed in the forward direction (since our reaction coordinate is symmetrical, we do not need to compute it in both directions), and the number of points along the reaction coordinate is set to 50. The .chk file reports however that a minimum geometry hasn't been reached yet, as shown in the graphs below.
 |
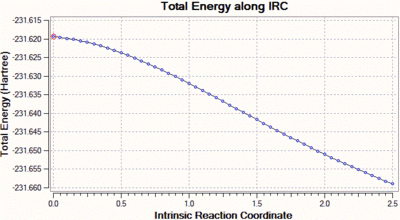
We can clearly see that the total energy has not reached a minimum, and that the RMS gradient has not converged to zero. Hence, the same calculation was carried out but this time with a decreased step size, of value 5 (the default step size is of 30). Decreasing the step size in this case is a reasonable solution, because when the gradient of the PES is too steep, Gaussian can sometimes fail to re-optimise the normal modes after displacement of the bonds which vibrate in the imaginary mode. The step size is set to five by adding "irc=stepsize=5" to the additional keywords. The total energy and RMS gradient as a function of the IRC are shown below, along with the structure of the molecule at the initial (left) and final (right) step of the process.
 |
 |
|
|
In this case, we can see that the total energy is getting lower and lower as we go along the IRC, but that the number of steps set at the beginning of the calculation is not large enough for the system to reach the minimum. Hence, we start this calculation again, but this time increase the number of steps to 100, keeping the step size to 5. Shown below are the usual graphs, along with the structure of the system at the initial (left) and final (right) steps of the process.
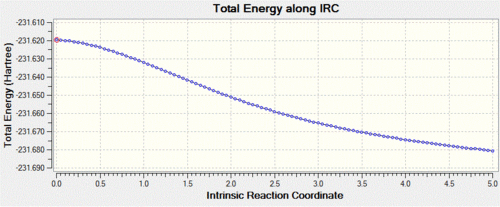 |
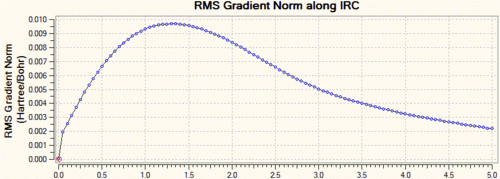 |
|
|
Again, one can see that the system has not quite reached a minimum and hence one could again increase the number of steps up to say, 150. However, this process is time and resource-consuming, and we can see from the graphs that the RMS gradient has nearly reached 0 and that the total energy is close to a minimum. This is confirmed by the structure of the system at the last step of the process, where we can see that a carbon-carbon bond has already formed and that the structure of the molecule looks very much like the gauche2 conformer that we generated in the first section. Hence, a simpler way of reaching the final product is to simply optimise the last point on the IRC to a minimum. This is what was carried out, and we show below the structure generated from this optimisation, as well as the summary window as presented in Gaussview.
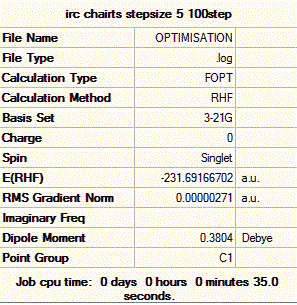 |
|
Thus, we can see that the structure obtained is a gauche conformer and that it has an energy of -231.69167 a.u., which is the energy of the gauche2 conformer in appendix 1 of the course wiki. A closer look at the structure generated reveals that it also has C2 symmetry, and that it is structurally identical to the gauche2 conformer in appendix 1 of the course wiki, as expected. The one noticeable difference between the conformer generated by the IRC method and the one we optimised earlier, is that the C=C-C-C dihedral angle in the former are of 117° and 121° but of 124° in the latter. This is not a major difference however, and the two conformers can be assumed to be identical. Hence, the IRC method coupled to an optimisation has shown that the chair transition state leads to the gauche2 conformer of 1,5-hexadiene.
Comparing the activation energies associated with the two conformers
The last thing we shall do in this tutorial is to calculate the activation energy for the Cope rearrangement for the two transition structures. Comparing the activation energies for the two transition states will hopefully reveal some interesting information about the kinetics of this reaction. We will then compare the predicted outcome with results reported in literature.
The first step consists of an optimisation of the two transition structures to the HF/3-21G level of theory. A more refined optimisation and vibrational analysis, to the B3LYP/6-31G* level of theory, are then carried out. The two structures generated from this process are shown below.
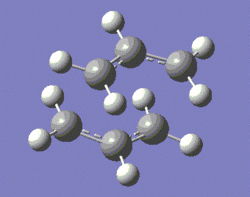 |
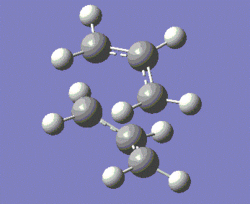 |
Note that to this level of theory, the imaginary frequency corresponding to the Cope rearrangement is of cm-1 for the chair TS and of cm-1 for the boat TS, confirming that we have a transition state structure. It should also be mentioned that the magnitude of these frequencies cannot be compared with that of the chair TS whose vibrational analysis was done to the HF/3-21G level of theory, purely because results obtained using different methods and basis sets are not comparable.
The energies returned by Gaussian after vibrational analysis of the two transition states are compared with the anti2 conformer of 1,5-hexadiene, as shown in the table below. The reason why we compare the energy of our transition state structures to that of this particular conformer is that it is the lowest energy state of the starting material and hence, statistically, the largest proportion of 1,5-hexadiene molecules will be in that conformation when the reaction occurs. Moreover, since the anti2 conformer is the lowest energy one, we can infer that the activation energy for this conformer will be the largest of all, and hence we know that any 1,5-hexadiene molecule undergoing this Cope rearrangement will at least require the amount of energy reported in the discussion below to overcome the activation energy barrier.
| Molecule | Sum of electronic and zero-point energies/(a.u.) | Sum of electronic and thermal energies/(a.u.) | Sum of electronic and thermal enthalpies/(a.u.) | Sum of electronic and thermal free energies/(a.u.) |
|---|---|---|---|---|
| anti2 conformer | -234.4692 | -234.4619 | -234.4609 | -234.5008 |
| Chair transition state | -234.4149 | -234.4090 | -234.4081 | -234.4438 |
| Boat transition state | -234.4023 | -234.3960 | -231.3951 | -231.4317 |
We notice that all the energy terms relating to the boat transition state are higher than their corresponding values for the chair transition state, suggesting that the latter is more stable than the former. This would mean that the activation energy for a reaction going via the chair transition state is lower than that for one going via the boat transition state. Since all of the data has been collected from structures that were optimised using the same method and basis set, we can now calculate the activation energies for the Cope rearrangement. Note that the "sum of electronic and zero-point energies" and "sum of electronic and thermal energies" are the most important terms, since we can compare the former value to an experimental one and since the latter value is the energy of the system at 298.15 K and 1 atm of pressure, i.e. more standard conditions for a laboratory.
Now that we have gathered all the data of interest from structures optimised to the same level of theory, let us calculate the activation energies for the reaction when it goes via either of the transition states. The results are summarised in the table below.
| EA(chair transition state)/(kcal/mol) | EA(boat transition state)/(kcal/mol) | |
|---|---|---|
| Predicted at 298.15 K and 1 atm of pressure | 33.20 | 41.35 |
| Predicted at 0 K | 34.07 | 41.98 |
| Experimental at 0 K | 33.5 ± 0.5 | 44.7 ± 2.0 |
Note: the values were converted from atomic units (i.e. hartrees) to kcal/mol, using the following relationship: 1 hartree = 627.509 kcal/mol.
The activation energy at 0 K was obtained by subtracting the sum of the electronic and zero-point energies of the reactant from that of the transition state concerned. On the other hand, the activation energy at 298.15 K and 1 atm of pressure was obtained by subtracting the sum of electronic and thermal energies of the reactant from that of the transition state concerned.
To begin with, we can see that, as expected, the activation energy at 298.15 K is lower than that at 0 K. This can be rationalised if we remind ourselves that thermal energy allows states of higher energy than the ground state to be populated. Since, by definition, activation energies are reduced when the energy of the starting material is increased, we can infer that a higher temperature will lead to a decreased activation energy.
We also notice that the activation energy is more than 8 kcal/mol larger when the reaction goes via the boat transition state than when it goes via the chair transition state. This means that going via a chair transition state is a considerably lower energy path for a molecule undergoing a Cope rearrangement, and hence we can deduce that this will be the kinetically favoured pathway. The IRC method, as we have seen previously, predicts that a chair transition state leads to the formation of the gauche2 conformer of 1,5-hexadiene. We would need to run the same IRC calculations on the boat transition state to be able to determine which conformer is formed preferentially from such a transition state. Comparison of the energy of the gauche2 conformer with that of the conformer formed from a boat transition state would then allow us to determine which of the two products is more stable, and hence which of the two reaction pathways is thermodynamically favoured. Unfortunately, there isn't enough time to do so.
Another thing to note is that the calculated activation energies are actually quite close to the experimental values, the percentage difference for the chair transition state activation energy being of 2 %, while the percentage difference for the boat transition state is of 6 %. This shows that these calculations are actually quite accurate given the rather low level of theory used.
Finally, we should not be surprised that the boat transition state is of higher energy than the chair transition state, since we can see from the 3D structures that the hydrogens are eclipsed in the former but not in the latter, which raises the steric hindrance and consequently the energy of the boat structure. This effect is actually observed in cyclohexane (whose structure is related to the transition state for this Cope rearrangement), for which we know that the chair conformation is more stable than the twist-boat counterpart.
Links to the output files
For the anti-Ci conformer:
Optimisation to HF/3-21G level .log file
Optimisation to B3LYP/6-31G* level .log file
Vibrational analysis to B3LYP/6-31G* level .log file
For the gauche conformer:
Optimisation to HF/3-21G level .log file
For the optimised allyl fragment:
Optimisation to HF/3-21G level .log file
For the chair transition state:
Optimisation to HF/3-21G level .log file
Optimisation using the freeze coordinate method .log file
For the boat transition state:
Optimisation using the QST2 method .log file
Diels-Alder Reaction of cis-butadiene and Ethylene
In this section, we are aiming to study the Diels-Alder between those two reagents, following the same methodology as for the Cope rearrangement studied in the previous section. In this case, however, we will be using the AM1 semi-empirical method instead of the HF/3-21G and B3LYP/6-31G used in the previous section. Moreover, we shall have a look at the properties of the frontier orbitals of the reactants and transition state in order to investigate the reaction. Shown below is a scheme of this reaction, for future reference.

Optimisation of the reactants
Ethylene and cis-butadiene were both optimised to a minimum using the AM1 semi-empirical method. A frequency analysis of the two reactants was subsequently carried out to ensure that no vibrations had an imaginary frequency, i.e. to make sure that the stationary point found was actually a minimum on the potential energy surface.
For ethylene, the smallest frequency listed as a "low frequency" on the .log file was of -11 cm-1, which has a magnitude small enough for us to infer that the structure corresponds to a minimum on the energy surface (the reason why this low frequency is not strictly positive is due to numerical difficulties). Initially, a planar structure of cis-butadiene was submitted for optimisation, but the vibrational analysis returned had an imaginary frequency at -26 cm-1, which is too high a magnitude for the negative value to be due to numerical difficulties. Consequently, the dihedral angle of the four carbon atoms was twitched to 14°, and the smallest frequency listed as "low frequency" was of -8 cm-1, confirming that we have reached a ground state structure.
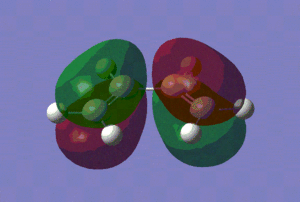
Now that we have confirmed that we have fully optimised structures, let us analyse the HOMO and LUMO of our reactants, which are shown in the table below.
| Ethylene | Cis-butadiene | |
|---|---|---|
| HOMO | 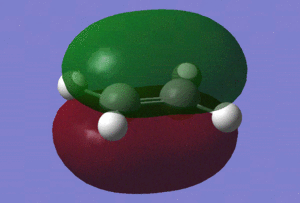
|
|
| Energy of the HOMO/(a.u.) | -0.38776 | -0.34455 |
| LUMO | 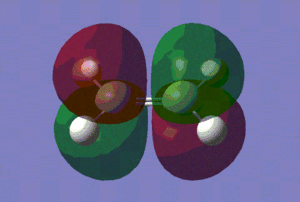
|

|
| Energy of the LUMO/(a.u.) | -0.05284 | -0.01796 |
Those pictures in the table above show clearly the symmetry of the orbitals involved. Hence, we can see that the HOMO of ethylene and the LUMO of cis-butadiene are symmetric with respect to reflection in the plane which is perpendicular to the central bond of either reactants. On the other hand, the HOMO of cis-butadiene and the LUMO of ethylene are anti-symmetric with respect to reflection in that same plane.
Hence, we can predict -from symmetry arguments- that constructive overlap is possible between the HOMO of ethylene and the LUMO of cis-butadiene and conversely between the HOMO of cis-butadiene and the LUMO of ethylene.
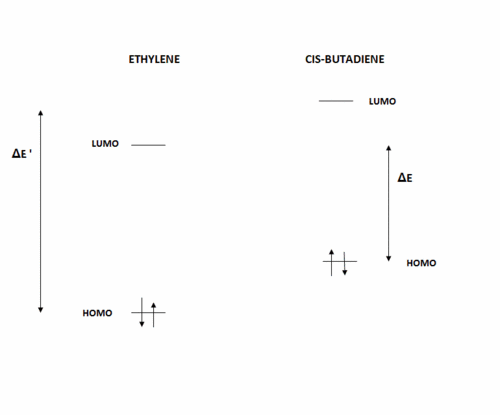
Note that the energy of the respective orbitals has been included in the table above. We know from the Klopman-Salem equation that the stabilisation energy resulting from the interaction between two orbitals is inversely proportional to the difference in energy between the two interacting orbitals. Hence, according to the diagram shown below (not to scale), and bearing in mind that from symmetry arguments, the interaction in a Diels-Alder reaction is between the HOMO of one reactant and the LUMO of the other, we can infer that the more stabilising interaction will be between the HOMO of ethylene and the LUMO of cis-butadiene, since ΔE = 0.27171 a.u. << ΔE' = 0.36980 a.u..
Let us now study the transition state structure and its MOs, which will hopefully allow us to confirm this suggestion.
Study of the transition state
The transition state structure was initially set up by copying and pasting the optimised ethylene and cis-butadiene fragments in the same window, and then orienting them to maximise orbital overlap, from the considerations of the previous section. The distance between the two fragments had to be guessed, and was set to be of 2.0 Å between the two termini.
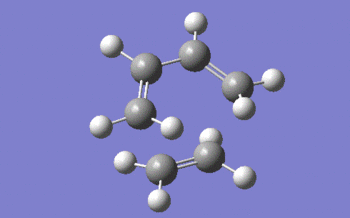
An optimisation to transition state (berny) and frequency analysis were then carried out, coupled to the semi-empirical AM1 method. The keywords "opt=noeigen" were also added to the optional keywords box, to avoid the calculation crashing if more than one imaginary frequency was to be detected. Shown below is a 3D representation of the transition state structure returned by Gaussian, and a snapshot of the movement of the atoms in the single negative frequency vibration, which occurs at -956 cm-1.
 |

|
First, we should mention that the bond length of the two single bonds which are about to form is of 2.12 Å, which is significantly longer than a normal carbon-carbon single bond (lit.[1] value of 1.53 Å). We notice that the distance separating the carbon atoms between which a sigma bond is about to form is very inferior to twice the Van der Waals radius of carbon (the Van der Waals radius of carbon is equal to 1.70 Å[2]), which indicates that there is an attractive interaction between the two atoms and that a bond is starting to form between the them.
On the other hand, the central bond in the butadiene fragment has a length of 1.40 Å, which is shorter than a carbon-carbon single bond, but longer than a double one (lit.[1] value of 1.34 Å) which is in agreement with the double bond present in the final product. Finally, those double bonds which are about to turn into single ones (according to the structure of the final product) also have length (1.38 Å) that is comprised between that of a single and a double carbon-carbon bond.
Let us now study the movement of the atoms during the vibration of imaginary frequency. The three motions listed next and represented above all occur at the same time: the two atoms which are about to bond are getting closer to each other; the atoms which are doubly-bonded and about to become singly-bonded move away from each other; the two atoms which are singly bonded but about to become doubly-bonded are getting closer to each other. This first motion tells us that the formation of the two carbon-carbon bonds is synchronous (which is the opposite of what happens in the lowest positive frequency vibration, where motion is asynchronous), and that the reaction is concerted. Note that all these motions are in agreement with the nature of the bonds in the product of this reaction.
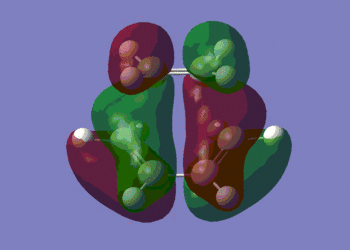
Let us now have a look at the HOMO and LUMO of the transition state.
HOMO |
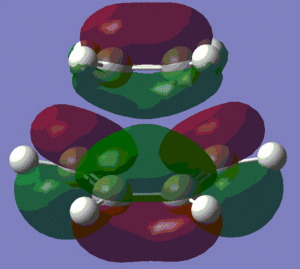
LUMO |
We can see that the HOMO of the transition state is symmetric with respect to the plane perpendicular to the molecule, and that the LUMO is anti-symmetric with respect to that same plane.
Moreover, we clearly observe that the HOMO of the transition structure is made up from the HOMO of cis-butadiene and the LUMO of ethylene, as predicted in the previous section, where we compared the energies of the HOMOs and LUMOs. This is the reason why Diels-Alder reactions are favoured by electron-rich dienes (which have a higher energy HOMO) and electron-poor dienophiles (which have a lower energy LUMO). The LUMO of the transition state, on the other hand, is made up of the HOMO of ethylene and the LUMO of cis-butadiene.
Finally, we can now say that this reaction is "allowed", since it involves an interaction between the HOMO of one reactant and the LUMO of the other.
Links to the output files
For the ethylene molecule:
Optimisation using the AM1 method .log file
Frequency analysis using the AM1 method .log file
For the butadiene molecule:
Optimisation and frequency analysis using the AM1 method .log file
For the transition state:
Optimisation and frequency analysis using the AM1 method .log file
Unfortunately the .chk files were too large to be uploaded on the wiki.
Study of the Diels-Alder Reaction between Cyclohexa-1,3-diene and Maleic Anhydride
Cyclohexa-1,3-diene (referred to as cyclohexadiene thereafter) undergoes a kinetically-controlled Diels-Alder reaction with maleic anhydride to form preferentially the endo-product, as shown in the scheme below. As we have seen in the previous section, Diels-Alder reactions are favoured by electron-poor dienophiles and electron-rich dienes. In this case, we can see that the three oxygen atoms on maleic anhydride decrease significantly the electron density around the double bond, and this is why this reaction is facile.

Moreover, the fact that this reaction is kinetically controlled means that the transition state leading to the favoured product must be more stable than the transition state leading to the other product.
In this section, we shall study the reactants and transition states of this reaction, again using the semi-empirical AM1 method, in order to rationalise the selectivity observed.
Optimisation of the Reactants
Maleic anhydride and cyclohexadiene were both drawn out in Gaussview, their structure was optimised and a vibrational analysis was carried out using the AM1 semi-empirical method. The output files returned showed that both structures had optimised successfully, and that the vibrational analysis did not return any imaginary frequencies for either of the compounds. Indeed, the smallest frequency listed as a "low frequency" was of -8 cm-1 for maleic anhydride and of -6 cm-1 for cyclohexadiene. Since these frequencies are very small in absolute value, we can assume that they are only negative due to numerical difficulties, and so we have confirmed that the two optimised structures shown below are ground state structures.
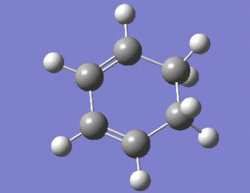 |
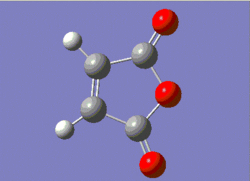 |
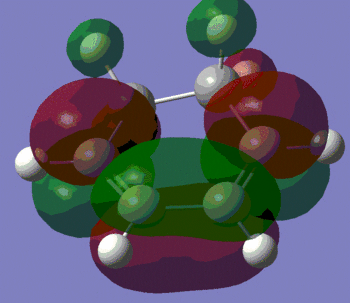
Let us now have a look at the HOMO and LUMO of the two reactants, which are shown in the picture below.
| Maleic anhydride | Cyclopentadiene | |
|---|---|---|
| HOMO | 
|
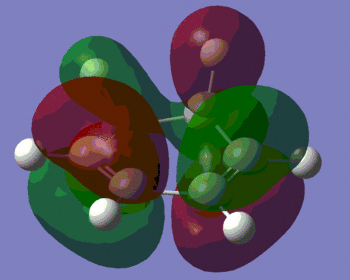
|
| Energy of the HOMO/(a.u.) | -0.44185 | -0.32193 |
| LUMO | 
|
|
| Energy of the LUMO/(a.u.) | -0.05949 | 0.01680 |
Again, we can see that the HOMO of maleic anhydride and the LUMO of cyclohexadiene are symmetric (with respect to the plane we were discussing in the previous section) and that the HOMO of cyclohexadiene and the LUMO of maleic anhydride are antisymmetric with respect to that same plane. Hence, we can deduce -as expected since it is just another Diels Alder reaction- that this reaction is "allowed".
Moreover, we observe once more that the energy difference between the HOMO of the diene and the LUMO of the dienophile is nearly twice as small than the energy difference between the HOMO of the dienophile and the LUMO of the diene (0.26244 a.u. versus 0.45865 a.u.). Hence, according to the Klopman-Salem equation, we know that the stabilisation energy resulting from the interaction between the first combination of orbitals will also be nearly twice as large as that resulting from the interaction between the second combination of orbitals.
As we shall see in the next section, it is indeed the the HOMO of cyclohexadiene that is putting electron density in the LUMO of maleic anhydride to form the HOMO of the transition state.
Study of the endo- and exo-Transition States
From the observed products of this reaction, we can infer that there are two possible transition states (one for each product). As we have mentioned previously, this reaction is under kinetic control, which means that the product which has a lower energy transition state will be favoured. In this case, the endo-product is favoured and thus we can infer that the endo-transition state will be of lower energy than its exo-counterpart.
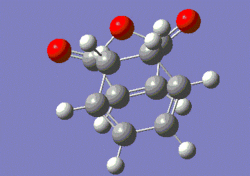
In order to generate the two transition states, our two fully optimised reactants were copied and pasted into the same window, and oriented such that the reacting carbons were approximately 2 Å apart (as previously). A combined optimisation to transition state (berny) and frequency analysis was then carried out, still using the AM1 level of theory. The force constants were calculated once, and the words "opt=noeigen" were added to the additional keywords box, to prevent the program from crashing, should Gaussian find more than one imaginary frequency during the course of the calculation. It was quite straightforward to obtain the exo-transition state, and shown below are the input (left) and output (right) structures for this transition state.
 |
 |
Note that this exo-transition state has an energy of -0.05050 a.u., or -31.69 kcal/mol, and that the distance between the reacting carbon atoms is now of 2.17 Å, which compares rather well to the 2.12 Å separating the reacting carbon atoms in the previous Diels-Alder reaction studied. The transition structure has one vibration of imaginary frequency -811 cm-1, which confirms that we have indeed a transition state structure. A animation of this vibration is shown below.
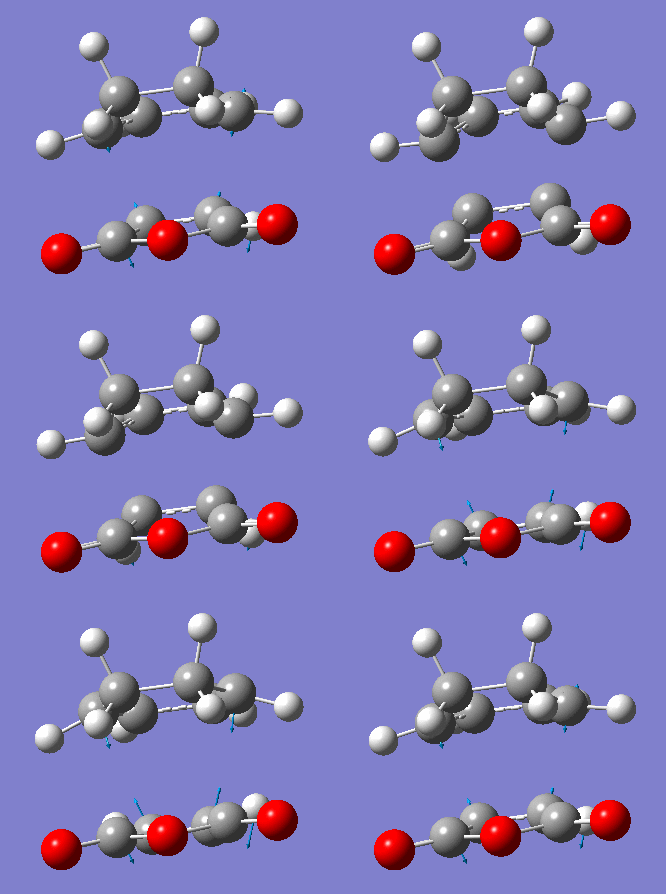
Again, we observe that the bond forming process is synchronous, as in the previous Diels-Alder reaction studied. We can also see that the distance separating the atoms between which a single bond is about to form is shortening during the course of the vibration, and that the distance between the atoms which are doubly-bonded in the starting material but singly-bonded in the product is lengthening. Conversely, the distance between atoms which are singly-bonded in the starting material but doubly-bonded in the product is shortening.
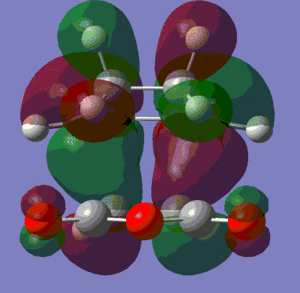
Let us now have a look at the HOMO and LUMO of this transition state, and see if they confirm our earlier predictions.
HOMO |

LUMO |
We can see fairly clearly that it is the HOMO of cyclohexadiene and the LUMO of maleic anhydride which are interacting constructively to form the HOMO of this transition state. The LUMO of this transition state is also the result of an interaction of these same orbitals, but this time they interact destructively. We can see that these two orbitals are both anti-symmetric (with respect to that same plane), and this agrees with the fact that they are the result of the interaction of two anti-symmetric orbitals.
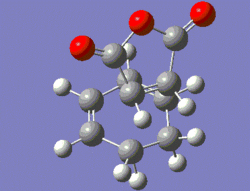
Finding the endo-transition state structure was also fairly straightforward, although this time the orientation of the hydrogens on the cyclohexadiene fragment had to be modified slightly so they weren't in too close proximity of the reacting carbons of the maleic anhydride fragment. Shown below are the input (left) and output (right) structures for the exo-transition state.
 |
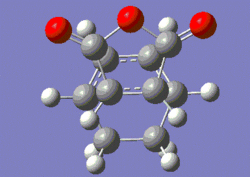 |
Note that in the input structure, two reacting carbons are separated by a distance of 2 Å (as previously), but the two other are closer to each other, as they are 1.75 Å apart. This still led Gaussian to returning the right transition state structure, which has one vibration for which the frequency is imaginary. The value of that frequency is -806 cm-1, and an animation of that vibration is shown below. It should be mentioned that in the optimised transition state structure, the reacting carbons are all 2.16 Å apart, which compares very well to the distances between reacting carbons we found in transition state structures for other Diels-Alder reactions. Furthermore, the energy of this transition state is found to be of -0.05159 a.u., or -32.38 kcal/mol.
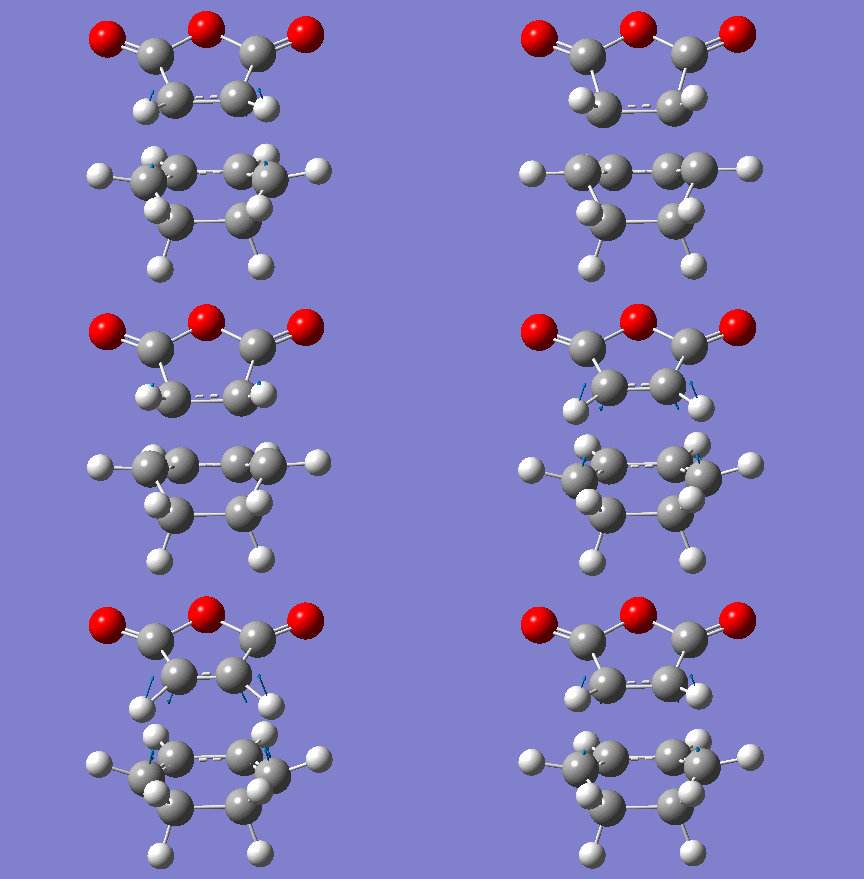
Again, we observe that the bond forming process is synchronous, as in the previous Diels-Alder reactions studied. We can also see that the distance separating the atoms between which a single bond is about to form is shortening during the course of the vibration, and that the distance between the atoms which are doubly-bonded in the starting material but singly-bonded in the product is lengthening. Conversely, the distance between atoms which are singly-bonded in the starting material but doubly-bonded in the product is shortening.
Now that we have reported the key information about these two transition states, let us now compare and contrast their features.
Comparative Study of the two Transition States
To begin with, we observe that the energy of the endo-transition state is lower than that of the exo-counterpart by 0.69 kcal/mol (or 2.9 kJ/mol), which explains the fact that the endo-product is favoured, since the reaction is under kinetic control.
If we assume that the temperature-dependence of the kinetics of this reaction follow the Arrhenius equation, then we can write the following:

Where kendo is the rate of formation of the endo-product and kexo is the rate of formation of the exo-product. Note that we are using the gas constant instead of Boltzmann's constant, and this is because our energy is in kJ/mol and not in kJ> We should also mention that we make the assumption that the collision factor is the same for the two products.
Plugging some numbers in this equation shows us that at 298 K, the rate of formation of the endo-product is approximately 3.2 times that of the exo-product. On the other hand, at 195 K (or -78 °C), the endo-product forms nearly six times faster than the endo-product. Hence, we can see that lowering the temperature at which the reaction is run allows a more selective formation of the endo-product.
Let us now try and rationalise the observed order of stability of the two transition states. At first glance, one could argue that the endo-transition state looks a lot more strained than the exo-one and consequently infer that the latter is more stable than the former. However, from our calculations (which are verified by experiment), we know that this is not the case, and since the endo-transition state is probably more sterically strained than the exo-one, we can conclude that some form of electronic interaction must be overcompensating this negative steric effect.
The favourable electronic interaction is called secondary orbital overlap, and was defined by Fox et al.[3] as "the positive overlap of a non-active frame in the frontier molecular orbitals of a pericyclic reaction". The scheme shown below illustrates this idea.
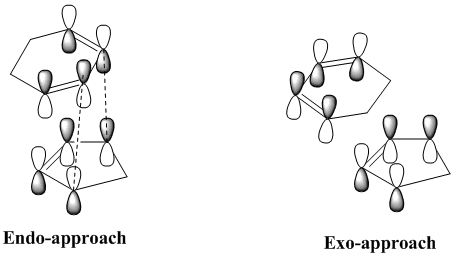
The secondary interaction are shown as dotted lines, and we can see that these interactions are present in the endo-product but not in the exo-one. This secondary orbital interaction is actually observed in the HOMO of the endo-transition state, where we can observe π* orbitals on the carbonyl groups of maleic anhydride, which indicates that the p-orbitals on the carbonyl carbons are in phase with the delocalised p-orbitals of the sp2-hybridsed carbons of the cyclohexadiene unit. This interaction is shown on the left below. This constructive secondary orbital interaction is even clearer in the LUMO+2 orbital which is shown on the right, below. It should however be mentioned that this interaction in the LUMO+2 orbital does not lower the energy of the endo-transition state, since by definition it is an unoccupied orbital - it does however show that such an interaction is possible in the endo-transition state.
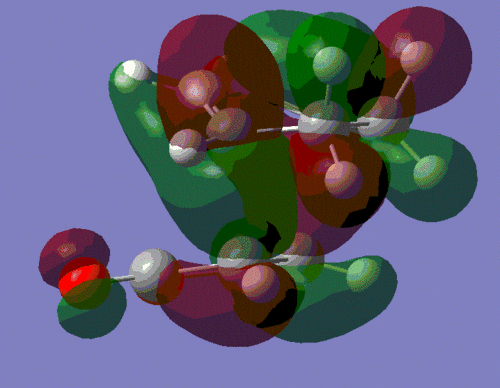 |
 |
There is no such interaction in the exo-transition state, and this an explanation for the greater stability of the endo-transition state.
Links to the output files
For the cyclohexadiene molecule:
Optimisation and Frequency Analysis .log file
For the maleic anhydride molecule:
Optimisation and Frequency Analysis .log file
For the endo-transition state:
Optimisation and Frequency Analysis .log file
For the exo-transition sate:
Optimisation and Frequency Analysis .log file
Unfortunately, the .chk files were too large to be uploaded onto the wiki.
Conclusion
We have seen that these calculations are very useful in generating the transition state energies of the reactions we have studied, which is extremely useful when one considers kinetic effects. These transition state calculations can then be coupled to a study of the energy of the products which allows us to compare and contrast the kinetics and thermodynamics of a reaction. It should however be noted that those calculations do not indicate whether a given reaction will be under kinetic or thermodynamic control, which is the great limitation of this method.
Another limitation of these calculations is that all the properties we have predicted so far apply to reactions which are carried out in vacuum. That is, the environment of the reacting molecules (solvent for example) has not been taken into account, which we know plays a major role during reactions as it can be the one factor determining whether or not a reaction proceeds.
