Rep:Mod3:jg1208 backup
Module 3: Physical Computational Chemistry
Introduction
The characterisation of reaction mechanisms is still one of the most challenging problems in chemistry. Structural parameters of reactants and products involved in chemical reactions can be obtained using a variety of experimental techniques, but these methods do not provide much information about connecting pathways. On the other hand, for many molecular systems, molecular orbital theoretical methods yield structural data of at least semi-quantitative accuracy, and are even predictive for some systems. One area where theoretical methods have a clear advantage over experiment is in the characterisation of transition state structures. The characterisation of reaction potential surfaces is often possible because of the capability of complex computer programs to calculate energies, energy gradients and energy second derivatives with respect to nuclear coordinates [1]
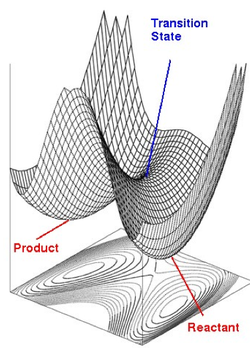
The recent availability of powerful high speed computers has extended the range of applicability of these methods. Since quantum mechanics can be used via ab initio, density functional theory (DFT) and semi-empirical approaches to study any nuclear configuration of molecules, reaction potential surfaces may be explored in intricate detail using the same computational tools as applied for the equilibrium structures of reactants and products. For systems containing more than three atoms there are too many degrees of freedom to allow the full surface to be mapped out discretely. Instead, Born-Oppenheimer potential energy surfaces are characterised by their critical points, minima and saddle points(see Fig.XXX[2]), so that these surfaces can be represented in terms of molecular structures (minima) and transition structures (saddle points) usually supplemented with a quadratic representation of the surface around these points.
The reaction path approximation has been introduced to study systems with a large number of nuclear coordinates in terms of a unique coordinate: the distance along the path connecting reactants, transition states, stable intermediates (if any) and products on the hypersurface.
The reaction path can be defined as a path of steepest descent linking the critical points. Transition structures are those points on the energy surface with only one negative eigenvalue of the Hessian matrix (H), for which the elements are the second derivatives of the energy with respect to the nuclear coordinates. These transition structures correspond to situations where the energy of the system is at a minimum for all but one independent direction where it is a maximum. This direction is called the transition vector and corresponds to the negative eigenvalue of the matrix H [3]
In the following project, the transition structures on the potential energy surfaces will be characterised for two key reactions in organic chemistry involving large systems: The Cope Rearrangement and the Diels Alder reaction.
The Cope Rearrangement
Sigmatropic rearrangements constitute an important class of concerted pericyclic reactions governed by orbital symmetry. They involve a reorganisation of electrons during which a group attached by a sigma bond migrates to the other terminus of a conjugated pi-electron system, with a simultaneous shift of the pi-electrons. Sigmatropic rearrangements are described by stating the relationship between the reacting centres in the migrating fragment and the pi system . The order [i,j] specifies the number of atoms in the migrating fragment and in the pi system respectively. [4]
[3,3]-sigmatropic rearrangements are very important reactions, and arguably the most useful kind are those that form new carbon-carbon bonds. An example is the [3,3]-sigmatropic rearrangement of 1,5-hexadienes – this is called the Cope rearrangement, developed by Arthur Cope in 1940. A general reaction scheme is outlined in figure 1.
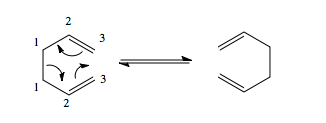
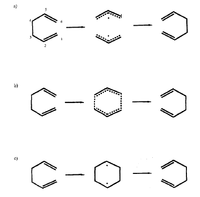
A priori there are three possible pathways for this reactions[3]:
1. A non-concerted pathway involving sigma-bond fragmentation resulting in two allyl radicals followed by recombination (Fig. 2a)
2. A concerted pericyclic pathway where making and breaking of sigma-bonds occur synchronously (Fig. 2b)
3. A non-concerted pathway involving sigma-bond formation to give cyclohexane-1,4-diyl (Fig. 2c)
 |
 |
 |
||||
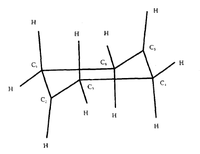
| Fig. 2a,b,c: | Fig. 3: The Chair Structure of 1,5-Hexadiene | Fig: 4: The Boat Structure of 1,5-Hexadiene |
The sigma-bond fragmentation mechanism is discarded because the the activation energy for the dissociation of 1,5 hexadiene (56 kcal/mol) is greater than that of the Cope rearrangement (33.5 kcal/mol).
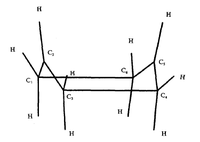
We are therefore left with two options. There is a general consensus that the 1,5-hexadiene rearrangement passes through species that have higher symmetry than reactants or products (C2), namely the chair (C2h) and boat (C2v) structures, shown in Figs. 3 and 4 respectively. The goal of this part of the report is to find the lowest energy reactants, transition states and products via optimisation of their geometries and then use this knowledge to determine the true mechanism of the rearrangement.
Optimising reactants and products
1,5-hexadiene is notable for having 2 dominant conformations - antiperiplanar and gauche. Within these, geometrically distinct orientations of the double bonds relative to the central carbon atom produce further conformations which must be taken into account when performing calculations related to reaction pathways. By optimising the geometry of a 1,5-hexadiene molecule each of these conformers can be identified.
In any calculation, the method used to optimise a structure is highly significant as it affects the length and accuracy of the calculation. In this computational experiment, a quantum mechanics-based ab initio method known as Hartree-Fock (HF) was used with the 3-21G basis set. This allows for a fast and reasonably accurate result, as 3-21G is a simple split valence basis set which has two sizes of basis function for each valence orbital[5] (for an explanation of basis sets and their relative accuracies, please refer to the 'background information' section I provided in Module 2 of this laboratory coursehere
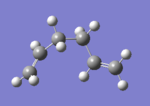
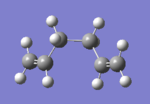
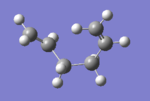
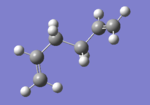
Optimisation found 10 different conformers, six of which have the gauche linkage, and four of which have the anti linkage. These conformations are shown as Newman Projections in Fig.XXX.

Theoretical analysis of the structures finds that anti-periplanar (app) conformations of the moelcule should be favoured over gauche ones due to favourable app interactions such as σ(C-H)/σ*(C-H). The ten conformers given in appendix 1 were found and are shown in Table 1 along with their respective energies and point groups.
| Structure |  |
 |
 |
 |
 |
|
| Energy (Hartrees) | -231.68772 | -231.69167 | -231.69267 | -231.69153 | -231.68962 | -231.68916 |
| Point group | C2 | C2 | C1 | C2 | C1 | C1 |
| Structure |  |
 |
 |
|
| Energy (Hartrees) | -231.69260 | -231.69254 | -231.68907 | -231.69097 |
| Point group | C2 | Ci | C2h | C1 |
The table shows that a) the conformers found match those given in appendix 1 and b) the lowest energy conformation of the 1,5-hexadiene is gauche 3, having an energy of -231.6927. This disagrees with the theory that app interactions increase the stability of the app conformer. So why have we found that the gauche conformer is more stable?
XXX EXPLAIN THIS USING NBO ANALYSIS
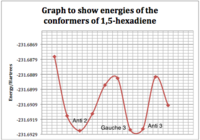
Recent literature [6] has cited HF as being too inadequate an approach for proper analysis of 1,5 hexadiene because unlike DFT Hartree-Fock does not take electron correlation into account. It therefore treats 1,5-hexadiene like n-butane, for which the energy difference between the anti and gauche confomers are an order of magnitude higher than the corresponding difference in 1,5-hexadiene. A better way to determine the true relative stability would be to use a so-called 'post-Hartree-Fock' ab initio approach, such as a Coupled Cluster CCSD(T) calculation, which accounts for electron correlation by constructing multi-electron wavefunctions using an exponential cluster operator. Alternatively, the small energy differences between the anti and gauche conformers could be included in molecular mechanics parameterisations to to facilitate an accurate calculation via this method[6] To gain more accurate results, re-optimisation was then performed using a DFT approach, with a B3LYP functional and a 6-31G(d) basis set.The anti2 and gauche3 conformers had the lowest energy using HF - how would they fare when electron correlation is taken into account? Summaries of the results are given in Figs XXX, XXX and XXX.
 |
 |
DFT clearly places the anti 2 conformer at a lower energy than gauche 3, which contradicts the HF results. However, it is better to compare the geometrical parameters such as bond lengths and angles, as the fact that DFT takes electron correlation into account will have a clear effect on the total energy. These results are compared to literature in Table XXX

| Parameter | HF/3G-21 | B3LYP/6-31G* | Literature [7] |
| Anti 2 | |||
| C3-C4 /Å | 1.553 | 1.548 | 1.536 |
| C2-C3/Å | 1.509 | 1.504 | 1.507 |
| C1=C2/Å | 1.316 | 1.334 | 1.341 |
| Average (C-H)/Å | 1.075 | 1.094 | 1.108 |
| C2-C3-C4/° | 111.4 | 112.7 | 111 |
| C1=C2-C3/° | 124.8 | 125.3 | 122.5 |
| C2=C1-H/° | 121.8 | 121.7 | 120.4 |
| C3-C2-H/° | 115.5 | 115.7 | 118.4 |
| H-C3-H/° | 107.7 | 106.7 | 107.1 |
| Energy/a.u. | -231.69254 | -234.61170 | |
The calculated bond lengths are very similar to literature, and DFT generally gives values closest to literature, which is expected as it takes electron correlation into account. It also appears to generate the most stable structures.
The energies calculated can only be confirmed with literature by including some additional terms - this requires a frequency calculation, which can also be used to characterise the critical point, that is, to confirm that a minimum has been found. This is done by inspecting all the vibrational frequencies present to see if all are real and positive.
Fig. XXX contains additional information about the energies of the anti2 confomer following vibrational analysis at the B3LYP/6-31G(d) level of theory. The bottom four lines are most significant. In order they outline:
(i) the potential energy at 0K taking zero-point vibrational energy into account: E0 = Eelec + ZPE;
(ii) the energy at standard conditions including translational, vibrational and rotational contributions to the total thermal energy: E = E0 + Evib + Erot + Etrans;
(iii) the energy containing a correction term for RT which is particularly significant when looking at dissociation reactions: H = E + RT;
(iv) the energy including entropic contributions: G=H-TS

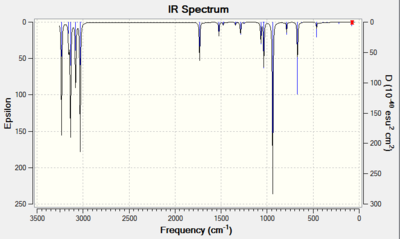
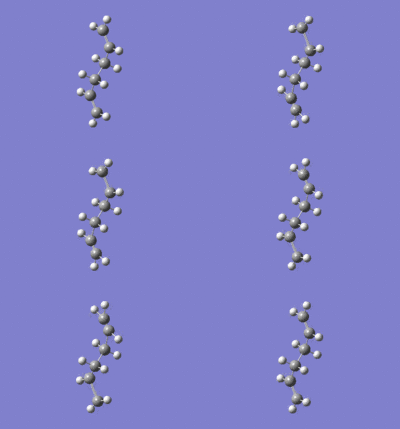
The IR spectrum of the anti2 conformer was also computed to confirm that a minimum was indeed reached during optimisation. All of the vibrational modes in the output fileare positive, which proves that a minimum was indeed reached. The IR spectrum is shown in Fig XXX. It shows peaks from C-H stretches (3000-3400cm-1), C-H bends (670-1100 cm-1) and a C=C double bond stretch at 1734cm-1. This particular vibration is shown in Fig XXX.
 |
 |
Optimisation of the Chair and Boat structures
Thus far all the potential reactants and products for the Cope rearrangement have been minimised to an optimal energy. However, transition state optimisations are more difficult, because the calculation needs to know where the negative direction of curvature (i.e. the reaction coordinate) is. In this section the various ways of optimising a transition structure will be explored.
Four techniques were used. The first involved predicting an approximate 'guess' transition state structure for the chair conformer, then computing the force constant matrix (i.e. the Hessian referred to in the introduction) in the first step of the optimisation, and updating these during the course of the transition state optimisation (called 'TS Berny' after Berny Schlegel, one of Gaussian's developers). However, this will not give good results if the guess structure is far from the exact structure, as the curvature of the surface may be very different at points far removed from the transition structure. Therefore, a second technique was used which involved freezing the reaction coordinate using the keyword Opt=ModRedundant and minimising the rest of the molecule. After the molecule fully relaxed, the reaction coordinate was unfrozen and the transition state optimisation was restarted.
The third technique was applied to the boat structure and utilised Gaussian's facility for automatically generating a starting structure for a transition state optimisation based upon the reactants and products that the structure connects, known as the Synchronous Transit-Guided Quasi-Newton (STQN) Method. This method uses a quadratic synchronous transit to get closer to the quadratic region around the transition state and then uses a quasi-Newton algorithm to complete the optimisation [8] Unlike other methods, the STQN does not require a guess for the transition structure, but rather generates a guess itself which is midway between the reactants and products, in terms of redundant internal coordinates. The method was requested using the QST2 option to the Opt keyword.
Finally, following optimisation of the boat and chair transition structures, a fourth technique known as the Intrinsic Reaction Coordinate (or IRC) method was used in order to allow prediction of which conformer the reaction paths from the transition structures will lead to. This creates a series of points by taking small geometrical steps in the direction of the PES area with the highest gradient, allowing the user to follow the minimum energy path from a transition structure down to its local minimum on a PES. IRC can itself be approached in a number of ways, and this will be discussed later in the report.
Chair structure
The first technique was applied. An allyl fragment was optimised using the HF/3-21G level of theory(DOI:10042/to-12550 ), and this was then copied to produce two optimised fragments which were positioned at a separation of around 2.20Å in such a way as to resemble a predicted transition state. This shown in FigXXX
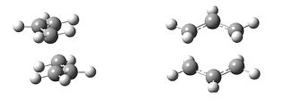
Then an optimisation+frequency to TS (Berny) was run to calculate the force constant at HF/3-21G including an additional keyword (Opt=NoEigen ) to prevent the calculation from crashing if more than one imaginary frequency was detected during the optimisation. If more than on imaginary frequency appears, it shows that a higher order saddle point has been found, but not a transition structure between two minima [5]
The optimised molecule is shown in Fig.XXX, along with a summary and animation of the process in Figs.XXX and XXX. The fragment separation (between carbons 1 and 9 in the log file) falls from 2.20Å to 2.02Å, and an imaginary vibrational mode is found at-818cm-1, which represents the simultaneous breaking and forming of a σ bond occurring in a [3,3]-sigmatropic rearrangement. The summary shows that the root-mean-square of the force constants is 0.000016, below the tolerance of 0.0003 which is the criterion by which Gaussian assesses whether an optimisation has converged and is complete [5]
 |
 |
 |
Following this, the second technique was applied by freezing the distance between the terminal carbons of the allyl fragments to 2.20Å before optimising the structure to a minimum (DOI:10042/to-12551 ). Then the 'bond' input was changed to 'derivative' and a TS Berny optimisation was performed without any force constant calculations. Similar results to the first method were found, with a single imaginary vibration appearing at -818cm-1, confirming the identity of the turning point as a transition state. Again, the allyl fragment separation dropped from 2.20Å to 2.02Å. The results are shown in Figs XXX, XXX and XXX, and are practically identical to those shown in Figs XXX-XXX (THE ONES ABOVE).
 |
 |
 |
 |
We have therefore seen that both techniques optimise to the same transition structure, with the same frequencies and bond lengths. We can conclude that both are adequate ways of calculating transition structures, although it should be noted that for more complicated systems the force constant calculations take longer to solve, so for this case the second technique would be preferred as it does not require analysis of the Hessian matrix.
THERMOCHEMISTRY??

Boat Structure
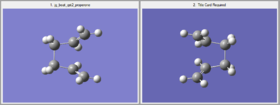
For the boat structure the optimisation is somewhat different. The third technique using the QST2 method was applied by drawing the reactant and product opposite each other (Fig.XXX) and allowing Gaussian to interpolate between the two structures to try to find the transition state between them. To achieve this, the atoms in the product were renumbered to match the order in the reactant. Following this an opt+freq to TS (QST2) calculation was performed at the HF/3-21G(d) level of theory (DOI:10042/to-12552 ).However, the optimisation was not successful, as shown in Fig.XXX. This is confirmed in Fig.XXX, which shows that the RMS gradient graph did not reach zero. The transition structure looks more similar to a chair than boat structure - the reason for this is that during interpolation, the program merely traanslated the top the allyl fragment and did not consider rotation around the central bond.
 |
 |
 |
So, starting from the optimised reactant and product in order to find the true transition state was not successful - we needed to modify the QST2 method. This was done by changing the central C2-C3-C4-C5 dihedral angle to 0o and the inner C2-C3-C4 and C3-C4-C5 angles to 100o (see Fig.XXX). A TS (QST2) optmisation + frequency calculation was then run in the same way as before (DOI:10042/to-12553 ) and the result is shown in Fig XXX*
 |
 |
 |
A boat transition state was found successfully! The frequency part of the calculation also found there to be a single frequency mode at 840cm-1, confirming the presence of a transition state.
It has therefore been shown that the QST2 method utilising the reactants and products to interpolate a transition structure is useful to an extent, but has its limitations, particularly if the reactants and products which are 'plugged in' at the start are not close to the transition structure. For more difficult cases, Gaussian provides a QST3 option to 'opt', which optimises a transition state structure based on the reactants, products, and a user-provided guess for the geometry of the transition structure [5]
Intrinsic Reaction Coordinate Methods
So the reactants and products have been optimised, and we have found the boat and chair transition structures that could exist between them. But it is still practically impossibe to predict which conformer of 1,5-hexadiene will form from the transition structure. The IRC method allows us to follow the reaction mechanism by monitoring the path of minimum energy from the transition structure to the local minimum on the PES in the direction of the product. It does this by generating a set of points which correspond to tiny changes in geometry in the direction of the PES where the gradient is steepest. If there are more points, these small changes are generated more accurately. An intial calculation is made in which the force constant is calculated once at the beginning. However, this does not optimize the geometry to a minimum, giving us three options as to how to proceed:
Method 1) We could take the last point on the IRC and run a normal minimisation on this. This is quick, but if you are not close enough to a local minimum, you may end up in the wrong minimium.
Method 2) The IRC could be redone, this time using a larger number of points until it reaches a minimum. This is more reliable than option 1, but if too many points are needed then it is possible to take the wrong direction after a while and end up at the wrong structure.
Method 3) The IRC could be redone, this time computing the force constants at every step. This is the most reliable option but is also expensive and is not always feasible for large systems.
Chair Structure
Initial Calculation
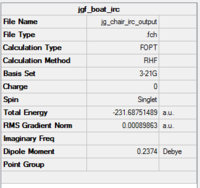
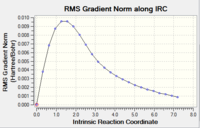
For the initial calculation, the reaction coordinate was computed in only for forward direction as the reaction coordinate is symmetrical. The number of points along the IRC was set to 50 from 6, and gave the results shown in Table XXX
| Molecule at first Point | Molecule at last point | Summary | IRC Pathway | IRC Gradient | Animation of optimisation |
|---|---|---|---|---|---|
 |
 |
 |
 |
 |
 |
| [|Log file for IRC at n=25] | |||||
The RMS gradient graph shows that the geometry has not been optimised as it is still above 0.001.Furthermore, the summary shows the total energy of the transition state to be -231.6875, which is less negative (i.e. less stable) than some of the conformers found in the first section. The three methods available to us were then used.
Method 1
| Calculation Summary | Optimised Transition Structure | Total energy curve | RMS Gradient | Animation of Optimisation |
|---|---|---|---|---|
 |
 |
 |
 |
 |
| Log file for IRC last point optimisationDOI:10042/to-12685 |
| |||
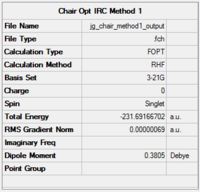
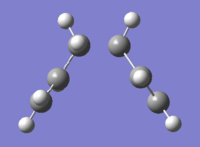
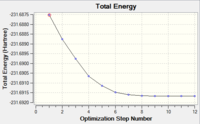
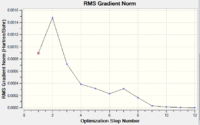
The table shows that the RMS gradient has dropped significantly to 0.00000069 - clearly a much better optimisation has been performed. This is confirmed by the horizontal line close to zero on the graph. Symmetrisation by Gaussview revealed that the structure has the C2 symmetry group. The energy is identical to that of the gauche2 conformer found in the first section, suggesting that the transition state obtained is in fact gauche 2. The gauche2 data is displayed in Fig.XXX with its point group, energy and relative energy for comparison.
Method 2
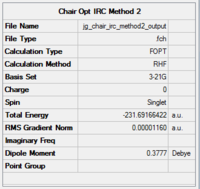
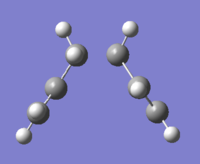
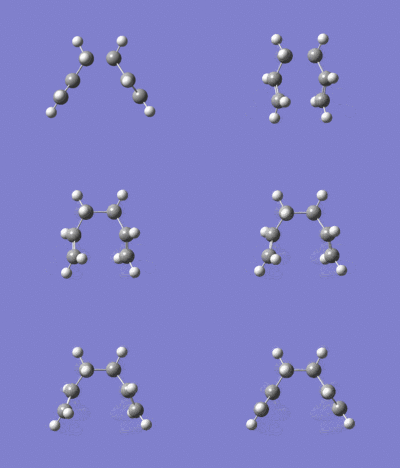
The second method was then applied by restarting the IRC and specifying that 100 points be taken until it reaches a minimum. The output data, in the form of the final structure and optimisation summary, animation and graphs are given in Table XXX. The RMS gradient graph is below 0.00001 and shows a smooth, horizontal line, indicating that the optimisation worked.
| Calculation Summary | Optimised Transition Structure | Total energy curve | RMS Gradient | Animation of optimisation |
|---|---|---|---|---|
 |
 |
 |
 |
 |
| Log file for IRC Method 2 DOI:10042/to-12686 |
| |||
Method 3
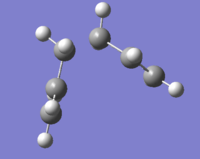
Then method 3 - the one reported to be the most reliable - was applied by re-doing the IRC sepcifying that the force constants should be computed at all 50 steps of the optimisation. The results are shown in Table.XXX, and show a smooth convergence of the gradient to a value of 0.000016.
| Calculation Summary | Optimised Transition Structure | Total energy curve | RMS Gradient | Animation of Optimisation | |
|---|---|---|---|---|---|
 |
 |
 |
 |
 | |
| Log file for IRC Method 3 DOI:10042/to-12687 | |||||
Comparison of three methods
The laboratory script gives a reported chair energy of -231.619322 Hartrees, which is in poor agreement with the calculated values, which are all -231.69166 to five decimal places. However, as mentioned above, method 1 gives an identical value to that of the Gauche 2 conformer, suggesting that the transition structure may resemble this. According to Hammond's postulate, this means that the chair transition state occurs late in the reaction pathway.
DFT Optimisation of the Chair Structure
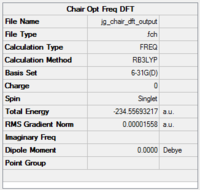
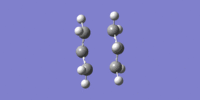
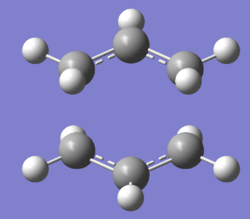
A DFT optimisation at the B3LYP/6-31G(d) level of theory was then performed on the HF/3-21G TS Berny optimised structure. As mentioned earlier, DFT differs from ab initio methods such as HF by including electron correlation - in layman's terms this means that it takes into account the fact that electrons in a molecular system react to each other's motion and try to avoid each other. HF calculations consider that each electron only reacts to an averaged electron density - this fails to account for the instantaneous interactions of pairs of electrons with opposite spin. But DFT can do this, because rather than calculating a wavefunction, it derives the electron distribution (or electron density function) directly. A functional is a function of another function, so this explains the name. The results of this optimisation are given in Fig. XXX.
 |
 |
 |
Inspection of the log file allows us to conclude that a successful optimisation has been carried out because
1. The RMS gradient is below its threshold value of 0.003 and
2. The RMS displacement is below its threshold value of 0.0012
Since the DFT and HF methods are so different in their approaches to calculating electron distribution, it nonsensical to compare the energies obtained by both. However, it is possible to compare the geometrical parameters for the chair transition structure obtained by both and comparing these to literature, as in Table XXX
| Parameter | HF/3-21G | B3LYP/6-31G(d) |
|---|---|---|
| Terminal C-C Fragmental Separation (Å) | 2.02 | 1.98 |
| C-C Bond Length (Å) | 1.38 | 1.41 |
| C-C-C-C Dihedral Angle (o) | 68.5 | 65.2 |
Very precise values for bond lengths and angles have been obtained - the range for bond lengths is 0.05Å, while the bond angles are within 3.2o of each other. It is telling that the DFT-calculated C-C bond length is lower than HF, because this is closer to the true length of 1.54Å, as might be expected given that DFT accounts for electron correlation. The difference from the real value is likely due to the fact that the bond is not yet fully formed. The lone imaginary frequency at -569cm-1 proves that a TS has been found. The difference between this value and the -818cm-1 vibration found by HF may be due to the fact that the DFT optimisation brings the fragments closer together- that is, closer to the product form. Bearing in mind that imaginary frequencies are no longer present in final products, it might therefore be expected that the DFT optimisation produces an imaginary frequency closer to zero (i.e. more positive) than HF found.
Boat Structure
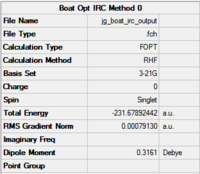
Now to use IRC on the boat structure! An initial calculation was run as for the chair structure described above. The results are shown in Table XXX.
| Molecule at last point | Summary | IRC Energy Curve | IRC RMS Gradient Curve | |
|---|---|---|---|---|
 |
 |
 |

| |
| DOI:10042/to-12700 | | ||||
The key information is in the RMS graphs. The RMS gradient is 0.0009, and is not close enough to zero to warrant a true optimisation. This is shown in the RMS gradient graph which does not converge to 0.
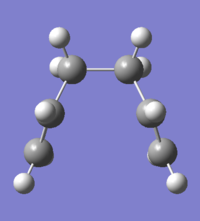
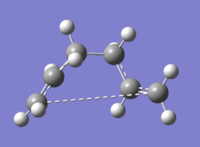
So, method 1 will be needed, as it was for the chair structure. The results are in Table XXX.
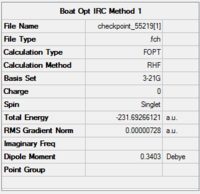
Method 1
| Molecule at first point | Molecule at last point | Summary | IRC Energy Curve | IRC RMS Gradient Curve | |
|---|---|---|---|---|---|
 |
 |
|
 |

| |
| DOI:10042/to-12701 | | |||||
The optimisation has clearly converged, as the RMS gradient is 0.000007 - very close to zero.
Method 2
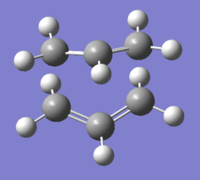
As for the chair structure, the IRC was restarted, specifying that 100 points be taken until it reaches a minimum. The output data are given in table XXX.
| Molecule at last point | Final Energy | IRC Energy Curve | IRC RMS Gradient Curve | |
|---|---|---|---|---|
 |
 |

| ||
| DOI:10042/to-12702 | | ||||
The RMS gradient appears to be heading for convergence after 12 steps, but moves away from the plateau before reaching a minimum value of 0.0001 - this is not significantly less than the threshold value of 0.0003, so the IRC analysis could be further improved by the application of method 3.
Method 3
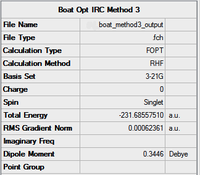
As for methods 1 and 2, method 3 was applied in the same way as for the chair. The results are displayed in Table XXX
| Molecule at last point | Summary | IRC Energy Curve | IRC RMS Gradient Curve | |
|---|---|---|---|---|
 |
|
 |

| |
| DOI:10042/to-12702 | | ||||
Comparison of Methods
| Calculation | Electronic Energy (Hartrees) |
|---|---|
| Initial | -231.67892442 |
| Method 1 | -231.69266121 |
| Method 2 | -231.692653021 |
| Method 3 | -231.68557510 |
As table XXX shows, the the four calculations gave precise results with an average value of -231.69 to two decimal places.
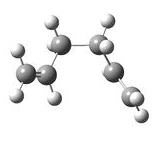
Method 1 gave the lowest energy, and as stated earlier it also gave an excellent RMS gradient value of 0.000007, so we can conclude that this was the most successful method of the three. The electronic energy it produced (-231.69266) is in excellent with the script value for the gauche 3 conformer which is displayed in table XXX. Comparison of this with the animation of the imaginary frequency produced by method 1 in Table XXX shows a striking resemblance too, implying that the boat TS will have the same structure as gauche 3
| Gauche 3 conformation | Method 1 IRC animation |
|---|---|
 |
 |
DFT Optimisation of Boat Structure
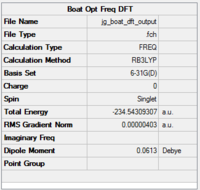
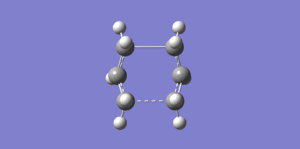
As with the chair structure, DFT was then used to re-optimise the boat transition states which had previously been optimised using HF/3-21G. The functional used was B3LYP and the basis set was 6-31G(d) DOI:10042/to-12722
 |
 |
 |
The calculated electronic energy value is -231.54309307 - this is in very good agreement with the script value for the boat TS of -231.54309, which shows that an optimisation using HF followed by DFT is an accurate way to find this TS. We know that a TS was found because the only negative frequency found was at -530cm-1 - this compares to a an imaginary frequency of -840cm-1 found by HF. The reason for this difference is like for the chair structure - DFT optimisation brings the fragments closer together, i.e. closer to the products, and thus produces an imaginary frequency closer to zero, i.e. more positive than HF.
The bond lengths and angles were compared as for the chair structure, and these are given in Table XXX
| Parameter | HF/3-21G | B3LYP/6-31G(d) |
|---|---|---|
| Terminal C-C Fragmental Separation (Å) | 2.14 | 2.21 |
| C-C Bond Length (Å) | 1.38 | 1.39 |
| C-C-C-C Dihedral Angle (o) | 64.7 | 64.2 |
Based on the arguments we gave for the vibrational analysis, we would expect DFT to give a shorter value for the interfragmental C-C bond length, but it is in fact longer by 0.07Å. This may be because the two different approaches differ enough that in this particular case, the interfragmental distances give anomalous results, but it is hard to say.
Activation Energies of Chair and Boat
In frequency analysis there is also a section called 'thermochemistry'. This tells us information about corrections to parameters such as vibrational and rotational temperatures, as welll as the zero-point energy for the system at standard conditions, which is a correction to the electronic energy of the molecule to account for the effects of molecular vibration which persist even at 0 K [5]
The thermochemical output for the chair structure optimised by DFT is shown in Fig. XXX
 |
 |
Inspection of Figs XXX and XXX reveals that the computed values for 'sum of electronic and zero-point energies' (chair: -231.414878; boat: -234.402342) and 'sum of electronic and thermal energies' (chair: -234.408949; boat: -234.396008) all agree with the script values to 3 decimal places. The first one tell us the potential energy at 0K taking zero-point vibrational energy into account: E0 = Eelec + ZPE, while the latter one tell us the energy at standard conditions including translational, vibrational and rotational contributions to the total thermal energy: E = E0 + Evib + Erot + Etrans
The activation energy of a reaction can also be found by calculating the difference between the sums of the electronic and thermal energies of the transition states and product. We calculated these earlier for the anti 2 conformation, which DFT found to be the lowest energy conformation. So all we need to do is find the difference between these values and those found in Fig.XXX (THE ONE ABOVE) and then convert the units from Hartrees to kcal/mol (1 hartree = 627.509 kcal/mol ). The results are shown in table XXX, along with the script values for the corresponding HF calculations, plus the experimental values.
Table XXX: Summary of activation energies (in kcal/mol)
| HF/3-21G (script) | HF/3-21G (script) | B3LYP/6-31G* | B3LYP/6-31G* | Expt. | |
| at 0 K | at 298.15 K | at 0 K | at 298.15 K | at 0 K | |
| ΔE (Chair) | 45.70 | 44.69 | 34.28 | 33.21 | 33.5 ± 0.5 |
| ΔE (Boat) | 55.60 | 54.76 | 41.96 | 41.32 | 44.7 ± 2.0 |
The results from DFT optimisation are within around 3.5 kcal/mol of the experimental data for the boat transition state at 0 K, so this is reasonably accurate. The results at 25 K are even more encouraging - the activation energy for the chair transition state is within 1.3 kcal/mol of the experimental value. The Hartree-Fock optimisations are less accurate however, always 10-12 kcal/mol away from the experimental data. This might be expected as the method is less accurate than DFT, as explained in earlier sections. It is worth noting that the activation energies for the boat transition state are consistently higher than for the chair transition state, implying that more thermal energy is needed for the reaction to occur via this mechanism. Therefore, when the reaction is under thermodynamic control (i.e. high temperatures) the system has enough energy to form an equilibrium and it can go through the boat transition structure, but when under kinetic control (i.e. low temperatures) the reaction goes through the chair transition state as this is quicker to reach. As we would expect, the table shows that the activation energies are lower for both transition states at higher temperatures, because then the molecules have more kinetic energy which can overcome the barrier to reaction than at 0 K, where they only have the zero-point energy available. The freqchk utility program was then used to obtain thermochemical data at 200K. The results are shown in Figs XXX and XXX.
 |
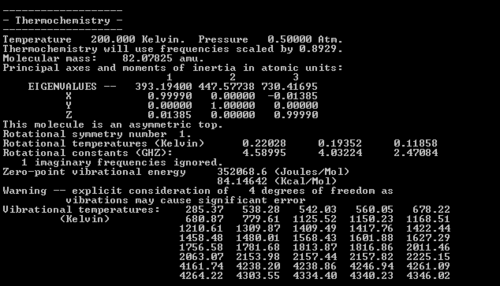 |
The key point is that the zero-point energy of the chair transition state is just under 8 kcal/mol lower than the boat, which corroborates the earlier data. Note that at 0 K this difference was over 8 kcal/mol, i.e. the difference in activation energies is going down, so the reaction pathway is more likely to proceed via the boat transition state than before.
Diels Alder Cycloaddition
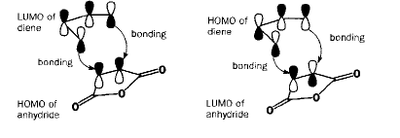
The Diels-Alder reaction between a diene and a dienophile is one of the major synthetic reactions that are used for the formation of C-C. It's usefulness lies in the mild conditions and predictable regio- and stereospecificity of the process. For most purposes the thermal reaction requires the presence of an electron-withdrawing substituent on the alkene [9]. The reaction is exemplified by the addition of ethylene (dienophile) to cis-butadiene (diene) as shown in Fig.XXX The reaction is concerted and involves the HOMO or LUMO of one fragment interacting with the LUMO or HOMO of another fragment, resulting in a bonding and antibonding orbital. The feasibility of a given reaction depends largely on the HOMO-LUMO interactions according to the following rules
- If the HOMO of one reactant can interact with the LUMO of the other reactant then the reaction is allowed
- The HOMO-LUMO can only interact when there is a significant overlap density. If the orbitals have different symmetry properties then no overlap density is possible and the reaction is forbidden.
A quantum mechanical treatment of the transition state in this reaction allows us to derive the electronic distribution, and hence a molecular orbital analysis of the fragments in order to determine which FMO's take part in the reaction. The point groups of cis-butadiene and ethylene are C2v and D2h respectively. The σv plane through the ethylene double bond will be analysed to provide information about the orbital symmetries at hand, because this plane is also found in the transition structure and product.
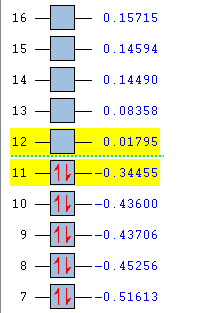
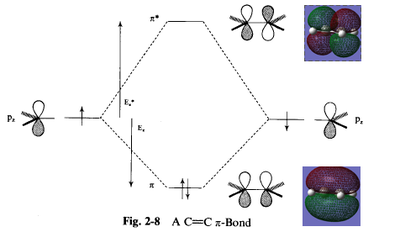
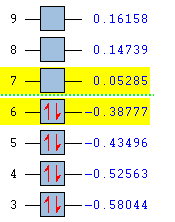
A qualitative prediction of which orbitals will combine can be made by inspection of the molecules involved. Ethylene is a simple example as its double bond has a pi-bonding and pi*-antibonding orbital, which directly correspond to ethylene's HOMO and LUMO. Cis-butadiene consists of two double bonds, and these combine in two different ways to produce the HOMO and LUMO. This is shown in Fig XXX, in which the ethylene is replaced with a better, analagous dienophile having an electron withdrawing group: Maleic anhydride.
If the dienophile is substituted with substituents that have pi-orbitals that can interact with the new double bond that is being formed in the product, then this interaction can stabilise the regiochemistry of the reaction. In this part of the report, the nature of the transition structure of the Diels Alder reaction, both for cases with and without substitutents, will be studied.
Optimising the reactants
| Name of Molecular Orbital | Molecular Orbital Diagram | Symmetry |
|---|---|---|
| Cisbutadiene HOMO |  |
Anti-symmetric |
| Cisbutadiene LUMO |  |
Symmetric |
| Ethylene HOMO | 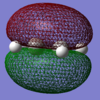 |
Symmetric |
| Ethylene LUMO |  |
Asymmetric |
| DOI:10042/to-12693 ;DOI:10042/to-12694 | ||
To calculate the molecular orbitals, the optimisation method chosen for both molecules was a semi-empirical (SE) AM1 approach - this is the fourth kind of approach we have come across after molecular mechanics, ab inito methods (such as HF) and density functional theory. SE became popular in the 1960s because the quantum mechanical calculations used in ab inito methods resulted in 3 and 4-centred integrals, which were quite difficult to solve quickly at the time. SE avoids these integrals by drawing on a library of integrals that was compiled by finding the best fit of some calculated entity like geomery or energy to the experimental vvalues. The plugging of experimental values into mathematical procedure to get the best calculated values is called paramterisation. It is the mixing of theory and experiment that makes the method 'semiemprical'[10]
The results of the AM1 calculations are given in Fig.XXX, along with the symmetries of the molecular orbitals.
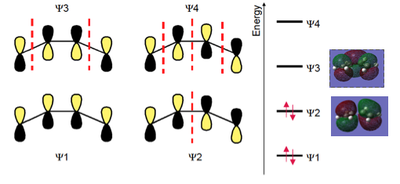
The illustrations of the orbitals can be superimposed onto a literature molecular orbital diagram to see how they matched. As shown in Fig.XXX, there is a clear resemblance between the two for both ethylene and butadiene.
 |
 |
 |
 |
Combine the two HOMO-LUMO pairs of the diene and dienophile in your mind. Can you see how they resemble the qualitative prediction in Fig.XXX? To prove that the HOMO of the butadiene overlaps with the LUMO of the the ethylene (or vice versa) for the reaction to take place, we must investigate the transition state.
Transition State Analysis

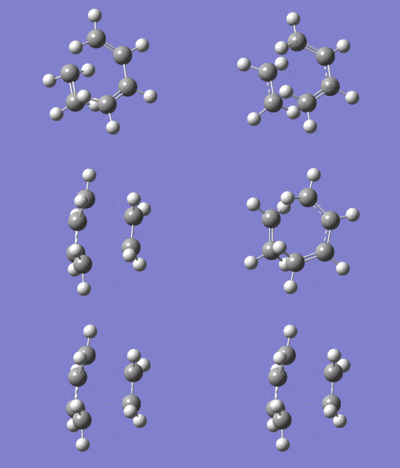
The transition state of this reaction is thought to have an envelope structure formed by drawing a bicyclo compound and removing the CH2CH2 fragment. This modification is shown in Fig. XXX. The two fragments separated by the dotted line were then optimised using the AM1 semi-empirical method followed by recombination at a separation of 2.2 Å [11] and TS (Berny) optimisation to generate the transition state. This was then modified using the IRC method 3 and repeated using the DFT approach for comparison DOI:10042/to-12742 , DOI:10042/to-12732 , DOI:10042/to-12741
 |
 |
 |
| Parameter | AM1 (Å) | DFT (Å) | DFT Lit. (Å) |
| Terminal C-C fragmental separation | 2.12 | 2.27 | 2.27 |
| C-C Bond length in Ethene fragment | 1.38 | 1.38 | 1.39 |
| C-C bond length in diene fragment | 1.38 | 1.38 | 1.38 |
| DFT Optimisation Illustrations | |
| Optimised Structure | 
|
| Lowest real frequency at 147cm-1 | 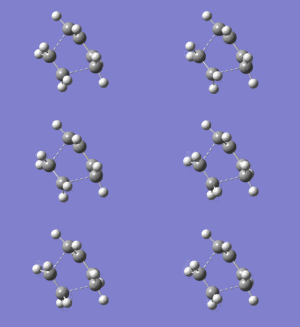
|
| Imaginary negative frequency at -956cm-1 | 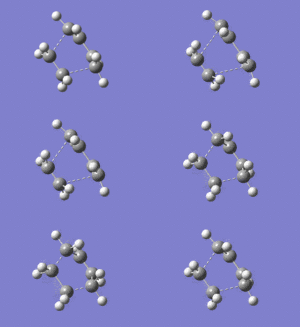
|
The literature bond lengths are taken from the diagram in Fig.XXX [12]

There is only one imaginary vibrational frequency - at -956cm-1 - so a transition state has indeed been found.
Analysis of the geometrical data show what we were expecting: All the C-C single bonds are 1.38Å long - short of the ideal length of 1.54Å - and all the C=C double bond is longer than the ideal length of 1.35Å. These discrepancies suggest that the transition structure found has bonds which are changing in form from sigma to pi (or pi to sigma), i.e. the transition structure lies somewhere between the reactant and products.
Regarding the distance between the terminal carbons of the two fragments, this is 2.12Å - higher than the ideal C-C bond length, but within the van der Waals contact radius of 3.40Å, which implies that there is overlap of electron density between the terminal carbons. Regarding bond angles, the H-C-H angles are all in the range 114-119o, which is between the ideal angles for sp2 (120o) and sp3(109.5o) hybridised carbons. This provides further evidence that the bonds are changing from sigma to pi or vice versa.
The lone imaginary vibration at -956cm-1 confirms that there is a concerted formation of sigma bonds between the butadiene and ethene molecules due to the overlap of FMOs we saw in the previous subsection. The animation in Fig.XXX shows the concerted formation and breaking of C-C bonds in the reaction, which is indeed how the parent Diels-Alder reaction proceeds [13]
The lowest frequency real vibration is found at 147cm-1 - this corresponds to a twist about the partially-formed C-C bond.
Regarding comparison of the methods, DFT gave results in near-perfect agreement with the literature. The AM1 results are also reasonable, providing results that only differ significantly from literature for the interfragmental distance.
Molecular Orbitals of the Transition State
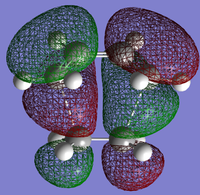
AM1 was then used to compute the HOMO and LUMO of the transition states for this reaction, and these are shown in Figs XXX and XXX.
 |
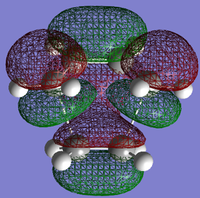 |
On the molecular orbital diagram there would be bonding and antibonding orbitals which are generated from the interaction of reactant orbitals with the same symmetry. The HOMO arises because both the HOMO of cis-butadiene and the LUMO of ethene are antisymmetric through the σv plane, while the LUMO arises because both the HOMO of ethene and the LUMO of cis-butadiene are symmetric. These orbitals combine to form the ones shown.
Reaction of cyclohexa-1,3-diene with maleic anhydride
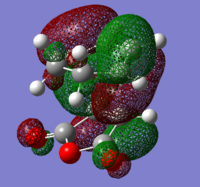
Another example of a Diels-Alder reaction is the cycloaddition of cyclohexa-1,3-diene (1 in Fig.XXX (BELOW) with maleic anhydride (2). Its regioselectivity is of interest and computational techniques can be used to investigate whether the exo (3) or endo (4) product is preferred. It is thought that the endo product is the kinetic product, because although the exo product is more stable, there is a secondary orbital interaction (Fig.XXX) in the endo form which stabilises the transition state which is therefore reached first during the reaction. Since DFT had been shown to give the most accurate results previously, this approach was used to investigate the regioselectivity.
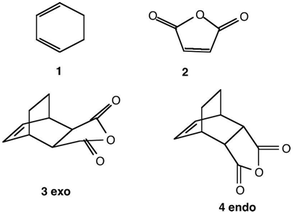

Optimisation
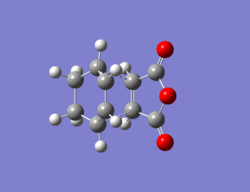
Firstly, the reactants' geometries were optimised using DFT at the B3LYP/6-31G(d) level of theory, as this is a popular basis set which takes electron correlation into account. After this, the optimised fragments were combined to form exo and endo transition states, after which these structures were optimised again to 'TS (Berny)' in order to find the final, optimised transition state.
 |
 |
 |
 |
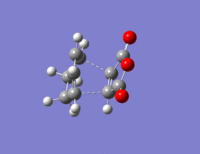
Now armed with the optimised reactants, the transition state was searched for using a TS (Berny) optimisation, with initial 'guess' exo and endo structures as in Fig. XXX (THE ONE ABOVE) set to an interfragmental distance of 2.1Å
Endo
| Calculation Summary | Optimised Structure | Animation of imaginary frequency | HOMO | LUMO |
|---|---|---|---|---|
 |
 |
 |
 |

|
| DOI:10042/to-12736 | ||||
The
| Calculation Summary | Optimised Structure | Animation of imaginary frequency | HOMO | LUMO |
|---|---|---|---|---|
 |
 |
 |
 |

|
| DOI:10042/to-12734 | ||||
Exo
| Calculation Summary | Optimised Structure | Animation of imaginary frequency | HOMO | LUMO |
|---|---|---|---|---|
 |
 |
 |
 |

|
| DOI:10042/to-12737 | ||||
| Calculation Summary | Animation of imaginary frequency | HOMO | LUMO | |
|---|---|---|---|---|
 |
 |
 |

| |
| DOI:10042/to-12738 | ||||
Further work: Hydrogen vs Deuterium abstraction - reaction of a chlorine atom with d1-Dichloromethane
d1-Dichloromethane can react with chlorine atoms in either of two ways: by hydrogen abstraction to produce HCl or by deuterium abstraction to produce DCl, as shown in Fig. XXX.
[[ ]]
References
- ↑ M. Dupuis, P. Mougenot, I. D. Watts, G. I. B. Hurst, and H. O. Villar, in MOTECC: Modern Techniques in Computational Chemistry, edited by E. Clementi (ESCOM, New York, 1989), Chap. 7
- ↑ http://www.chm.bris.ac.uk/pt/harvey/msci_pract/back_qm.html
- ↑ 3.0 3.1 Maluendes S.A., Dupuis M.J. Chem. Phys. 93 (8) 1990
- ↑ Carey F.A., Sundberg R.J.; Advanced Organic Chemistry Part A: Structure and Mechanisms, 5th Ed., Springer Science, 2007, 911
- ↑ 5.0 5.1 5.2 5.3 5.4 Foresman J.B., Frisch A.; Exploring Chemistry with Electronic Structure Methods; 2nd Ed.; Gaussian Inc,; 1996
- ↑ 6.0 6.1 Rocque B.G., Gonzalez J.M., Schaefer III H.F.; Molecular Physics 2002, Vol.100, No 4, 441-446
- ↑ G. Schultz, I. Hrgittai, J. Mol. Struct., 1995, 346,63-69
- ↑ http://www.gaussian.com/g_whitepap/qst2.htm
- ↑ Hanson J.R.; Functional Group Chemistry, RSC Tutorial Texts 1999, 73
- ↑ Lewars E.G., Computational Chemistry - Introduction to the theory and applications of molecular and quantum mechanics.; Springer Science,2011, 3
- ↑ Suarez, D.; Sordo, T. L.; Sordo, J. A. J. Org. Chem. 1995, 60, 2848-2852, doi 10.1021/jo00114a039
- ↑ Goldstein, E.; Beno, B.; J. Am. Chem. Soc., 1996, 118, 6035-6044. DOI:10.1021/ja9601494
- ↑ Sakai, S., "Theoretical Analysis of Concerted and Stepwise Mechanisms of Diels-Alder Reaction between Butadiene and Ethylene,"J. Phys. Chem. A, 2000, 104, 922-927, DOI: 10.1021/jp9926894

