Rep:Mod3:jc808
Computational Chemistry: Module 3
During the course of this module, the use of computational methods to analyse the transition states of Cope Rearrangements and Diels-Alder cycloadditions.
Cope Rearrangement
Optimisation of the Reactants and Products
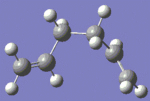
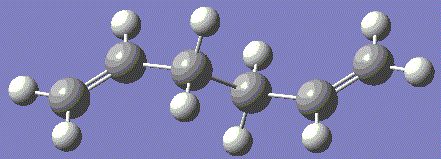
A molecule of 1,5-hexadiene was drawn using the R-group fragment tool. The structure was cleaned and then submitted to a Gaussian calculation for an optimisation using the Hartree-Fock Method and 3-21G basis set. The results are as follows:
| File Type | .chk |
| Calculation Type | FOPT |
| Calculation Method | RHF |
| Basis Set | 3-21G |
| Final Energy / a.u. ± 3.81x10⁻³ | -231.69260235 |
| Final Energy / kJ mol-1 ± 10.0 | -608308.928 |
| RMS Gradient Norm / a.u. | 0.00001824 |
| Dipole Moment / Debye ± 0.01 | 0.2021 |
| Point Group | C2 |
| Final C=C-C-C Bond Angle / o ± 0.1 | 115.156 |
| Final C-C-C-C Bond Angle / o ± 0.1 | 176.889 |
Anti 1,5-hexadiene optimisation .chk file
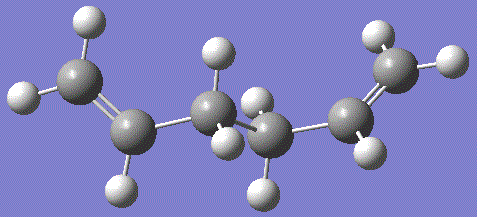
It can be seen that the two torsion angles between the C2-C3 and C4-C5 are equal at 115° and the central carbon atoms torsion angle has remained close to 180°. The molecule also possesses C2 symmetry with a rotational axis running perpendicular through the C3-C4 bond.
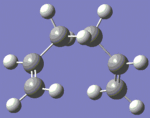
The molecule was redrawn, this time with a gauche (60°) torsion angle between the central four carbons. Again, the molecule was cleaned and submitted to Gaussian for an optimisation using the Hartree-Fock Method and 3-21G basis set. The results are as follows:
| File Type | .chk |
| Calculation Type | FOPT |
| Calculation Method | RHF |
| Basis Set | 3-21G |
| Final Energy / a.u. ± 3.81x10⁻³ | -231.69266120 |
| Final Energy / kJ mol-1 ± 10.0 | -608309.082 |
| RMS Gradient Norm / a.u. | 0.00001556 |
| Dipole Moment / Debye ± 0.01 | 0.3049 |
| Point Group | C2 |
| Final C=C-C-C Bond Angle / o ± 0.1 | 120.878 |
| Final C-C-C-C Bond Angle / o ± 0.1 | 67.664 |
Gauche 1,5-hexadiene optimisation .chk file
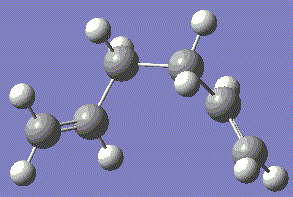
This molecule has C1 symmetry as the orientation of the double bonds means that no rotational axis is possible.
Again, the calculated torsion angles are close to multiples of 60°, resulting in staggered orientations. For this reason, there is very little difference in energy between the two geometries. However, there is a slight difference, with the gauche conformation being 0.154 kJ mol-1 lower in energy.
Further investigation into the lowest possible geometry was made by manually changing the orientation of the double bond by changing the torsion angle about the C2-C3 and C4-C5 bonds. These molecules were optimised using Gaussian with the same method and basis set as above, Hartree Fock and 3-21G. The results are tabulated below:
| Anti-diene geometry 1 .chk file | Anti-diene geometry 2 .chk file | Anti-diene geometry 3 .chk file |
| Gauche-diene geometry 1 .chk file | Gauche-diene geometry 2 .chk file | Gauche-diene geometry 3 .chk file |
Simply looking as sterics, the anti conformers should be the lowest in energy as they bring the allyl substituents as far apart as possible. However, we find that the gauche 3 conformer has the lowest energy. This is likely to be due to a favourable overlap between orbitals.
Each geometry was compared to Appendix 1 and it was found that the energies could be matched to 8 s.f. The same titles were used as in the appendix. The lowest energy form was found to be the gauche 3 geometry. Comparing this to the anti 2 geometry There is a very small difference in energy, only 0.331 kJ mol-1. The anti 2 geometry was then further optimised using B3LYP/6-31G(d) method and basis set:
| File Type | .chk |
| Calculation Type | FOPT |
| Calculation Method | B3LYP |
| Basis Set | 6-31G(d) |
| Final Energy / a.u. ± 3.81x10⁻³ | -234.61171035 |
| Final Energy / kJ mol-1 ± 10.0 | --615973.046 |
| RMS Gradient Norm / a.u. | 0.00001373 |
| Dipole Moment / Debye ± 0.01 | 0.0000 |
| Point Group | Ci |
Anti 1,5-hexadiene geometry 2 DFT optimisation .chk file
The more thorough B3LYP/6-31G(d) calculation gave a lower energy that the previous HF/3-21G. However, the fact that different calculation were used means that the energies are not comparable. The bond lengths and angles are comparable though and give noticeably different results. They are summarised below.
| Property |  |
 |
Literature[1] |
| Final Energy / a.u. ± 3.81x10⁻³ | -231.69253528 | -234.61171035 | - |
| Final Energy / kJ mol-1 ± 10.0 | -608308.751 | -615973.046 | - |
| Bond Length 4-1 / Å | 1.55282 ± 0.01 | 1.54806 ± 0.01 | 1.538 ± 0.027 |
| Bond Length 1-7 / Å | 1.50887 ± 0.01 | 1.504202 ± 0.01 | 1.508 ± 0.012 |
| Bond Length 7-8 / Å | 1.31611 ± 0.01 | 1.33350 ± 0.01 | 1.340 ± 0.003 |
| Bond Angle 4-1-7 / ° | 111.34826 ± 0.1 | 112.68032 ± 0.1 | 111.5 ± 0.9 |
| Bond Angle 1-7-8 / ° | 124.81197 ± 0.1 | 125.28951 ± 0.1 | 124.6 ± 1.0 |
| Torsion Angle 4-1-7-8 / ° | 118.58280 ± 0.1 | 114.67395 ± 0.1 | 116.0 (MM2 calculated) |
The results from each calculation are similar but distinct allowing comparison to literature to determine the most accurate method. The study referenced in the table was conducted using electron diffraction patterns so should give reliable values. It can be seen that the experimental data does not correlate more closely to one or the other of the calculations. Another study[2] by Rocque, Gonzales and Schaefer using high accuracy computational methods, specifically the DZP CCSD(T) method, found a central carbon-carbon bond length of 1.535Å and a 4-1-7-8 torsional angle of 115.9°. It is clear that out of the two methods used in this study, B3LYP/6-31G(d) found values much closer to the literature. It seems that however powerful the method used, it may still not arrive at an exact match to actual lengths and angles.
This can be attributed to what is known as the 'Gauche Effect'. This occurs when σ bonding orbitals can overlap with the antibonding orbitals of a polarisable group, in this case the C-H σ bonding orbital to the double bond π* antibonding orbital.
Frequency Analysis of Anti 1,5-hexadiene Geometry 2
The anti 2 geometry optimised by the B3LYP/6-31G(d) method earlier was submitted to Gaussian for a frequency analysis using the same method. The .log file was opened to check that the energy is the same as previously calculated:
| File Type | .chk |
| Calculation Type | FREQ |
| Calculation Method | RB3LYP |
| Basis Set | 6-31G(d) |
| Final Energy / a.u. ± 3.81x10⁻³ | -234.61171035 |
| Final Energy / kJ mol-1 ± 10.0 | -615972.046 |
| RMS Gradient Norm / a.u. | 0.00001373 |
| Dipole Moment / Debye ± 0.01 | 0.0000 |
| Point Group | Ci |
Anti 1,5-hexadiene geometry 2 frequency .log file
The final energy is exactly the same as the previous optimisation and so no change to geometry has occured. Further proof that a true minimum on the energy level surface can be found by opening the .log file and checking the low frequencies:
Low frequencies: -9.4845, -0.0010, -0.0009, -0.0007, 3.7559, 13.0269.
The fact that the four lowest frequencies are negative proves that the optimisation is not the most accurate, but the magnitude is below 10 and so can be considered suitable for this study.
The vibrations and spectrum can be visualised and the important vibrations tabulated below:

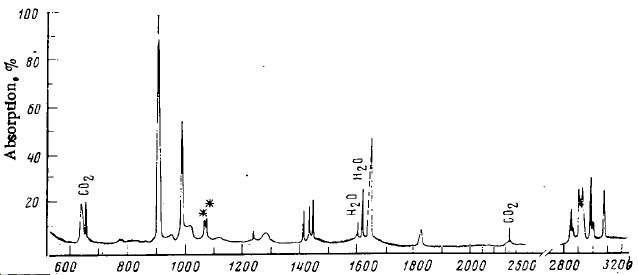
Fig. 3: Calculated and literature[3] spectra for Anti 1,5-hexadiene
| Vibration | Calculated Frequency / cm-1 ± 10% | Intensity | Literature[3] Frequency / cm-1 |
| Asymmetric stretching of allylic CH2 bonds | 3233.9 | 45 | - |
| Symmetric stretching of allylic CH2 bonds | 3155.5 | 15 | - |
| Asymmetric stretching of allylic CH bonds | 3136.9 | 56 | - |
| Asymmetric stretching of aliphatic CH2 bonds | 3080.2 | 35.8 | - |
| Symmetric stretching of aliphatic CH2 bonds | 3031.5 | 54 | - |
| Stretching of double bonds with concerted scissoring of allylic CH2 bonds | 1734.3 | 18 | - |
| Asymmetric concerted scissoring of allylic CH2 bonds | 1476.2 | 2 | 1477 |
| Symmetric concerted scissoring of allylic CH2 bonds | 1474 | 0 | 1463 |
| In phase bending of allylic CH bonds | 1343 | 1 | 1388.5 |
| Deformation rocking of aliphatic CH2 bonds | 1289 | 6 | 1242 |
The literature spectrum matches quite well with that calculated. The literature only quoted a few specific frequencies as a comparison to the fully deuterated analogue. For this reason, the more obvious vibrations are not quoted. These include the various C-H stretches which occur around 3000cm-1, with the higher energy allylic stretches occuring above. The important vibrations are the bending, rocking and scissoring vibrations associated with the C-H bonds. The two sources match quite well, with a correlation of within 40cm-1 and in some case an almost exact match. This small discrepancy could be due to the similar energies of the lowest anti and gauche conformations. The study was conducted at -261.2°C and so the majority of the molecules would be in the lowest energy form, but it would only take a small amount of thermal energy to promote the geometry to other structures. Although the molecule is not highly symmetrical, the centre of inversion means many of the vibrations are equal and opposite and so do not result in a change of dipole and as such are IR inactive. One interesting thing to note is the symmetric concerted scissoring of allylic CH2 bonds at 1474cm-1 was calculated to have zero intensity due to the lack of overall dipole moment. The equivalent stretch in the gauche conformation would result in a dipole and so would give a peak. This may be evidence of the existance of other geometries.
The log file gives information about the thermochemistry of the molecule, which can be compared to literature values.
Zero-point correction=                           0.142507 (Hartree/Particle)
Thermal correction to Energy=                    0.149853
Thermal correction to Enthalpy=                  0.150797
Thermal correction to Gibbs Free Energy=         0.110933
Sum of electronic and zero-point Energies=           -234.469204  (E = Eelec + ZPE) at 0K
Sum of electronic and thermal Energies=              -234.461857  (E = E + Evib + Erot + Etrans) at 298.15K and 1 atm
Sum of electronic and thermal Enthalpies=            -234.460913  (H = E + RT)
Sum of electronic and thermal Free Energies=         -234.500777  (G = H - TS)
Optimizing the "Chair" and "Boat" Transition Structures
To investigate the transition state of the Cope rearrangement, a single allyl fragment (CH2CHCH2) was drawn.
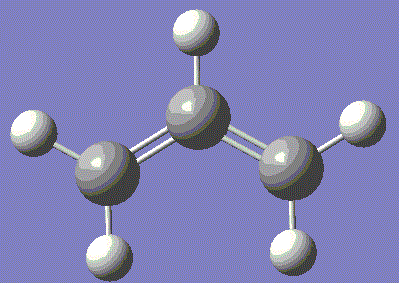
Fig. 4: Initial allyl fragment
Note that the fragment contains two formal double bonds. This fragment was submitted to for optimisation with the HF/3-21G method.
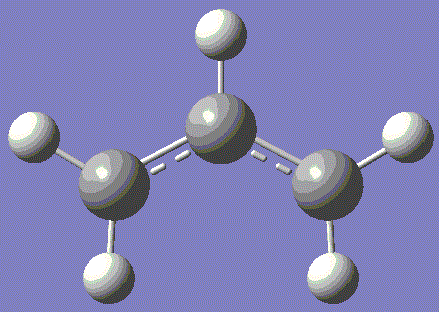
Fig: 5: HF optimised allyl fragment Allyl fragment optimisation .log file
The calculation has fixed the double bond issue and given a structure with delocalisation across the whole fragment. Two of these fragments were arranged in an approximation of the chair transition state with the terminal carbons of each fragment ~2.2Å apart. The molecule was submitted for a Gaussian calculation to optimise to transition state (Berny) with the following instructions:
# opt=(calcfc,ts,noeigen) freq hf/3-21g geom=connectivity
Chair transition state optimisation .log file The returned structure matched the predicted chair transition state and had a predicted imaginary vibrational frequency of -817.94 cm-1 corresponding to the Cope rearrangement.
Calculated imaginary frequency corresponding to the Cope rearrangement of the chair transition state
It can be seen that the vibration mimics the alternating formation of a bond between each pair of terminal carbons. The terminal hydrogens also show a change from sp2 to sp3 hybridisation. Also, the one bond decreases while another increases in a concerted fashion, as is predicted for a Diels Alder rearrangement.
An alternative optimisation method involving the use of frozen coordinates was investigated. Using the Redundant Coordinate Editor each of the terminal carbon pairs were frozen at 2.2Å. The constrained molecule was submitted to an Gaussian optimisation to a minimum with the following heading:
# opt=modredundant hf/3-21g geom=connectivity
Chair transition state optimisation .chk file using frozen coordinates
This had the effect of optimising the rest of the fragment, while maintaining a set distance between the terminal carbons. The optimised fragments were then submitted to a transition state optimisation but with the terminal carbon pairs set to derivative:
# opt=(ts,modredundant) hf/3-21g geom=connectivity
Chair transition state optimisation .log file using coordinate derivatives
The optimisation calculated by each method can be compared:
| TS(Berny) optimisation | Frozen Coordinate optimisation | |
| Terminal carbon pair separation / Å ± 0.01 | 2.02053 | 2.01986 (average) |
| Final Energy / a.u. ± 3.81x10⁻³ | -231.61932246 | -231.61932192 |
| Final Energy / kJ mol-1 ± 10.0 | 608116.53 | 608116.53 |
Both methods gave terminal carbon separations identical to 3 significant figures and final energies identical to 8 significant figures. It seems that both methods are effective at calculating the geometries of transition structures. The frozen method did not generate any vibrational data and so this cannot be compared.
The returned geometry had a terminal carbon bond distances of 2.01987 and 2.01985Å, comparing very well to that calculated by the previous calculation.
Boat
The boat transition state was investigated using the QST2 method. The optimised anti 1,5-hexadiene geometry 2 from earlier was used as a reactant and product molecule by numbering in the following way:
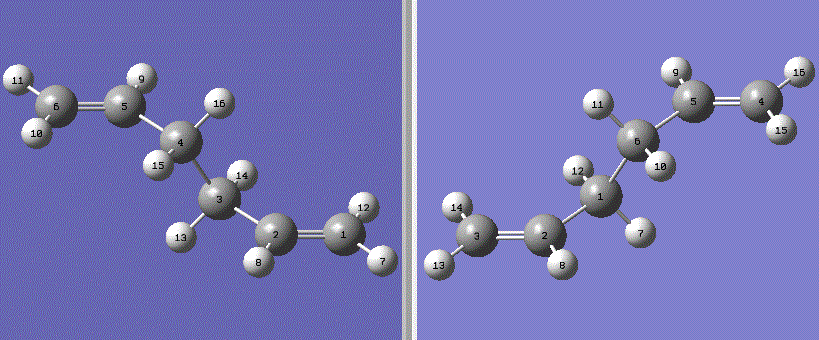
Fig. 6: reactant and product molecules for proposed rearrangement
A Gaussian calculation was set up to optimise the transion state with the following heading:
# opt=qst2 freq b3lyp/6-31g(d) geom=connectivity
Failed QST2 transition structure optimisation .chk file
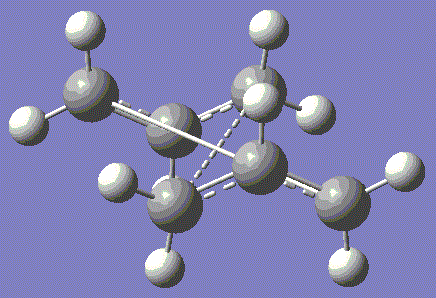
Fig. 7: failed transition structure
Gaussian has simply tried to form the new bond by simply bringing the terminal carbons together without the necessary rotation. This has resulted in the central carbon-carbon bond being eleongated to an unrealistic length. By setting the reactant and product to a more reasonable boat geometry. The central bond torsion angle was set to 0° and the C2-C3-C4 and C3-C4-C5 bond angles 100°. This brought the molecule closer to the intented boat transition state and as such the calculation is less likely to fail.
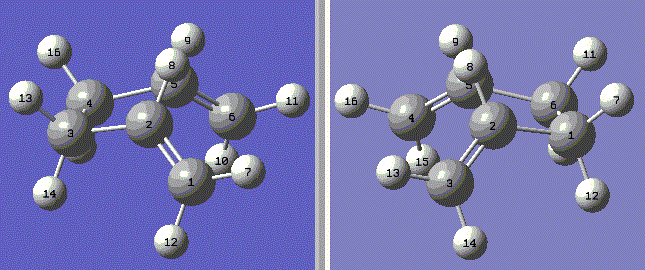
Fig. 8: reactant and product in boat structure
This new geometry was re-submitted to the QST2 optimisation and the .chk file opened.
Boat transition structure QST2 optimisation .log file
The resultant file give an imaginary vibration at -531.1cm-1 which corresponds to the transition state of a boat geometry.
Calculated imaginary frequency corresponding to the Cope rearrangement boat transition state
IRC analysis
We now have transition states for the Cope rearrangement, but which geometry will the reactions arrive at? By performing an Intrinsic Reaction Coordinate analysis, Gaussian will follow the course of the reaction by along the minimum energy pathway on the potential energy surface. The chair transition state, previously optimised by the frozen coordinate method was submitted to Gaussian with an IRC method and 50 points on the IRC.
IRC analysis of chair TS .log file
First 50 points along the chair TS IRC
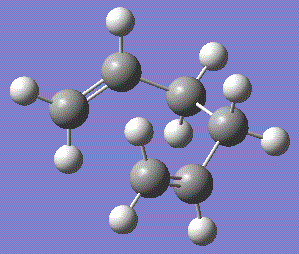
Fig. 9: Geometry after 50 points alog IRC
The above analysis bit not include enough points and so has arrived at the formation of the new bond, but little else. The final geometry was resubmitted for IRC analysis, but with 100 IRC points.
Further IRC analysis of chair TS .log file
Next 100 points along the chair TS IRC
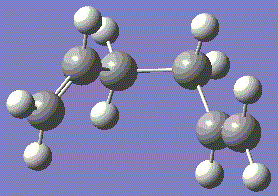
Fig. 10: Geometry after a further 100 points
 |
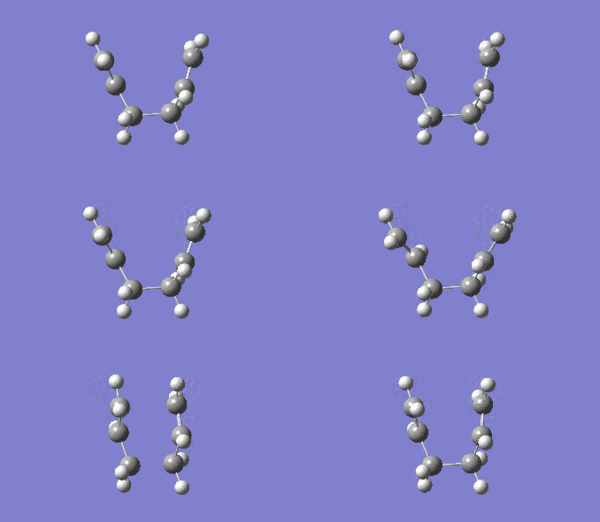 |
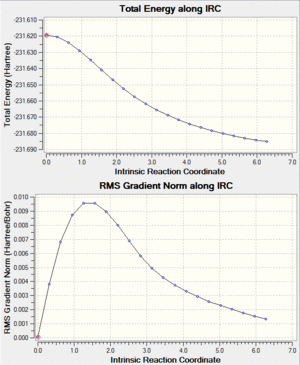
Fig. 11: First 50 and next 100 points along IRC
The above graphs show that a final energy had not reached a minimum and therefore a final geometry had still not been found. In fact, after the further 100 points, the RMS gradient appears to show fluctuation and implies a problem with the calculation would not reach a minimum. For this reason the molecule was optimised under the Hartree-Fock method to determine which geometry will be arrived at.
| File Type | .chk |
| Calculation Type | FOPT |
| Calculation Method | RHF |
| Basis Set | 3-21G |
| Final Energy / a.u. ± 3.81x10⁻³ | -231.69166702 |
| Final Energy / kJ mol-1 ± 10.0 | -608306.472 |
| RMS Gradient Norm / a.u. | 0.00000868 |
| Dipole Moment / Debye ± 0.01 | 0.3804 |
| Point Group | C2 |
| Final C=C-C-C Torsion Angle / o ± 0.1 | 123.964 |
| Final C-C-C-C Torsion Angle / o ± 0.1 | 64.165 |
Hartree-Fock optimisation of chair transition state .log file
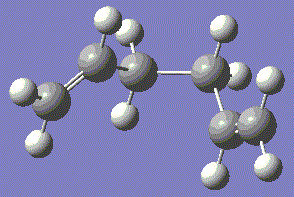
Comparing the final energy to Appendix 1 we find that it conforms to the Gauche 2 geometry. The optimisation was rerun with a more accurate B3LYP/6-31G(d) method to confirms this.
| File Type | .chk |
| Calculation Type | FOPT |
| Calculation Method | RB3LYP |
| Basis Set | 6-31G(d) |
| Final Energy / a.u. ± 3.81x10⁻³ | -234.61068500 |
| Final Energy / kJ mol-1 ± 10.0 | -615970.3535 |
| RMS Gradient Norm / a.u. | 0.00000844 |
| Dipole Moment / Debye ± 0.01 | 0.4398 |
| Point Group | C2 |
| Final C=C-C-C Torsion Angle / o ± 0.1 | 124.329 |
| Final C-C-C-C Torsion Angle / o ± 0.1 | 65.152 |
B3LYP/6-31G(d) optimisation of chair transition state .log file
Although the energies are not comparable, the torsion angles are. They confirm that the Gauche 2 geometry has been met. The fact that the RMS gradient for both methods are very low means that it is likely that a miniumum has been met. This of course is not the lowest energy conformer, but simply the first stable geometry met after the rearrangement. Given enough time and energy, the geometry would settle to a lower energy form.
Activation Energy Analysis
To determine the kinetics of the rearrangement, the activation of each transition state must be found. The original Hartree-Fock optimisation for each transition state were re-optimised using the higher B3LYP/6-31G(d) method. Then frequency analyses were run using the same method. The results file of each transition state contained information about the thermochemistry. The sum of electronic and zero point energies, Eelec + ZPE, and the sum of electronic and thermal energies, Eelec + Ethermal are the energies at 0 and 298.15K respectively. The difference in each of these between a transition state and most stable anti-2 geometry should be a good estimation of the activation energy.
| HF/3-21G | HF/3-21G | DFT-B3LYP/6-31G(d) | DFT-B3LYP/6-31G(d) | |
|---|---|---|---|---|
| Eelec + ZPE / Hartrees | Eelec + Ethermal / Hartrees | Eelec + ZPE / Hartrees | Eelec + Ethermal / Hartrees | |
| Temperature / K | 0 | 298.15 | 0 | 298.15 |
| Anti 2 Reactant | -231.539540 | -231.532565 | -234.469204 | -234.461857 |
| Chair Transition Structure | -231.466695 | -231.461336 | -234.414931 | -234.409010 |
| Eact / Hartrees | 0.072845 | 0.071229 | 0.054273 | 0.052847 |
| Eact / kJ mol-1 | 191.255 | 187.012 | 142.494 | 138.750 |
| Eact / kcal mol-1 | 45.7109 | 44.6969 | 34.0568 | 33.1620 |
| Chair transition state Hartree-Fock optimisation .log file | Chair transition state DFT optimisation .log file |
| HF/3-21G | HF/3-21G | DFT-B3LYP/6-31G(d) | DFT-B3LYP/6-31G(d) | |
|---|---|---|---|---|
| Eelec + ZPE / Hartrees | Eelec + Ethermal / Hartrees | Eelec + ZPE / Hartrees | Eelec + Ethermal / Hartrees | |
| Temperature / K | 0 | 298.15 | 0 | 298.15 |
| Anti 2 Reactant | -231.539540 | -231.532565 | -234.469204 | -234.461857 |
| Boat Transition Structure | -231.450101 | -231.444655 | -234.402339 | -234.396002 |
| Eact / Hartrees | 0.089439 | 0.087910 | 0.066865 | 0.065855 |
| Eact / kJ mol-1 | 234.822 | 230.808 | 175.554 | 172.902 |
| Eact / kcal mol-1 | 56.1238 | 55.1644 | 41.9584 | 41.3246 |
| Boat transition state Hartree-Fock optimisation .log file | Boat transition state DFT .log file |
The activation energies for all temperatures and a methods is lower for the chair transition structure. This is to be expected as it is known that the chair conformation for cyclohexane is the most stable as the bond angles are less strained. It follows that the transition structure of a six-membered ring must also be the most stable in the chair conformation. Experimental values were given in the guide of 33.5 ± 0.5 kcal/mol for the chair and 44.7 ± 2.0 kcal/mol for the boat at 0K. The calculated values are very close to these, almost falling within the uncertainty, proving this method to be a powerful prediction tool.
Diels-Alder Cycloaddition
Molecular Orbitals of Butadiene and Ethene
A molecule of cis-butadiene ethene were generated in Gaussview and optimised using the AM1 method. The checkpoint files wer opened and the HOMO and LUMO visualised.
| File Type | .chk |
| Calculation Type | FOPT |
| Calculation Method | RAM1 |
| Basis Set | ZDO |
| Final Energy / a.u. ± 3.81x10⁻³ | -0.04879734 |
| Final Energy / kJ mol-1 ± 10.0 | -128.117 |
| RMS Gradient Norm / a.u. | 0.00008900 |
| Dipole Moment / Debye ± 0.01 | 0.0414 |
| Point Group | C2v |
| Final C=C-C Bond Angle / o ± 0.1 | 125.660 |
Cis-butadiene optimisation .chk file
| File Type | .chk |
| Calculation Type | FOPT |
| Calculation Method | RAM1 |
| Basis Set | ZDO |
| Final Energy / a.u. ± 3.81x10⁻³ | 0.02619024 |
| Final Energy / kJ mol-1 ± 10.0 | 68.76248 |
| RMS Gradient Norm / a.u. | 0.00000943 |
| Dipole Moment / Debye ± 0.01 | 0.0000 |
| Point Group | C2v |
Cis-butadiene optimisation .chk file
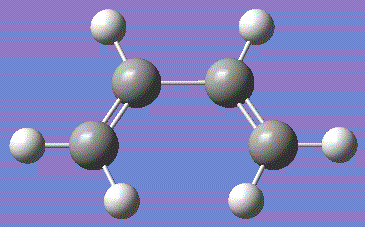
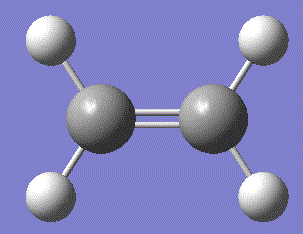
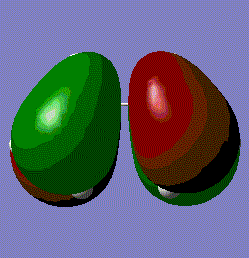
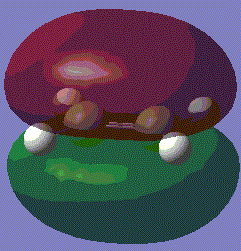
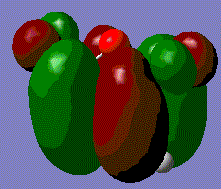
The HOMO for butadiene is composed of the π-orbitals bewteen the two sp2 carbon pairs, while the LUMO is the π*-antibonding orbitals from the same carbons. Similarly, the HOMO for ethene is the π-orbitals bewteen the two sp2 carbon pairs, while the LUMO is the π*-antibonding orbitals. The symmetry with respect to the σv plane running perpendicular to the plane of the molecule is also noted.
Computation of the Transition State geometry for the prototype reaction
The following prototype Diels-Alder reaction will be investigated first.
Fig. 14: Prototype Diels-Alder reaction

The frozen coordinate method, as used for the 1,5-hexadiene earlier, will be employed to find the geometry of the transition state. Firstly, a molecule of cis-butadiene and ethene were combined in the same window and rotated until in approximately the correct orientation. The Redundant Coord Editor was used to freeze the two terminal carbon pairs, 2 and 11, and 7 and 12 at 2.2Å. This will optimise everything but the frozen bonds. The molecules were submitted to Gaussian under the same method as above.
| File Type | .chk |
| Calculation Type | FOPT |
| Calculation Method | RAM1 |
| Basis Set | ZDO |
| Final Energy / a.u. ± 3.81x10⁻³ | -0.04879734 |
| Final Energy / kJ mol-1 ± 10.0 | -128.117 |
| RMS Gradient Norm / a.u. | 0.00008900 |
| Dipole Moment / Debye ± 0.01 | 0.0414 |
Frozen cis-butadiene and ethene .chk file
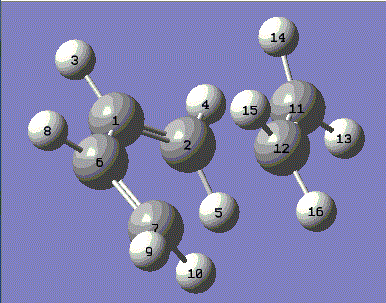
The frozen bonds will now be optimsed by using the Redundant Coord Editor. The previously frozen bonds were set to derivative and the molecule resubmitted to Gaussian for an optimiation using the previous method.
| File Type | .chk |
| Calculation Type | FOPT |
| Calculation Method | RAM1 |
| Basis Set | ZDO |
| Final Energy / a.u. ± 3.81x10⁻³ | 0.11162913 |
| Final Energy / kJ mol-1 ± 10.0 | 293.082 |
| RMS Gradient Norm / a.u. | 0.00004017 |
| Dipole Moment / Debye ± 0.01 | 0.5610 |
Unfrozen cis-butadiene and ethene .log file
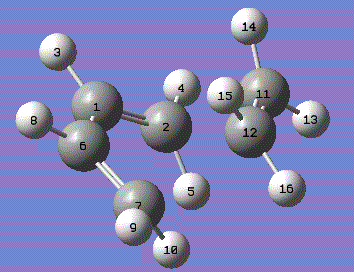
Note that the hydrogens located on the bond forming carbons are starting to lose their planarity as the sp2 hybridisation is lost. The bond lengths found by this optimisation are summarised below:
| C1-C6 | 1.39748 |
| C11-C12 | 1.38292 |
| C1-C2 and C6-C7 | 1.38187 and 1.38179 |
| C2-C11 and C7-C12 | 2.11867 and 2.11950 |
Literature[4] values for bond lengths of sp2 and sp3 carbons are 1.53 and 1.34 Å respectively. All the existing bonds in the transition state lie approximately midway between these two figures. This shows the transitional motion of the bonds. The existing double bonds are increasing towards a single bond separation. While the C1-C6 bond is shortening as the double bond forms. The forming bonds are larger than that expected for a single bond. However, considering the Van der Waals radius of a carbon atom (1.70 Å[5]) it can be seen that the separation lies below two times this radius. This shows that the carbons have come closer than what would be expected for two separate molecules and as such have entered an attractive distance. Further motion from this state will result in bond formation.
Molecular Orbitals of Prototype Reactants
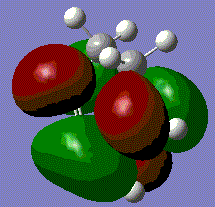
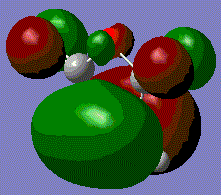
The optimised transition state from above can visualise the HOMO and LUMO.
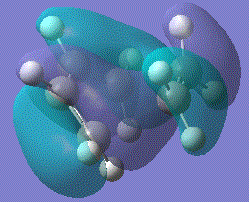
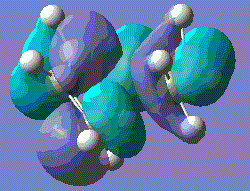
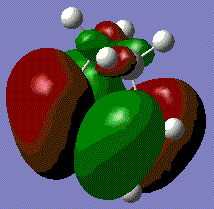
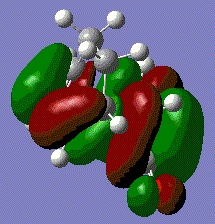
The HOMO for this prototype transition state appears show the π-orbitals of the butadiene interacting with the π* orbital of ethene. Note that both of these orbitals are asymmetric with respect to the plane described earlier, meaning that the reaction is allowed. The electron pair in one of the butadiene double bonds can transfer to the antibonding orbital of ethene. The LUMO on the other hand involves the interaction of the symmetric π-orbital of ethene and π* orbitals of butadiene. Both MOs involve a bonding and antibonding component, however, the HOMO is the lower energy of the two as the bonding orbital of butadiene will have the greater stabilisation.
Vibrational Analysis of Prototype Transition State
A frequency analysis was performed using the AM1 method.
| File Type | .chk |
| Calculation Type | FOPT |
| Calculation Method | RAM1 |
| Basis Set | ZDO |
| Final Energy / a.u. ± 3.81x10⁻³ | 0.11162913 |
| Final Energy / kJ mol-1 ± 10.0 | 293.082 |
| RMS Gradient Norm / a.u. | 0.00004017 |
| Dipole Moment / Debye ± 0.01 | 0.5610 |
Prototype Transition State vibrational calculation .log file
The final energy of the molecules is exactly the same as the previous optimisation, meaning that no change in geometry has occured. The calculation yielded an imaginary frequency of -956.1cm-1, corresponding to the transitional reaction path. The motion shows each terminal carbon pair coming together synchronously as the bonds form. This agrees with the known fact that Diels-Alder type reactions occur in concerted manner, with all the electronic transitions occuring simultaneously. The previously sp2 carbons change geometry to sp3 hybridisation. The first positive frequency involves asynchronous motion of the ethene with respect to the butadiene
Regioselectivity of Diels-Alder Addition
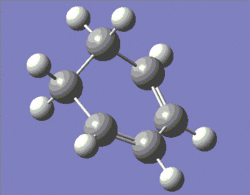
A molecule of Cyclohexa-1,3-diene and a molecule of maleic anhydride were drawn in Gaussian and optimised separtely using the Semi-empirical AM1 method.
 |
 |
Fig. 17: Cyclohexadiene and maleic anhydride
|
|
| Cyclohexa-1,3-diene optimisation .log file | Maleic Anhydride optimisation .log file |
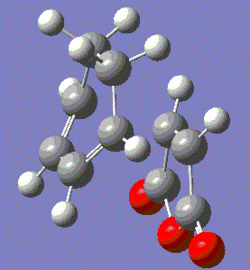
These two molecule were combined in the same window and orientated in either the endo or exo orientation. Using the frozen coordinate method, the separations between the bond forming carbons were set to 2.2Å before being sent for an optimsation under the AM1 method.
The returned molecule pairs had the coordinates unfrozen and instead set to derivative. These molecules were then sent for an optimisation to a transition state (Berny) with the additional keywords opt=noeigen.
 |
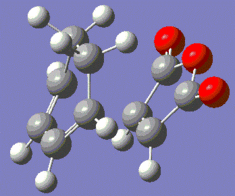 |
Fig. 18: Optimised Endo and Exo Transition States
|
|
| Cyclohexa-1,3-diene optimisation .log file | Maleic Anhydride optimisation .log file |
The forming bond length is slightly longer for the exo transition state, likely due to the fact that there will be steric clash between the oxygens and the hydrogens on the sp3 carbons.
These optimised transition states were then submitted for frequency analysis under the AM1 method.
|
|
| Cyclohexa-1,3-diene Frequency .log file | Maleic Anhydride Frequency .log file |
The transitional vibrations show the bond forming carbons coming together as expected, as well as the related carbons moving from sp2 to sp3 hybridisation.
The vibrational analysis can also be used to confirm that a true minimum has been found. The .log files give the low frequencies for each transition state.
Endo low frequencies: -805.9624, -2.8109, -0.6633, -0.3087, -0.0104, 1.1815 Exo low frequencies: -813.1101, -8.1603, -4.7740, -2.8905, -0.0049, 0.0911
Apart from the expected imaginary frequency corresponding to transitional motion, the remaining low frequencies are all above -10 and so, even considering the low level optimisation run, a true minimum has been found. The constrained geometry of each molecule should preclude any major deviations from the ideal geometry.
MO analysis of Cyclohexa-1,3-diene and Maleic Anhydride Transition State
The checkpoint files from the previous frozen coordinate optimisation were opened. From here the HOMO and LUMO can be visualised.
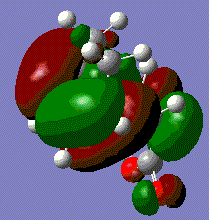
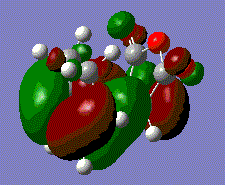
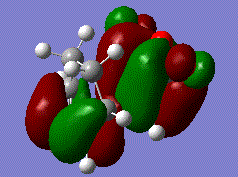
The transition state orbitals do not follow the pattern found for the prototype reaction. Both the HOMO and LUMO involve the π-bonding orbital of cyclohexadiene and the π-antibonding orbital of maleic anhydride. All the MOs are asymmetric because of this. The LUMO simply involves the same orbitals but out of phase. The likely reason for this is that the electronegativity of the oxygens on maleic anhydride make its HOMO too low in energy to interact with the LUMO of cyclohexadiene. It can be seen that the Endo HOMO is slightly lower in energy. This fits with the Endo rule which predicts that Endo transition states are lower energy meaning that the Endo product will be the dominant product. The likely reason for this lower energy is the avoidance of steric clash between the various oxygens and the hydrogens on the sp3 bridging carbons. The second eason for the lower energy is secondary orbital overlap. This results from the favourable interaction between orbitals not directly involved in bonding. For this example, this would be the p orbitals on the sp2 carbons on cyclohexadiene adjacent to the bonding carbons, and the p-orbitals on the carbonyl carbons for maleic anhydride. Due to the asymmetry shown earlier, these orbitals will be in the same phase and so can interact and lower the energy. However, it is only the Endo transition state that brings the relevant orbitals into close proximity. This overlap is not clear in the images as the computation first combines the the π* and carbonyl carbon p-orbitals in maleic anhydride, then mixes these with the π-orbitals on cyclohexadiene in the transition state. This obscures the individual orbitals involved. However, the large size of the combined orbitals for the HOMO of the transition state shows that there is a lot of favourable interaction.
Conclusion
Computational methods have shown to be an accurate method in predicting transition structure, especially the concerted nature of the reactions as shown above. By analysing the properties of the transition states, information about which might be the kinetic product as well as its geometry, vibrations and relative energy can be found. Of course, the calculation is limited in the respect that it only considers one molecule existing in vacuum. In real reactions, interactions between other species and solvents will affect the outcome. However, this does not detract from the fact that accurate predictions can be made about reactions before adjustments are made to account for other factors.
- ↑ Gyorgy Schultz and Istvan Hargittai, J. Mol. Struct., 1995, Vol. 346, pp. 63-69|
- ↑ Brandon G. Rocque, Jason M. Gonzales and Henry F. Schaefer III, Mol. Physics, 2002, Vol. 100, No 4, pp. 441-446
- ↑ 3.0 3.1 A. K. Mal'tsev, V. A. Korolev, and O. M. Nefedov, Bulletin of the Academy of Sciences of the USSR, Division of Chemical Science (English Translation), 1984, vol. 33, 1-2, pp.510-521
- ↑ CRC Handbook of chemistry and physics, 2005, 86th edition, pp. 9-19
- ↑ Bondi, A, "Van der Waals Volumes and Radii", J. Phys. Chem., 1964, 68 (3), pp. 441–51


