Rep:Mod3:david90
Module 3
David Freeman
The Cope Rearrangement Tutorial
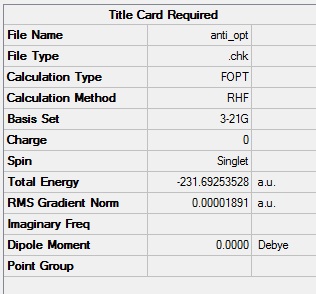
A molecule of 1,5-hexadiene was drawn in Gaussview with the central four carbons in an "anti" formation (that is the large C2H3 are antiperiplaner to each other as shown in the diagram) and the structure optimised using a Hartree-Fock method with a 3-21G basis set. A jmol of the optimised structure is shown below.
The summery shows that the energy is -231.69253528 a.u. A.u. are atomic units, this doesn't tell us any thermodynamic information about the molecule but does allow us to compare different conformations of the molecule. In this way the most stable configuration may be predicted which will be the configuration that is most probable in a real system. This can in turn lead to inferences about the way in which the molecule reacts and even what affects the reaction coefficient.
Gaussview can tell us the symmetry of any optimised molecule, in this case our molecule has Ci symmetry.
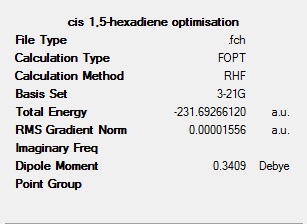
Another molecule of 1,5-hexadiene was then drawn with the central 4 carbons in a gauche formation, a jmol is again shown with the summery.
The symmetry for this molecule is C1. The energy is slightly lower than that of the anti rotomer at -231.69266120a.u., this may be due to 1,3 hydrogen interactions (gecko effect). This means this conformer is more stable. Note that this comparison is only applicable because the same method and basis set were used.
Looking at appendix 1 the structures that I have optimised correspond to the anti2 and gauche3. Note that the gauche structure seems to be the mirror image of the diagram in appendix 1 but that this is in fact the same molecule since there are no chiral centres.
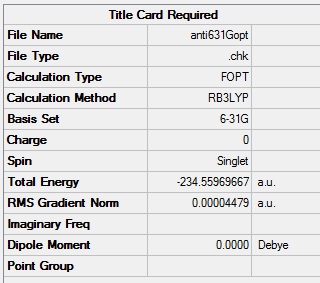
Since the C1 anti2 configuration has already been optimised there is no need to redraw this structure for use in the subsequent calculations. The energy of the calculated molecule is -231.69254 a.u. to 4 decimal places which agrees exactly with the value in the table, indicating this is indeed the molecule that has been optimised. This structure was then optimised again using the B3LYP/6-31G level which is a better method and basis set so will give more accurate results.
The overall structure changes very little so hasn't been included. The angle between the second third and fourth carbon atoms has slightly increased in the 6-31G form (111.35o in the 3-21G and 112.65o in the 6-31G)but this is not a large change. It is surprising that the bond angle has in creased further from the optimum 109.5o for tetrahedral complexes, this may be due to favourable 1,3 hydrogen interactions (gecko effect) but looking at the distances between hydrogens reveals that this doesn't change (2.67Å in both complexes for the interaction between the hydrogens on carbons 2 and 4 and 2.45Å / 2.47Å for the two complexes respectivly for the hydrogens on carbons 1 and 3) indicating there must be some other reason. The energy however has gone down which shows that the higher level optimisation has given a more realistic structure.
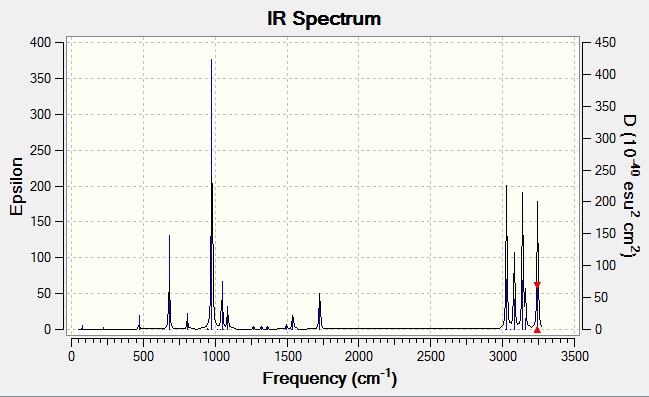
A frequency analysis was performed using the B3LYP/6-31G optimised anti structure. This calculates the vibrations of the molecule and can predict the IR spectrum.
There are some interesting points about this spectrum, looking through the vibrations on Gaussview we are able to see exactly which vibration caused which peak. The peaks above ~3000cm-1 are all various C-H stretches so are not very interesting but looking at some of the bends shows that some vibrations have an intensity of 0 while some that look very similar and indeed have similar frequencies have large intensities. For example the peak at 977.45cm-1 has an intensity of 19.5 and corresponds to the bends of the hydrogens on the methalyene group, however there is also a vibration at 975.42cm-1 that also corresponds to the bends of hydrogens on the methalyene group but has an intensity of 0. What makes these vibrations different is that in the 977.45cm-1 vibration the hydrogens all vibrate the same way whereas in the 975.42cm-1 vibration they vibrate in opposite ways. This has the effect of the 977.45cm-1 vibration having a dipole that changes as the molecule vibrates but the 1724cm-1 (being overall symmetric) not having a dipole. Since this is what gives rise to the peaks on an IR spectrum, any symmetric vibration will have a frequency of 0 and will therefore not appear. This also occurs at the C=C stretching peak at 1728.04cm-1 which is seen because this vibration is antisymmetric, the symmetric analogue at 1724.51cm-1 is not seen.
Looking in the log file four values for the energy of the system with various corrections.
Sum of electronic and zero-point Energies= -234.416252
Sum of electronic and thermal Energies= -234.408952
Sum of electronic and thermal Enthalpies= -234.408008
Sum of electronic and thermal Free Energies= -234.447896
The first is simply the value of the potential energy at 0K with the ground state vibrational energy (zero point energy) included (E1 = Eelec + ZPE). The second is the potential energy at 298.15K and 1atm and so includes translational, rotational and vibrational energies (E2 = E1 + Evib + Erot + Etrans), the third goes a step further and includes a correction for RT (H = E2 + RT) and the fourth is the Gibbs free energy and takes into account entropic contributions (G = H - TS).
Optimising the "Chair" and "Boat" Transition Structures
The Cope rearrangement has two possible transition structures; the chair and the boat. The transition structures will be drawn in Gaussview and then optimised by either computing the force constants at the beginning of the calculation, using the redundant coordinate editor or using QST2.
First an allyl C3H5 fragment was drawn and optimised at the HF/3-21G level which was then copied and pasted twice into the same window. The two fragments were then positioned 2.2Å apart in roughly the chair conformation.
The jmol shown below is a Opt+Freq calculation at the HF/3-21G level of this structure. Optimise to a minimum was changed to optimise to a TS (Berny), this means the calulation will run to a transition state (maximum) rather than a minimum. The force constants were calculated once and the additional keywords contained Opt=NoEigen which tells the programme to stop calculating if more than one imaginary frequency is detected. The calculation ran successfully. It shows local double bonds but this is just a result of the file and actually the bond is delocalised for each allyl fragment.
The distance between the carbon atoms involved in forming the new bond was found to be 2.01975Å, slightly less than the distance quoted in the instructions of 2.2Å but still fairly similar. There was one imaginary frequency at -818.04cm-1 which when animated corresponded to the bonding carbons moving towards each other, showing that these bonds are breaking and forming (Cope rearrangement).
The transition structure was then optimised again using the frozen coordinate method. This was done by copying the optimised guess structure into a new window and freezing the terminal bonds (forming in the rearrangement). The bonds were frozen using the reactant coordinate editor in the edit menu, creating a new coordinate and selecting "bond" and "freeze coordinate" for each of the two bonds. The optimisation was then set up as if it were a minimum and the job submitted.
The checkpoint file was then opened, so that the frozen bonds could be optimised. The reactant coordinate editor was again used, this time selecting "derivative" rather than "freeze coordinate". The calculation was then submitted as a transition state optimisation (by selecting TS Berny) and the optimised checkpoint file recovered. This showed a molecule that was very similar to the TS (Berny) optimisation which is to be expected as the two methods shouldn't give different results. There was again an imaginary frequency at -818cm-1 which corresponded to the bond forming and breaking between the terminal carbons and the energies were exactly the same to 4dp (-231.6189 a.u).
The boat transition structure was optimised using the QST2 method which differs to the previous methods in that the reactant and product are both defined for a reaction and the calculation will interpolate between the two structures and find an energy maximum which corresponds to a transition state. To do this each atom in the reactant and product must be labelled so that Gaussian knows which atoms change, a picture showing how the atoms were labelled is shown below.
The atoms were labelled as in the diagram above but this gave a false result in which the two allyl fragments were twisted and were roughly in the chair conformation. This was clearly the wrong result so the original gjf file was opened and both the reactant and product changed by rotating the dihedral angles of the middle C-C bonds from 180o to 0o and the inside C-C-C bond angles reduced to 100o. This produced molecules that looked more like the transition state we were trying to optimise. The calculation was run again, this time with successful results. A jmol of the optimised boat transition state is shown below.
Again the mol file has shown the bonds in a different manner to what is actually occurring, it would be more accurate if the bonds between the two allyl fragments were dashed and the double bonds were also dashed to show the forming and breaking bonds. This doesn't really matter so long as we remember that the bonds in the jmol don't show exactly what's happening but rather just show the structure of the transition state as a whole.
The Intrinisic Reaction Coordinate (IRC)
To predict which product the transition states calculated above will lead to, the intrinsic reaction coordinate method can be used to follow the reaction path to a minimum and find the predicted product. The programme runs down the potential energy curve in either direction from the transition state maximum until the gradient is close to 0 and a minimum has been found. This minimum will be the reactant if the IRC is run backwards or the product if run forwards. In this case the reactant and product are the same (the potential energy curve will therefore be symmetrical) so only the forward direction will be considered.
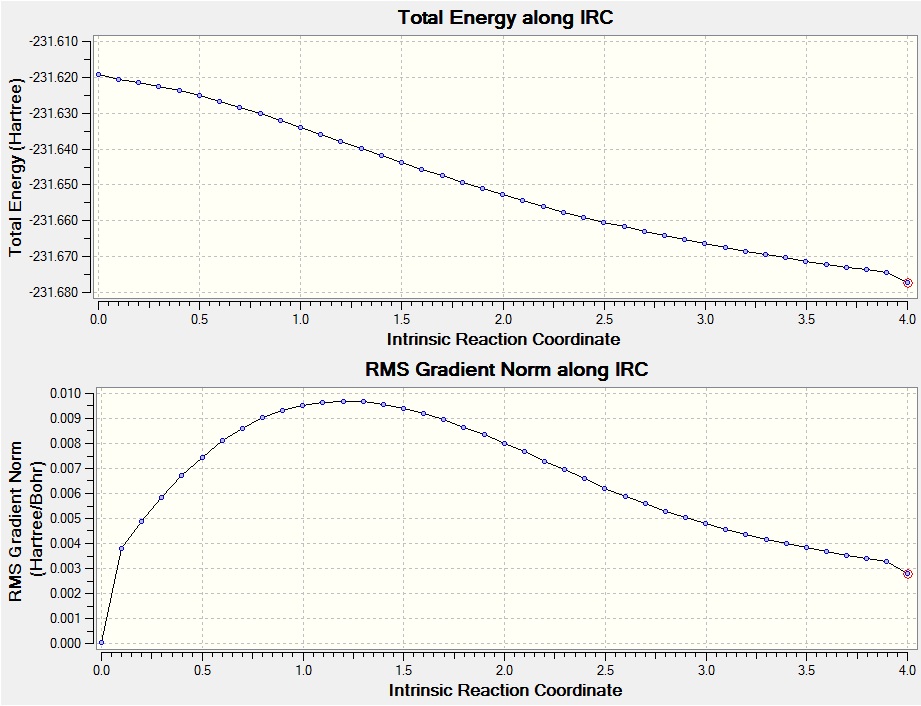
The checkpoint file of the HF/3-21G optimised chair transition state was loaded and an IRC calculation run. Initially the force constants were calculated only at the start of the calculation with the maximum number of points along the IRC set to 50. This failed to reach a minimum as can be seen in the graphs below.
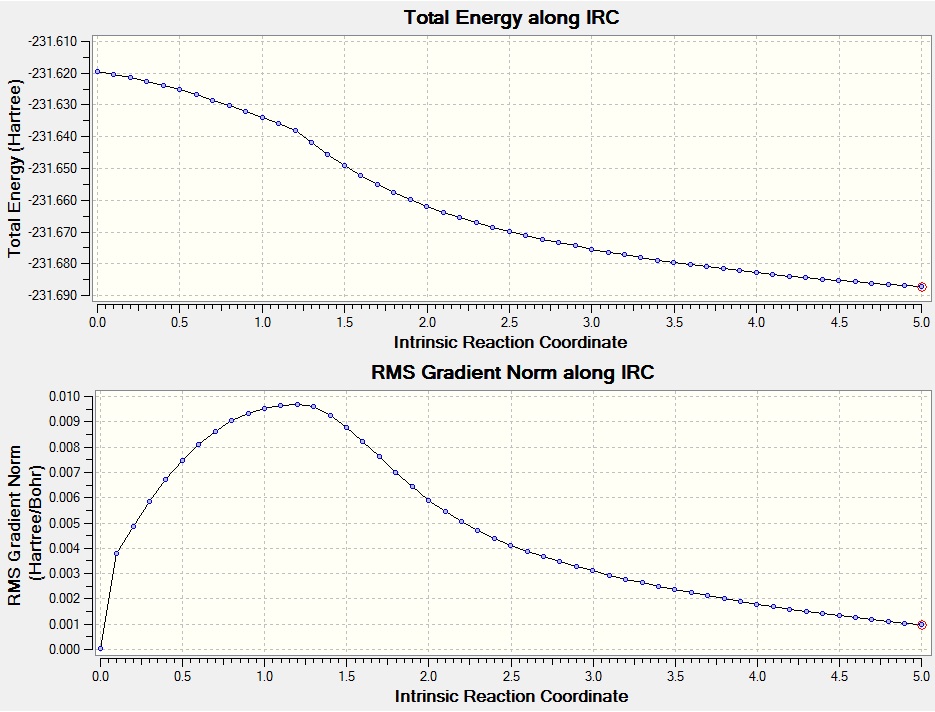
The gradient graph shows the calculation has failed to reach a minimum. To rectify this the same calculation was submitted but this time the force constants were calculated at every step. This took more time (27 minutes as opposed to 17 minutes for the calculation with once calculated force constants) but gave the minimized structure shown below. The graphs confirm that although the calculation has not fully reached a minimum, it is much closer.
The point group of the optimized product is C2. From visual inspection and comparison with appendix 1 is can be seen that this conformer is gauche2. The calculated energy was -231.68719 a.u., not entirely in agreement with the -231.69167 a.u. quoted in appendix 1 but fairly close. The differences may be due to the fact that the product has not fully optimised and if the calculation didn't take so long it would be re-run with a higher number of maximum points along the IRC to give the calculation more time.
The boat transition state was then run in the same way as the second chair calculation (with the force constants calculated at every step). This calculation failed after 19 steps however the final structure did seem to be going towards the gauche3 product as one of the bonds had shortened to 1.9 angstroms while the other lengthened to 2.5 with the rough gauche3 structure. This however does not mean much as the calculation didn't go to a minimum but rather went away. To get a successful calculation a better starting point is needed but because this would take a considerable amount of time this has not been done.
Activation Energy Calculations
To find the activation energy of both transition states we simply need to find the difference between the energy of the transition state and the reactant. The reactant is the anti2 conformer and the transition state is either the chair or boat conformer. Knowing this we can look in the log file and find the thermochemical data, then take the sum of the electronic and zero point energies for both the reactant and transition state and use them to find the activation energy at 0K. It is also possible to use the sum of electronic and thermal energies which would give a more accurate result for the activation energy but this has not been done since it does not show any additional skills and is simply more calculation and since we are not trying to actually find the activation energy but are comparing basis sets this extra calculation will not show us much. The results are summarised for both basis sets in the tables below.
| Electronic Energy (Total Energy) | Sum of Electric and Zero Point Energies | Activation Energy/Hartree | Activation Energy/kcalmol-1 | Experimental Activation Energy/kcalmol-1 | |
| Anti2 reactant | -231.69253528 | -231.539539 | - | - | - |
| Chair TS | -231.61932200 | -231.466692 | 0.072847 | 45.712148 | 33.5 ± 0.5 |
| Boat TS | -231.60280221 | -231.450932 | 0.88607 | 55.601690 | 44.7 ± 2.0 |
| Electronic Energy (Total Energy) | Sum of Electric and Zero Point Energies | Activation Energy/Hartree | Activation Energy/kcalmol-1 | Experimental Activation Energy/kcalmol-1 | |
| Anti2 reactant | -234.55970424 | -234.469203 | - | - | - |
| Chair TS | -234.55698263 | -234.414928 | 0.054275 | 34.434556 | 33.5 ± 0.5 |
| Boat TS | -234.54309304 | -234.402339 | 0.066864 | 41.957761 | 44.7 ± 2.0 |
It is clear that the more complicated basis set gives a much better fit to the experimental data, even though the structures look almost identical the energies obtained from the 6-31G optimisation are much more accurate.
The Diels Alder Cycloaddition
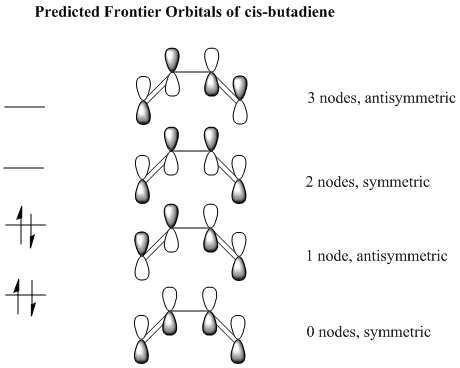
Cis butadiene was drawn and optimised using Gaussview so that the HOMO and LUMO may be plotted. The p orbitals are the atomic orbitals that make up the frontier orbitals in butadiene so these are what we will consider. We will look at the symmetry of the HOMO and LUMO of cis bitadiene as well as ethylene to see which can react with each other, only symmetric orbitals can interact with symmetric orbitals and antisymmetric orbitals with antisymmetric orbitals. An orbital is considered symmetric if it has a plane of symmetry down the central bond of the butadiene molecule. There are 4 ways in which the p orbitals of the substituent carbon atoms may be arranged, they are shown below. Note the the number of nodes refers only to the nodes between p orbitals, obviously there is also one more nodal plane in each MO along the plane of the molecule through the middle of the p orbitals.
These are the 4 combinations of p atomic orbitals that are predicted to be the frontier orbitals of cis butadiene. The calculated MOs are shown below. Note that the lowest predicted symmetric orbital is the HOMO-2 and not the HOMO-1 as predicted, this just means there is a higher energy orbital than the totally bonding p orbital combination.
HOMO-2, 0 nodes, symmetric 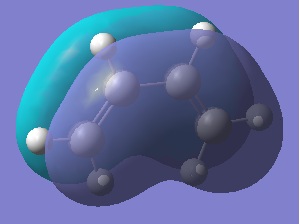 HOMO, 1 node, antisymmetric
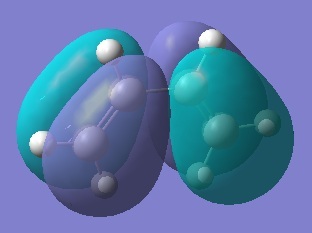
LUMO, 2 nodes, symmetric 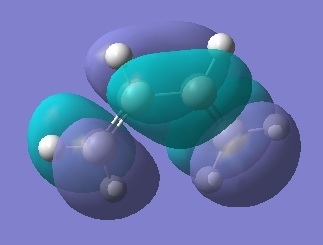 LUMO+1, 3 nodes, antisymmetric
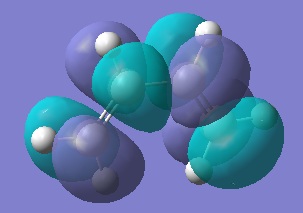
The MOs show that the predicted frontier orbitals were good, and also enable us to see which orbitals will react with ethylene by looking at the symmetry.
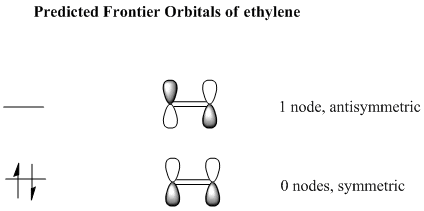
The ethylene p MOs are shown below.
HOMO, 0 nodes, symmetric 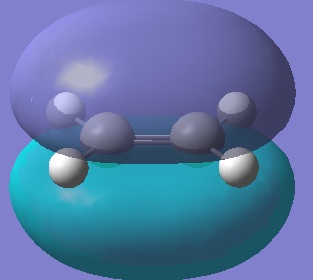 LUMO, 1 node, antisymmetric
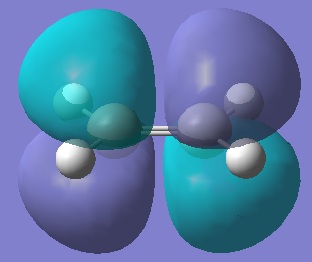
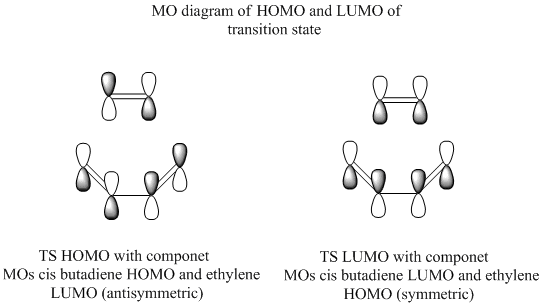
From this we can see that either the LUMO of cis butadiene could react with the HOMO of ethylene (symmetric orbitals) or the HOMO of cis butadiene could react with the LUMO of ethylene (antisymmetric orbitals). To see which way round the reaction actually is the transition state was optimised and the MOs of this analysed. The semi-emperical/AM1 optimised forms of cis butadiene ans ethylene were placed 2.2Å apart and the TS (berny) method with the force constants computed at the start of the optimisation was used to optimise the transition state.
This failed to give a transition structure, probably because the starting geometry was too far from the actual structure. The frozen coordinate method was then used instead which succeeded. A jmol of the optimised transition state is shown below.
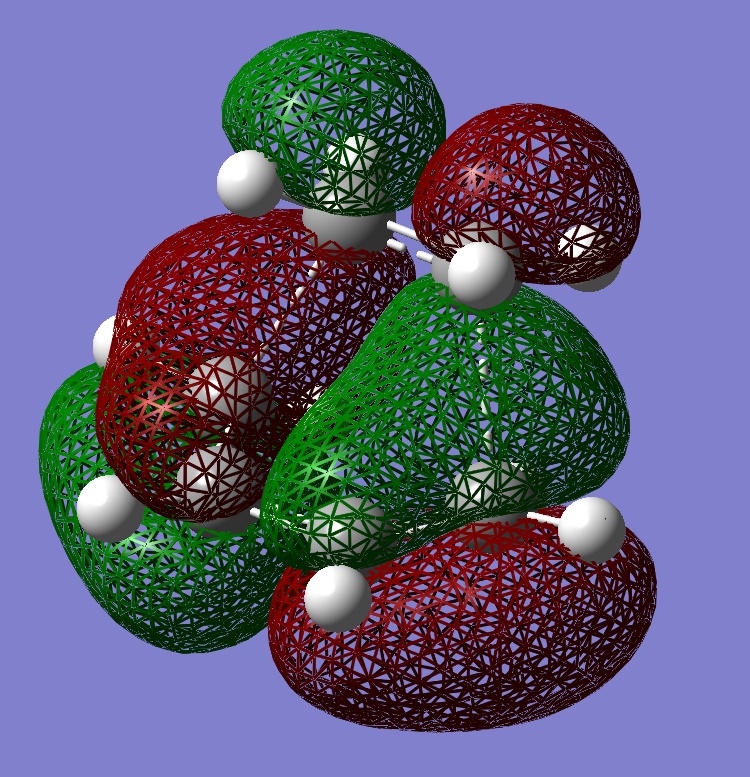
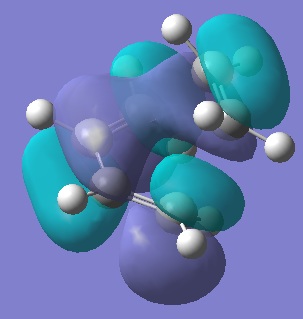
The bond lengths between terminal carbons were 2.11961Å. The HOMO can show which of the two combinations have formed the bonding orbital, in this case it is clear that the HOMO of cis butadiene has formed a new bonding molecular orbital with the LUMO of ethylene. The LUMO has also been shown simply to show that the other interaction is indeed higher in energy and as such the antisymmetric orbitals are the ones that react.
Reaction of 1,3 butadiene with maleic anhydride
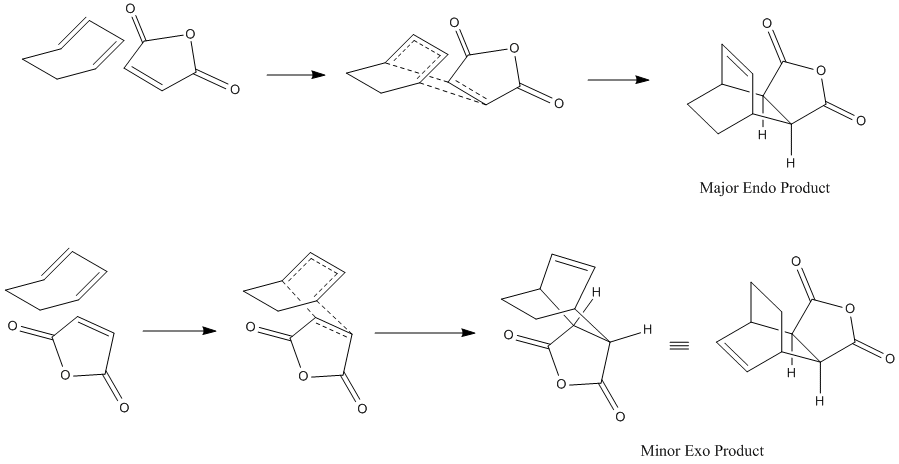
1,3 butadiene reacts with maleic anhydride in a [4+2] cycloaddition (Diels Alder) reaction to give primarily the kinetic endo product as seen in the reaction scheme below.
To find out why this reaction is kinetically controlled we can look at the transition states of both products, in theory the endo transition state should be lower in energy so that this will form more easily and thus give the endo product. Both transition states were obtained via the frozen coordinates method using the semi-empirical/AM1 level of theory which gave the structures shown below.
Endo
Exo
The energies for the two structures were -0.05131315a.u. for the endo form and -0.05028703a.u. for the exo form. This is as expected as the endo transition state is indeed lower in energy. The two imaginary frequencies were -812cm-1 and -816cm-1 respectively and corresponded to the asymmetric formation and breaking of the new C-C bonds. This indicates the correct structures have been found.
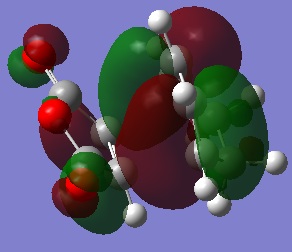
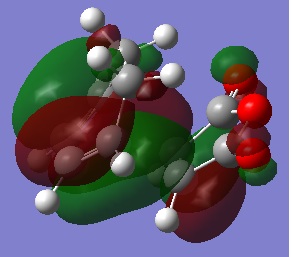
The HOMOs of the two transition states were calculated to see where the electron density is and if there will be any steric repulsions to consider in either transition state.
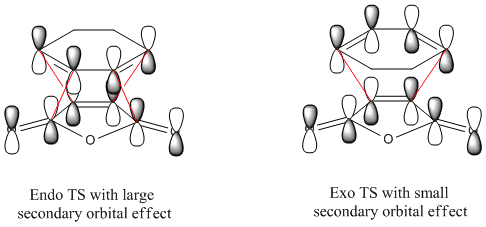
The HOMOs don't seem to show much reason for the endo form to be more stable, to explain it's stability we must consider the secondary orbital effect. This effect occurs in the endo form because the two fragments are orientated in such a way that allows the C=O orbitals to "guide" the formation of the new C-C bonds by interacting with appropriate orbitals on the diene. The diagram below shows how the endo form is stabilised by this effect while the exo form has no such stability.
It is because of the secondary orbital effect that the endo transition state is stabalised more than the exo and so is also the reason the endo form is the kinetic product. Looking again at the HOMOs with this in mind reveals that this effect is much more likely to happen in the endo form where the carbonyl carbons are much closer to the double bonds of the diene.
The activation energies of the two transition states were calculated in the same way as before, apart from this time since there are two reactants the energies of both had to be added together. Both the reactants as well as the two transistion states were re optimised using B3LYP/6-31G so that a more accurate result may be obtained. The table below summarises these results, note that again the energies at 0K have been used.
| Sum of Electric and Zero Point Energies | Activation Energy/Hartree | Activation Energy/kcalmol-1 | |
| Cyclohex-1,3-diene | -233.41892372 | - | - |
| Maleic Anhydride | -379.28954454 | - | - |
| Reactant Total | -612.7084683 | - | - |
| Endo TS | -612.502142 | 0.20632626 | 129.4715851 |
| Exo TS | -612.498014 | 0.21045426 | 132.0619422 |
This shows numerically that the energy barrier through the endo transition state is smaller. This means the endo reaction will go faster and result in the kinetic product being the endo form.

