Rep:Mod3:YJY1234
mod 3
The Cope Rearrangement Tutorial
Optimizing the reactants and products
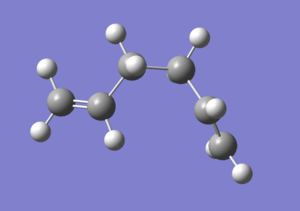
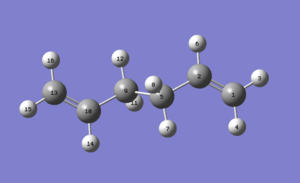
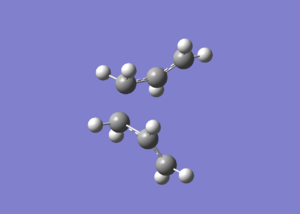
The "anti" and "gauche" conformation of 1,5-hexadiene is optimized at the HF/3-21G level of theory.
The gauche conformation is expected to have a higher energy then the anti structure, as the eclipsing large groups are close to each other and results in steric clash which raises the energy. The calculation shows that the gauche conformation is indeed higher in energy by 2.64 kJ/mol.
Graph 1 - the structure of the gauche 1,5-hexadiene in Newman projection
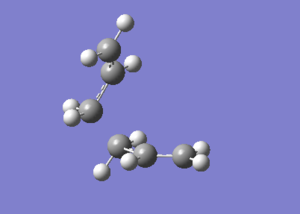
We can see that the structure in graph 1 can be further optimized by adjusting the positions of the two H2C=C groups to lower their steric clash. A new gauche conformer is drawn and optimized using HF/3-21G.
Graph 2 - Predicted lowest energy gauche conformation of 1,5-hexadiene
The energy after optimization for the structure in graph 2 is -231.69266120 a.u., which is -608309.082 kJ mol-1. This is more stable than the structure in graph 2 by 2.97 kJ mol-1. The point group of the new structure is C1.
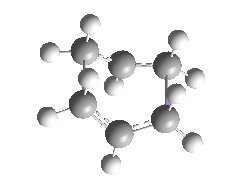
Comparing the optimized structure with the structures in Appendix 1, the first optimized gauche structure (as shown in graph 2) corresponds to the gauche 2 structure. The second optimized gauche structure (as shown in graph 3 and 4) corresponds to the gauche 3 structure.
The Ci anti2 conformation of 1,5-hexadiene was optimized at HF/3-21G level of theory in the section above. It is now optimized again using DFT-B3LYP/6-31G(d) level of theory. The energies and geometries of the two structures are compared in table 2.
Reoptimization of the anti2 conformation of 1,5-hexadiene at the DFT-B3LYP/6-31G(d) level of theory results in no major change in geometry. The bond lengths are very similar (however in general, the reoptimized structure has slightly longer bond lengths). The dihedral angles are all very similar as well, although in general, the reoptimized structure has slightly larger dihedral angles.
Vibrational frequency analysis
Frequency analysis shows that the optimized structure has no imaginary vibrations, only real ones. This conforms that the optimum structure was a minimum.
Graph 4 - the IR spectrum of Ci 'anti2 conformation of 1, 5-hexadiene
| Sum of electronic and zero-point energies/a.u. | -234.469212 |
|---|---|
| Sum of electronic and thermal energies/a.u. | -234.461856 |
| Sum of electronic and thermal enthalpies/a.u. | -234.460912 |
| Sum of electronic and thermal Free Energies/a.u. | -234.500821 |
Optimizing the "chair" and "boat" transition structures
Optimizaing the chair transition structure
Firstly, an allyl fragment (CH2CHCH2) was drawn and optimized using the HF/3-21G level of theory. The optimized allyl fragment was pasted twice and oriented into a structure that mimics the chair transition structure .
Graph 5 - the orientation of two allyl fragments to mimic the chair transition structure
The transition state was then manually optimized using two methods. The first method is to use Hartree Fock and the default basis set 3-21G . The second method is the frozen coordinate method.
Using Hartree Fock and basis set 3-21G
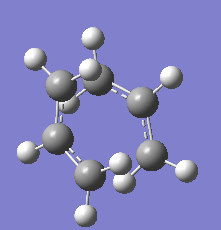
Graph 6 - the structure of the transition structure optimized using Hartree Fock and basis set 3-21G
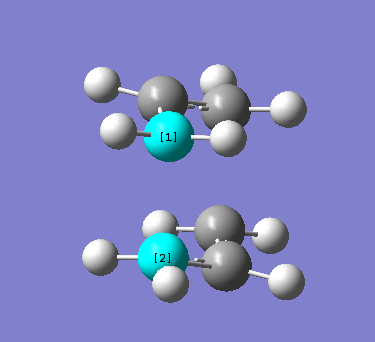
The distance between atom [1] and [2] is 2.20Å. Frequency calculation of the optimized structure gave an imaginary frequency of magnitude -817.97 cm-1, which confirms that the transition state was successfully optimized. The movie for the vibration is recorded and can be accessed here.
Using the frozen coordinate method
The transition structure is optimized again using the frozen coordinate method. The distances between the two terminal carbons on both sides of the transition structure was 'frozen', and then optimized. After the first optimization, the four terminal carbons were 'unfrozen', and the structure was optimized again.
The final optimized structure is the same as the structure optimized using Hartree Fock and 3-21G in graph 6, with the distance between the terminal carbons of the two allyl fragments 2.02A. This suggests that both methods are equally accurate for the boat transition structure.
Optimizing the boat transition structure
The boat transition structure is optimized using the QST2 method, which specifies the reactants and products for a reaction in attempt to calculate the transition state. The DFT-B3LYP/6-31G(d) optmized anti2 1,5-hexadiene structure was duplicated, labelled and oriented so that they mimic the reactant and product. Then, the first QST2 calculation was run, but this job failed as the starting structures differed too much from the transition state. Therefore, the structure of the starting structures were modified so that they are closer to the boat transition state structure.
Graph 7 - the modified starting structures
The QST2 calculation was started again. This time, the transition state structure was successfully located.
Graph 8 - the boat transition state structure located using the QST2 method
The IRC calculation
Looking at this transition structure, as well as the structure for the chair transition state, it is impossible to predict which conformer will form. However, another method called the Intrinsic Coordinate (IRC) Method allows us to follow the minimum energy path from a transition structure down to its local minimum on a potential energy surface.
To find out the minimum energy path of the reaction, the IRC calculation was run for the chair transition state structure. However, after the calculation, the minimum geometry was not reached yet. The energy of the final structure is -231.68049221 a.u..
To continue minimizing in attempt to reach the minimum geometry, the last point on the IRC was taken to run a minimum minimization using the HF/3-21G level of theory.
Graph 9 - the final structure of the geometry optimization
The energy of this structure is -231.69166702 a.u., which is slightly lower than the starting structure. However, this is still not the minimum geometry.
Another attempt to obtain the minimimum geometry was to redo the IRC, specifying that force constants should be calculated at every step. After redoing the IRC, the geometry minimum was obtained.
Graph 10 - the final structure after redoing the IRC
The energy of this structure is -231.79116428 a.u.. The RMS gradient norm for the calculation is 0.00001145 a.u., which is less than 0.001 a.u., showing that the optimization is converged.
The first approach was much faster than the second approach, but as the starting structure was not close to the minimum structure to begin with, it was not able to locate the minimum structure. The second approach was more time-consuming, but it successfully calculated the minimum structure.
Activation energies
In this section, the activation energies for the reaction via both transition structures were calculated. Firstly, the chair and boat transition structure were reoptimized using the B3LYP/6-31G* level of theory and frequency calculations were carried out.The structures and energies of the optimized structures are compared with the geometry optimized using HF/3-21G level of theory.
The two structures are similar, but the energy optimized using B3LYP/6-31G* level of theory is 7730 kJ mol-1 lower.
The two structures are similar, but the energy optimized using B3LYP/6-31G* level of theory is 7857 kJ mol-1 lower.
The imaginary frequency of the reoptimized boat transition structure is -532 cm -1, while the imaginary frequency of the reoptimized chair structure is -567 cm-1.
| HF/3-21G | B3LYP/6-31G* | |||||
|---|---|---|---|---|---|---|
| Electronic energy/a.u. | Sum of electronic and zero-point energies at 0K/a.u. | Sum of electronic and thermal energies at 298.15K/a.u. | Electronic energy/a.u. | Sum of electronic and zero-point energies at 0K/a.u. | Sum of electronic and thermal energies at 298.15K/a.u. | |
| Chair Transition State | -231.680492 | -231.527869 | -231.522510 | -234.563120 | -234.421066 | -234.415145 |
| Boat Transition State | -231.670907 | -231.519026 | -231.510941 | -234.663454 | -234.522703 | -234.516360 |
| Reactant (anti2) | -231.592535 | -231.599506 | -231.752501 | -234.611702 | -234.49195 | -234.461849 |
The Diels Alder cycloaddition
Optimization and MO analysis of cis butadiene
The optimization of cis butadiene is carried out using GaussView 5.0.9. The AM1 semi-empirical molecular orbital method was used for the calculation.
| File type | .log |
|---|---|
| Calculation type | FOPT |
| Calculation method | RAM1 |
| Basis Set | ZDO |
| Charge | 0 |
| Spin | Singlet |
| E(RAM1)/a.u. | 0.04879719 |
| RMS Gradient Norm/a.u. | 0.00001745 |
| Dipole moment/ Debye | 0.0414 |
| Job CPU time | 6.0 s |
We can see that the optimization is converged, as the final RMS gradient is less than 0.001.
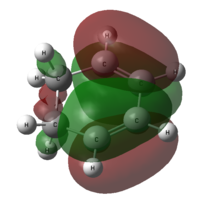
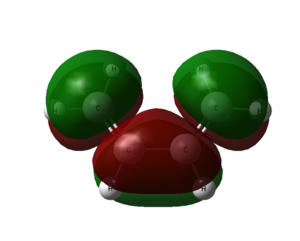
From the output checkpoint file of the optimization, we can visualize the molecular orbitals of cis butadiene. The HOMO and LUMO of the molecule are captured.
| HOMO | LUMO | |
|---|---|---|
| cis butadiene | 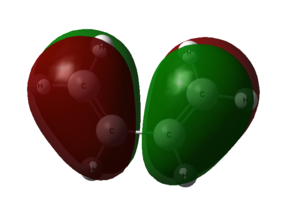 |
|
| Symmetry with respect to molecular plane | Antisymmetric | Symmetric |
Computation of the transition state geometry for the prototype reaction and an examination of the nature of the reaction path
Optimization of the transition state
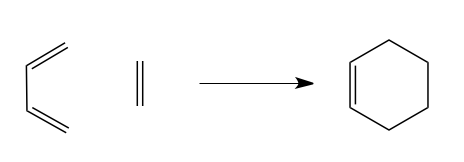
In this section, the transition state geometry for the following reaction is studied. An initial guess of the transition state structure is drawn in GaussView and optimized in a three step process.
Graph 11 - the prototype reaction
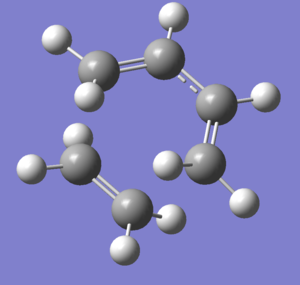
Graph 12 - an initial guess of the transition state structure of the prototype reaction
The transition state structure proposed is first optimized using the freeze coordinate method. The distance between carbon atom 7 and 14, as well as 1 and 11, is fixed to 2.1Å using the redundant coord editor in GaussView. The AM1 semi-empirical molecular orbital method was used for the calculation.
| File type | .log |
|---|---|
| Calculation Type | FOPT |
| Calculation method | RAM1 |
| Basis Set | ZDO |
| Charge | 0 |
| Spin | Singlet |
| E (RAM1)/a.u. | 0.11123824 |
| RMS Gradient Norm/ a.u. | 0.00342233 |
| Dipole Moment/ Debye | 0.5749 |
| Job CPU time | 14 s |
Graph 13 - the structure of the transition state after the first optimization
The structure is then reoptimized, which allows the bond distances that was previously frozen to be optimized. The optimization is to TS (berny), and used AM1 semi-empirical molecular orbital as the method.
| File type | .log |
|---|---|
| Calculation Type | FTS |
| Calculation method | RAM1 |
| Basis Set | ZDO |
| Charge | 0 |
| Spin | Singlet |
| E (RAM1)/a.u. | 0.11165464 |
| RMS Gradient Norm/ a.u. | 0.00001482 |
| Dipole Moment/ Debye | 0.5608 |
| Job CPU time | 33 s |
Comparing the calculation summary of the first and second optimization, we can see a significant decrease in RMS gradient norm. After the first optimization, the RMS gradient norm is larger than 0.001 a.u., indicating that the optimization is not yet converged. After the second optimization, the RMS gradient norm is well below 0.001 a.u..
Graph 14 - the structure of the transition state after the second optimization
After the second optimization, the transition state is optimized again, this time using a more accurate DFT/B3LYP/6-31G (d) level of theory. The frequency is also calculated.
| File type | .log |
|---|---|
| Calculation Type | FREQ |
| Calculation method | RB3LYP |
| Basis Set | 6-31G(d) |
| Charge | 0 |
| Spin | Singlet |
| E (RB3LYP)/a.u. | -234.54389655 |
| RMS Gradient Norm/ a.u. | 0.00000806 |
| Dipole Moment/ Debye | 0.3940 |
| Job CPU time | 6 minutes 48 seconds |
Graph 15 - the labelled structure of the transition state after the third optimization
The structure of the final optimized structure is analyzed and summarized in the table below.
| C7 and C14, C1 and C11 bond distance/Å | 2.27 |
|---|---|
| C2 and C5 bond distance/Å | 1.41 |
| C1 and C2, C5 and C7 bond distance/Å | 1.38 |
| C11 and C14 bond distance/Å | 1.39 |
| C1,C2,C5,C7 dihedral angle/° | 0.0 |
| C1,C2,C5 and C2,C5,C7 angle/° | 122.0 |
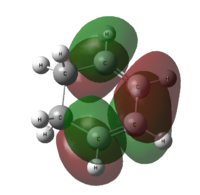
The imaginary frequency after the third optimization is -525 cm-1. The imaginary frequency is expected from a transition state. Animation of the vibration at -525 cm-1 shows that it corresponds to synchronous bond formation.
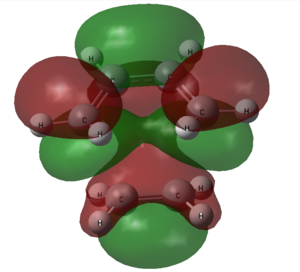
Molecular Orbitals of the Transition State Structure
| Molecular orbitals | HOMO | LUMO |
|---|---|---|
| Transition state | 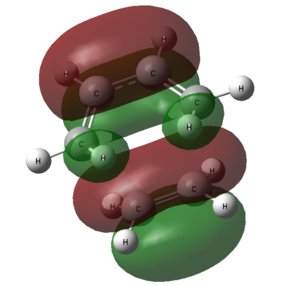 |
|
| Symmetry with respect to molecular plane | Symmetric | Symmetric |
Comparing the shapes of the LUMO and HOMO with the HOMO and LUMO of cis butadiene and ethylene in table ? above, it can be seen that the LUMO is formed from ethylene HOMO orbital and butadiene LUMO orbital. The HOMO is formed from ethylene HOMO and butadiene LUMO. These orbitals are allowed to interact because they have the same symmetry.
Studying the regioselectivity of the Diels Alder Reaction
In this section, the Diels-Alder reaction between cyclohexa-1,3-diene and maleic anhydride is studied.
Graph 16 - the Diels Alder reaction between Cyclohexa-1,3-diene and Maleic Anhydride
Two products are formed in the reaction. It is well known that the kinetic product, which is the endo product, is predominantly formed. The reaction is supposed to be kinetically controlled, with the exo transition state higher in energy.
The transition state for both the endo and the exo product was located. Their structures were optimized, and energy compared. The final geometry of the structures was also measured. The molecular molecules, especially the HOMO and LUMO, for the transition states were calculated using GaussView 5.0.9.
Optimizing the reactants
The reactants for this reaction, cyclohexa-1,3-diene and maleic anhydride is optimized using the semi-empirical AM1 method. The HOMOs and LUMOs are sketched.
Sketching the MOs of the reactants allows us to analyze the MOs of the transition state later and to determine which orbitals will be interacting to form the product.
Optimizing the exo transition state
The exo transition state was sketched in GaussView and optimized in a three-step process: firstly the distance between the reaction coordinates were freeze to 2.2Å using the Redundant Coord Editior and optimized to minimum using semi-empirical AM1 calculation method. After the first optimization, the reaction coordinates were unfrozen and optimized again to TS (berny) using semi-empirical AM1 calculation method. After this, the structure was optimized the third time to TS(berny) using a more accurate DFT-B3LYP/6-31G(d) level of theory. The frequency was also calculated when carrying out the third optimization.
File for the final optimization can be found at DOI:10042/to-10181
After the second optimization, the distance between the reaction coordinates is 2.17Å. After the third optimization, the distance between the reaction coordinates is 2.20Å. The RMS Gradient Norm for the last optimization is less than 0.001, which proves that the optimization is converged.
After the optimization, the geometry of the optimized structure is analyzed.
Graph 17 - the labelled diagram of the exo transition state after optimization

| Bonds | Bond lengths/ Å | |
|---|---|---|
| C1 and C3, C6 and C5 | 1.39 | |
| C5 and C13 | 1.39 | |
| C3 and C6 | 1.40 | |
| C1 and C8, C10 and C15 | 1.51 | |
| C8 and C10 | 1.56 | |
| C13 and C17, C5 and C18 | 1.50 | |
| C18 and O19, C17 and O19 | 1.40 | |
| C18 and O21, C17 and O20 | 1.20 |
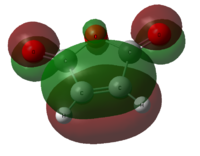
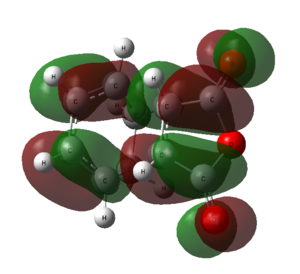
The HOMO and LUMO of the optimized exo transition state is calculated using GaussView.
| HOMO | LUMO | |
|---|---|---|
| Structure | 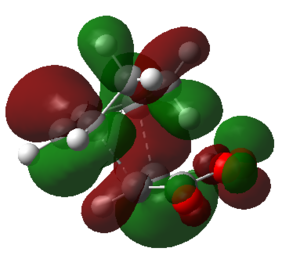 |
|
| Symmetry | Symmetric | Antisymmetric |
The HOMO of the exo transition state is formed from the LUMO of cyclohexa-1,3-diene and HOMO of maleic anhydride. The LUMO of the transition state is formed from the HOMO of cyclohexa-1,3-diene and LUMO of maleic anhydride.
Optimizing the endo transition state
Same as optimizing the exo transition state, the endo transition state is optimized in a similar 3-step process: first, freeze the distance between the reaction coordinates to 2.2Å using the Redundant Coord Editior and optimized to minimum using semi-empirical AM1 calculation method. This is followed by unfreezing the and optimized again to TS (berny) using semi-empirical AM1 calculation method. After this, the structure was optimized the third time to TS(berny) using a more accurate DFT-B3LYP/6-31G(d) level of theory. The imaginary frequency was also calculated when carrying out the third optimization.
After the optimization, the geometry of the optimized structure is analyzed.
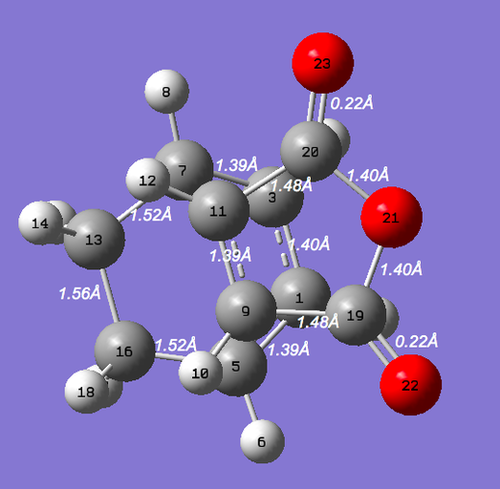
Diagram 17 - the labelled diagram of the endo transition state after optimization
| Bonds | Bond lengths/ Å |
|---|---|
| C1 and C5, C3 and C7 | 1.39 |
| C1 and C3 | 1.40 |
| C5 and C16, C13 and C7 | 1.52 |
| C1 and C8, C10 and C15 | 1.51 |
| C13 and C16 | 1.56 |
| C11 and C20, C9 and C19 | 1.48 |
| C20 and O21, C19 and O21 | 1.40 |
| C19 and O22, C20 and O13 | 0.22 |
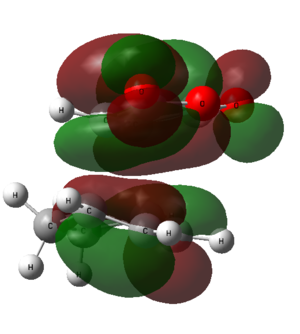
The HOMO and LUMO of the optimized endo transition state was calculated using GaussView.
| HOMO | LUMO | |
|---|---|---|
| Structure | 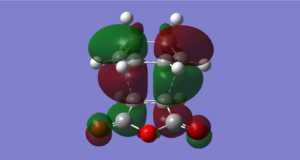 |
|
| Symmetry | Antisymmetric | Antisymmetric |
Secondary orbital overlap effect
Experimental observation is that the reaction between maleic anhydride and cyclopentadiene gives the endo adduct faster than they give the exo adduct even though the latter is more thermodynamically stable.(pp.106). This is because the transition state of the endo isomer is lower in energy, as show in the table below:
| Exo adduct | Endo adduct | |
|---|---|---|
| Energy/a.u. | -612.67931095 | -612.68339675 |
| Energy/kJ mol-1 | -1608589.5309 | -1608600.2582 |
The exo adduct is more stable than the endo adduct by 10.7 kJ mol-1. This is due to the presence of secondary overlap of frontier orbitals in the endo transition state, which is not present in the exo transition state.
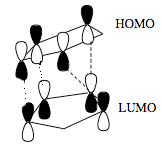
Diagram 18 - the interaction of frontier orbitals in the endo transition state
The dashed lines in the diagram above denote bond-forming interactions, while the dotted lines donate non-bond forming secondary orbital interactions. In the endo transition state, only bond-forming interactions are present:
Diagram 19 - the interaction of frontier orbitals in the exo transition state
The HOMO of both endo and exo transition states have nodal planes. However, secondary overlap is hard to confirm from the calculated HOMO diagrams, as they all show a similar degree of overlap. This might be due to the choose of method and basis set which is not accurate enough to be able to illustrate the secondary interactions in the calculated diagram. Hence, another more accurate method should be used to examine the HOMOs of the two transition states.
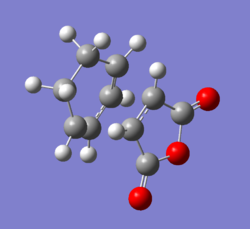
Examine the shapes of the optimized endo and exo transition states, we can see that for the exo isomer, the maleic anhydride molecule fragment is on the same side as the CH2-CH2 group. This leads to large steric strain in the transition state. For the endo isomer, the maleic anhydride fragment is on the opposite side as the CH2-CH2 group, which avoids the steric strain.
Therefore, the relative energy of the transition states is depend on two factors: the extent of secondary interactions between the frontier orbitals, and the extent of steric strain. The fact that the exo adduct is more stable shows that the stabilizing effect by the secondary interactions is greater than the destabilizing effect by the steric hindrance.


