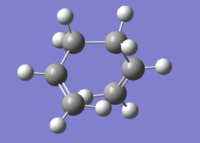
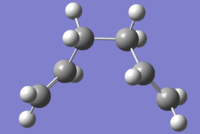
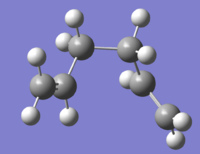
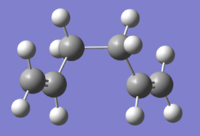
Rep:Mod3:Thebacon
Sergei Palmer Year 3 Computational Labs - Module 3: Transition States and Reactivity
In these experiments, transition state structures on potential energy surfaces for the Cope rearrangement and Diels-Alder cycloaddition reactions will be characterised. Molecular orbital-based methods have to be used as the basic molecular mechanics/force field methods do not numerically solve the Schrodinger equation which is necessary to describe bonds being broken and formed, changes in bonding type/charge distribution and to locate the transition structures based on local potential energy surface shapes. As well as finding the optimised transition structures, it is possible to calculate reaction paths and barrier heights.
The Cope Rearrangement
This problem will use the Cope rearrangement of 1,5-hexadiene, fig. 1, to study a chemical reactivity problem.
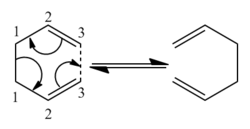
This is a [3,3]-sigmatropic shift where it is an allyl group rather than a single carbon atom which migrates. The process involves six electrons (fitting the 4n+2 aromatic rule) and is thermally allowed via Huckel topology with suprafacial components[1]. which has been subject to many computational and experimental studies[2]. Whether it went via a concerted, stepwise or dissociative mechanism was under discussion for a long time but it is now generally accepted that it goes in a concerted fashion via either a C2h "chair" or C2v "boat" transition structure (fig. 2) with the "boat" several kcal/mol higher in energy.

The objective of this experiment is to locate the low-energy minima and transition states to determine which reaction mechanism is preferred; the DFT: B3LYP (6-31G*) method has been shown to calculate this reaction in good agreement with experimental data.
These calculations were all done using Gaussian 09W; it was not deemed necessary to use the SCAN server cluster for these low level calculations. All LOG files have been linked to.
Optimising the Reactants and Products [3-21G]
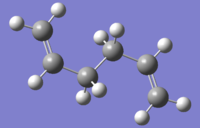
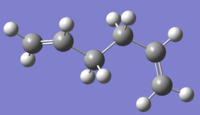
To rationalise the mechanism by which the Cope rearrangement occurs, the optimised geometries and energies of several 1,5-hexadiene conformations were investigated. Six gauche conformers (dihedral angle = 60°) followed by four antiperiplanar (dihedral angle = 180°) conformers were optimised.
The conformers were constructed in Gaussview using the R-group fragment tool, before being cleaned and checked to ensure no superfluous hydrogen atoms were present. It was found that sometimes there would be an extra hydrogen on the double bond even after cleaning which would affect the optimisation. The structures were then rotated into the necessary geometries using the dihedral angle tool around the central four sp3 carbon atoms. The low level basis set 3-21G was initially used with the Hartree-Fock method to do a basic optimisation; the additional keyword "pop=full" was included so that MO analysis of the lowest conformations could be performed.. The memory limit was specified at 500MB under the Link 0 tab. The point group was determined using the Symmetrize function and was then noted along with the energy in a.u. (Hartrees).
All of the conformations were successfully optimised in terms of geometry and energy, matching that of those shown in Appendix 1[3] to five decimal places and sharing the same point groups.
MO analysis
Using the 3-21G optimised files, the HOMOs of the three lowest energy conformations were explored to see the differences which may explain the different energy levels. For comparison the HOMOs of the three highest conformations are shown as well.
| Conformer | HOMO visualisation | Relative energy [kcal/mol] |
|---|---|---|
| Gauche 3 | 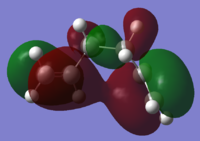
|
0.00 |
| Anti 1 | 
|
0.04 |
| Anti 2 | 
|
0.08 |
| Conformer | HOMO visualisation | Relative energy [kcal/mol] |
|---|---|---|
| Gauche 1 | 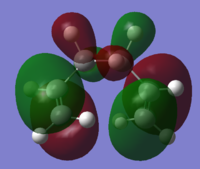
|
3.10 |
| Gauche 6 | 
|
2.20 |
| Anti 3 | 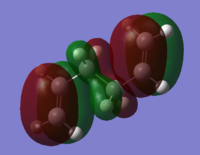
|
2.25 |
The higher energy conformers have a greater number of nodes and have more spread out electron density across the allyl group.
6-31G(d) analysis
The 3-21G optimised structures were then reoptimised using the slightly higher level 6-31G(d) basis set to see how the geometries and relative energies change.
It can be seen that again the more advanced basis set predicts the same three conformers to have the lowest energies (anti 1, anti 1 and gauche 3); however it is now the anti 1 conformer which has been predicted to have the lowest of the three.
Frequency Analysis
Using the DFT: B3LYP (6-31G (d)) method, frequency analysis was done on all of the conformers. The output from the log files of the three most stable was checked to see how well they had converged by inspection of the low frequencies. Anti 1 log file Anti 2 Log file Gauche 3 Log file
Anti 1 -
 Low frequencies ---  -23.1860   -6.8499   -0.0007    0.0003    0.0007    9.6992
 Low frequencies ---   75.0712  100.4026  110.5184
Anti 2 -
 Low frequencies ---   -9.4872   -0.0006   -0.0003    0.0003    3.7510   13.0183
 Low frequencies ---   74.2858   80.9988  121.4175
Gauche 3 -
 Low frequencies ---   -4.3998   -0.0006   -0.0006   -0.0005    7.2528    8.2825
 Low frequencies ---   75.0345  103.1967  125.5611
Anti 2 and Gauche 3 both show low frequencies which go no lower than -10. This is good as it shows they are more likely to have fully converged. The frequencies on the second line are all positive indicating that a minimum was indeed found. Frequency analysis takes the second derivative of the potential energy surface; hence as they are all positive, the end point was a minimum rather than a maximum indicating a transition state.
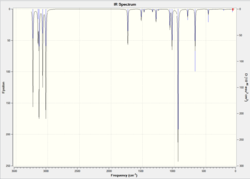
As anti 1 hasn't converged as much as anti 2, anti 2 will be looked at instead. The spectrum is shown in fig. 3. 42 positive vibrations were predicted by the calculation. The symmetric and antisymmetric double bond stretches are shown in table 5.
| Stretch | Wavenumber (cm-1) |
|---|---|
 |
1731.1 |
 |
1734.4 |
The thermochemistry results for anti 2 are shown below. The frequency optimisation was repeated with the input file edited so that it was calculated for 0K.
Zero-point correction                                0.142507 (Hartree/Particle)
 Thermal correction to Energy                        0.149853
 Thermal correction to Enthalpy                      0.150797
 Thermal correction to Gibbs Free Energy             0.110933
 Sum of electronic and zero-point Energies           -234.469204
 Sum of electronic and thermal Energies              -234.461857
 Sum of electronic and thermal Enthalpies            -234.460913
 Sum of electronic and thermal Free Energies         -234.500777
 Recalculated at 0K
 Zero-point correction                               0.142944 (Hartree/Particle)
 Thermal correction to Energy                        0.142944
 Thermal correction to Enthalpy                      0.142944
 Thermal correction to Gibbs Free Energy             0.142944
 Sum of electronic and zero-point Energies           -234.468766
 Sum of electronic and thermal Energies              -234.468766
 Sum of electronic and thermal Enthalpies            -234.468766
 Sum of electronic and thermal Free Energies         -234.468766
Optimising the chair and boat transition structures
Chair
The chair and boat transition structures were constructed in Gaussview. The chair was optimised using the 'Optimization to a TS (Berny)' method with the additional keyword 'Opt=NoEigen' with the Hartree-Fock (3-21) method. Log file
Frequency analysis of the output showed an imaginary vibration at 817.9cm-1 (fig. 4), characteristic of the transition state.

The animation clearly shows that this vibration results from oscillation of the terminal carbons involved in bond formation. The distances between the terminal carbons were 2.02Å .
The transition state was then reoptimised using the frozen coordinate method. This works by first optimising the structure to a transition state (Berny) with the bond forming carbons frozen. Following this, it is reoptimised, but instead the frozen bonds were now optimised as derivatives. The distances between the terminal bond forming carbons were again 2.02Å.
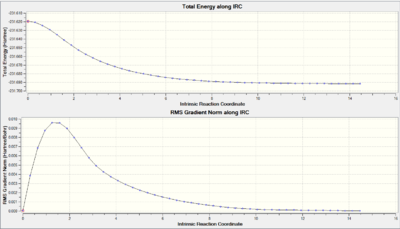
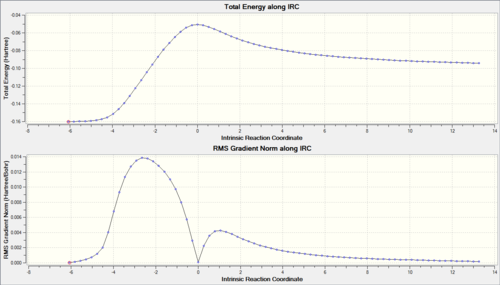
From the IRC, we can see that the RMS gradient has hit 0 meaning that the TS was fully minimised. The optimised structure closely resembled that of the gauche 2 conformer investigated earlier.
Boat
The boat transition state was investigated using a different method: QST2. Here, the reactant and product are specified side by side and the calculation interpolates between the two to find the transition state. The initial optimisation using QST2 failed giving the result shown in fig. 6.
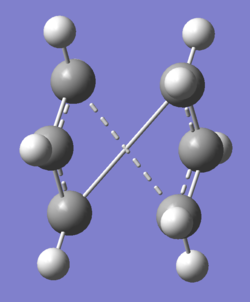
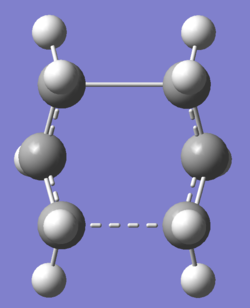
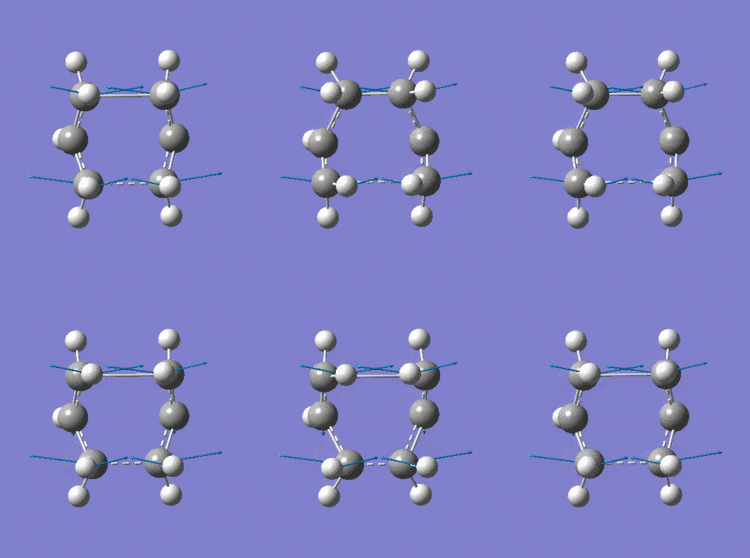
The reactant and product geometries were then altered so that they appeared closer to the boat transition structure by modifying the dihedral angles around the central four carbon atoms. After recalculation, this produced the structure shown in table 6, which clearly resembles a boat-like structure. Fail log file Log file
| Image | Image | Frequency Animation |
|---|---|---|
|

|
|
Frequency analysis produced 42 vibrations, one of which was the imaginary bond formation vibration at -840.1cm-1 as shown in table 6. The boat TS resembled most closely to the gauche 3 conformer.
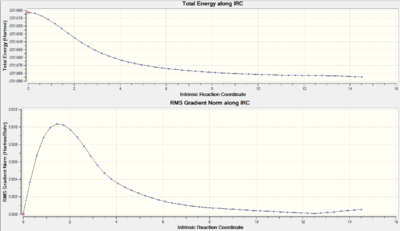
The IRC shown in fig. 7 demonstrates that the structure was optimised to very close to its minimum point.
Activation Energies
| Symmetry | Electronic & zero-point energies(Ha) | DFT Electronic and Thermal Energies (Ha) | Terminal bond forming carbon separation (Å) | Activation Energy(kcalmol-1) wrt Anti 1 [298.15K] | Lit[4] (kcal/mol) | |
| Chair TS | C2h | -234.414929 | -234.409008 | 1.97 | 34.12 | 33.5 ± 0.5 |
| Boat TS | C2v | -234.402342 | -234.396008 | 2.21 | 42.02 | 44.7 ± 2.0 |
The calculated energies show pretty good agreement with the literature values; this demonstrates that the DFT: B3LYP(6-31G(d)) can calculate energies to a fairly high accuracy. This could be repeated at 0K to investigate what difference the lower temperature would make. One might expect the activation energy to be slightly higher as a result of the very low temperature.
The Diels-Alder cycloaddition
The Diels-Alder reaction between butadiene and ethylene goes via a concerted π4s + π2s cycloaddition. The reaction is controlled by the interaction of the HOMO and LUMO orbitals on the two reactants. The molecular orbitals of the cis-butadiene and ethylene were investigated using the AM1 semi-empirical molecular orbital method to determine how the reaction proceeds.
MO Analysis
| HOMO | LUMO | |
| cis-Butadiene | 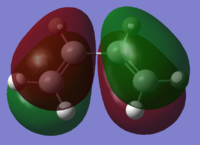 |

|
| Ethylene | 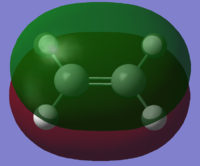 |

|
The cis-butadiene HOMO is anti-symmetric in the vertical and horizontal planes, whereas the LUMO is symmetric in the vertical plane, and anti-symmetric in the horizontal plane. The ethylene HOMO for ethylene is symmetric in both planes, whereas the LUMO is anti-symmetric in both planes.
| HOMO | LUMO | |
| Diels-Alder TS | 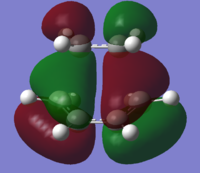 |
|
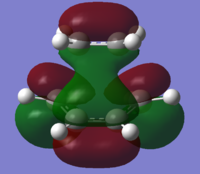
The MOs for the transition state show that the overlaps which form the HOMO & LUMO result from combinations of orbitals from the two reactants. The TS HOMO is the result of the cis-butadiene HOMO overlapping with the ethylene LUMO. On the other hand, the LUMO results from the overlap of the cis-butadiene LUMO with the ethylene HOMO. The LUMO has an energy of 0.02104, which suggests that it is likely to be non-bonding. The HOMO-LUMO combinations are allowed; in each case there has been retention of symmetry. The HOMO TS is antisymmetric and the LUMO is symmetric. The double bonds in ethylene and butadiene are all 1.36Å and the single bond in butadiene is 1.42Å. Typical sp2 C=C bonds are 1.33Å - the deviation from this can likely be explained by the delocalisation of electrons causing the lengthening. Conversely, the C-C bond length is shorter than usual (1.54Å) as it is between being a double and a single bond. The bond being formed between the terminal carbons was fixed at 2.2Å for the purposes of the calculation.
Frequency Analysis
Frequency analysis shows that the bond formation between the two compounds is synchronous as demonstrated by the symmetrical nature of the imaginary stretch at 955.9cm-1in fig. 8.


The lowest positive vibration (147.0cm-1) shown in fig. 9 however shows asynchronous bond formation with its asymmetric vibration. This would indicate that cyclisation is higher in energy compared to the cycloaddition shown by fig. 8.
Study of regioselectivity in the Diels-Alder reaction
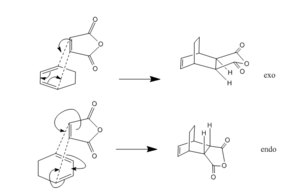
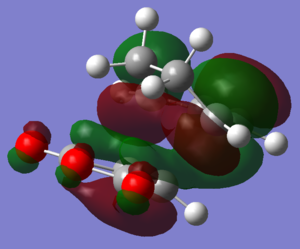
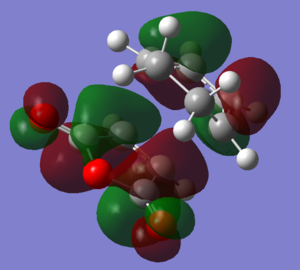
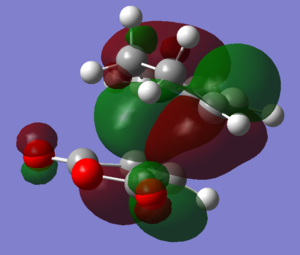
The Diels-Alder reaction between maleic anhydride and 1,3-Cyclohexadienereaction can proceed either via an endo or exo pathway as illustrated in fig. 10. The major product is the endo adduct and since the reaction is kinetically controlled, the exo form should be higher in energy. Using the bond freezing technique with the AM1 method, the transition states of each form were modelled. The exo adduct had an energy of -31.64kcal/mol compared with -32.32 for the endo. Hence it was shown that the endo is more stable as it is lower in energy meaning the exo is the kinetic product.
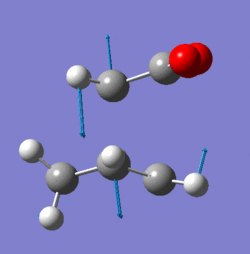
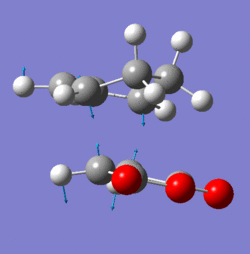
Frequency analysis of the two transition states showed an imaginary vibration at -806.4cm-1 for the endo and -811.2cm-1 for the exo form. These both demonstrate the concerted nature of the reaction.
Molecular orbitals
| Endo | Exo | |
| LUMO+2 |  |
 |
| LUMO+1 | 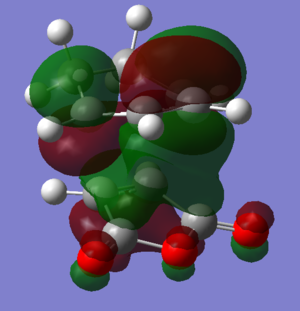 |
 |
| LUMO |  |
 |
| HOMO | 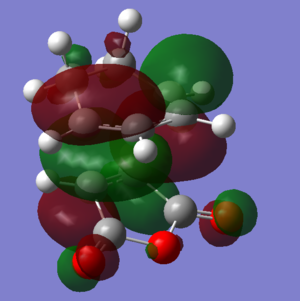 |
 |
| HOMO-1 | 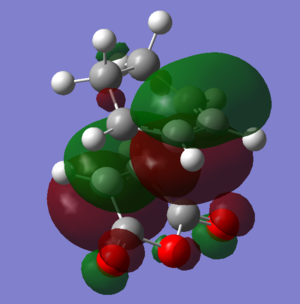 |
 |
| HOMO-2 | 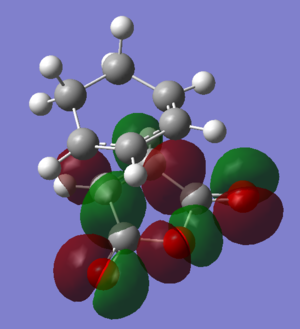 |
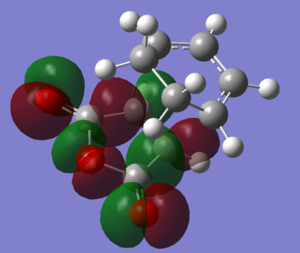 |
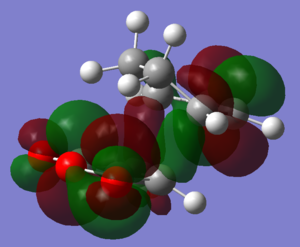
The HOMOs and LUMOs of both transition states are antisymmetric in the vertical axes; the nodes around the oxygen atoms seem to suggest that electron density is being pushed towards the C=C double bond in order to aid the bond formation in secondary orbital overlap type interactions. The HOMO-2s both show all electron density centered over the maleic anhydride.
IRC

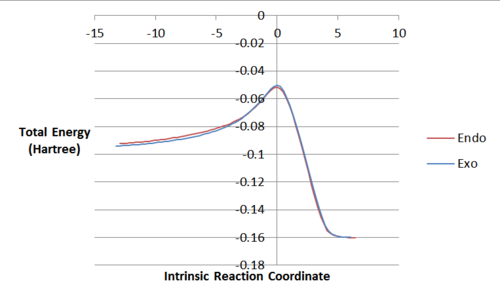
From the graph of the endo Log file IRC against the exo Log file IRC, it can be seen that initially the exo is lower in energy when still present as individual reactants. However, at the peak, the endo transition state is lower in energy than the exo as expected. The final energies are very close but overall the endo is slightly lower.
Activation Energies
| Activation Energy (Ha) | Activation Energy (kcalmol-1) | |
| Endo | 0.0408 | 25.605 |
| Exo | 0.0437 | 27.390 |
From this, it can be said that the endo is more kinetically favoured as it is lower in energy; the increased secondary orbital interactions in the endo transition state cause it to be more stable. The IRC analysis agrees with this, showing endo to be more stable and hence the thermodynamic product. With more time, a higher basis set could have been used [DFT: B3LYP(6-31G(d))] perhaps in order to more accurately model the reaction. Steric effects from the approach of maleic anhydride are not taken into account with the AM1 method, which may change the results with a better basis set.
Conclusion
This module focused on the modelling of transition states using increasingly more accurate methods from HF(3-21G) to semi-empirical AM1 to DFT:B3LYP(6-31G(d)). Confirmation that transition states were found was done using second derivative frequency analysis - when an imaginary vibration was predicted, this showed that the maximum on the PES had been found. IRC plots helped to show the energy of the system as the reaction proceeded as was also used to illustrate the varying stability of the endo and exo products in the diels-alder reaction.
References
- ↑ Rzepa, H., Organic Pericyclic Reactions, 2010 - http://teaching.ch.ic.ac.uk/organic/pericyclic/ - Date accessed 14/12/2011
- ↑ Wiest, O., Black, K. A., Houk, K. N., J. Am. Chem. Soc. 1994,116, pp. 10336-10337
- ↑ https://wiki.ch.ic.ac.uk/wiki/index.php?title=Mod:phys3#Appendix_1 - Date accessed 14/12/2011
- ↑ Goldstein, M. J. , Benzon, M. S., J. Am. Chem. Soc., 1972, 94, 7149

