
Rep:Mod3:610phy
Module 3: Physical Computational Chemistry by Hayley Rigby
Introduction

One of the areas where theoretical methods show an advantage over experimental is in the study of transition state structures. The understanding of reaction potential surfaces is often possible because of the development of computer programs to calculate energies, energy gradients/second derivatives with respect to nuclear coordinates.[1]
A transition state is a stationary point on a potential energy surface. [See figure 1][2]
By examining the second derivative at the stationary point, one can conclude whether it corresponds to a minima or maxima.
The second derivative is always positive near a minimum (positive curvature) and vice versa near a maximum. For functions of more than one variable such as potential energy surfaces V(x1,y2,z1,x2,y2,z2,....), the second derivative is a matrix (Hessian matrix). To find a transition state, you need to find the eigenvalues of the Hessian Matrix. If one is close enough to the transition state, they will all be positive, except for one, which will be negative. We will carry out frequency analyses of molecules to obtain this information.
Studying transition structures in larger molecules is more difficult than molecules with few atoms as there are no longer fitted formulae for the energy, and the molecular mechanics methods cannot be applied as they do not describe bonds being made and broken. So, this module uses molecular orbital-based methods, numerically solving the Schrodinger equation, and locating transition structures based on the local shape of a potential energy surface. As well as showing what transition structures look like, reaction paths and barrier heights can also be calculated. Force Constant Matrix, Frozen Coordinate and QST2 methods will be implemented. In addition to these, the intrinsic reaction coordinate (IRC) path using Gaussian will allow us to follow the reaction path from the transition state to the product.
Two key reactions in Organic Chemistry involving large systems will be studied: The Cope Rearrangement and the Diels Alder reaction. [3]
The Cope Rearrangement
The Cope rearrangement is a [3,3] sigmatropic shift rearrangement of 1,5-dienes discovered by A. Cope in 1940.[4] An allyl group migrates rather than a single carbon atom. The electron count is 6 (4n+2) and the reaction is thermally allowed via Hückel topology with suprafacial components, via a transition state.[5]

In this module we will locate the low-energy minima and transition structures on the C6H10 potential energy surface, to determine the preferred reaction mechanism. In the first part, the transition states of the Cope [3,3] sigmatropic rearrangement of 1,5-Hexadiene (figure 2) will be analysed by computational methods.
The reaction occurs via a concerted cyclic "chair" or "boat" transition structure (pericyclic), where the "boat" confirmation is higher in energy. The 1,5-hexadiene can be in either the antiperiplanar (app) or the gauche form. Both these forms are optimised and their energy levels are compared below.
Optimisation
The APP and Gauche conformers were optimised at the 3-21G/Hartree Fock level. The results of the optimisation showing the energies, point group and optimised molecules are displayed below in table 1.
| Optimised Conformer (Jmol) | Structure | DOI of Log File | Energy(Hartrees) HF/3-21G |
Relative Energy (kcalmol-1) | Symmetry Point Group |
| Gauche 1 |
|
[20998] | -231.68772 | 3.10 | C2 |
| Gauche 6 |
|
[21024] | -231.68916 | 2.20 | C1 |
| Gauche 3 |
|
[21027] | -231.69266 | 0.00 | C1 |
| APP 1 |
|
[20956] | -231.69260 | 0.04 | C2 |
| APP 2 |
|
[21013] | -231.69254 | 0.08 | Ci |
| APP 3 |
|
[21006] | -231.68907 | 2.25 | C2h |
| APP 4 |
|
[21015] | -231.69097 | 1.06 | C1 |


Results and discussion
One might expect from theoretical evidence that the APP conformation would have the lowest energy and therefore represent the most stable conformer. This can be explained by the following 3 competing effects that overall; favour the APP conformation.[5]
- Orbital Overlap/Bond orientation (Stablising Effect:) Bonding σC-H orbital and antibonding σ*C-H orbital overlaps and bonding σC-C orbital and anti-bonding σ*C-C orbital overlaps result in a stabilisation of the bonding orbital and a destablisation of the anti-bonding orbital. Since the latter are unoccupied, the overall effect is a stabilisation of the molecule. Both the gauche and the anti conformers experience this effect, but the anti-peri-planar(app) has the most efficient orbital overlap and so is stabilised more than the gauche conformer.
- Bond-bond or Pauli repulsions (Destabling Effect:) The interaction between two occupied C-H σ-orbitals results in overall destabilisation (the top orbital is destabilised more than the bottom is stabilised). When two occupied molecular orbitals are close to each other, this effect is apparent. This effect dominates more in the gauche confirmation than in the app confirmation as the C-C bonds are further apart in app molecules, thus experiencing less bond/pauli repulsions.
- Van de Waals (dispersion) Forces (Stablising Effect:) This effect is isotropic and arises from the non-directly bonded atoms. The maximum attraction occurs at a distance corresponding to the sum of the van der Waals radii for the two atoms concerned. (e.g. H...H interaction ~ 2.4Å). The gauche conformation has two sets of attractive H...H dispersion interactions, whilst the app conformation does not have this type of interaction. Hence, this effect favours the gauche conformation.
However, the results shown in table 1 suggest that the Gauche 3 conformer is lowest energy (most stable) confirmation. This observation could be due to a favourable overlap between the C=C π orbital and the vinyl C-H σ* antibonding orbital in this gauche conformer leading to an overall stabilisation of the molecule. The calculation ran with an accuracy of ±10 kJ/mol and so this observation is somewhat negligible. The results could have been improved by using a higher basis set.
The optimised structure, energies and point groups are in exact agreement with those reported in the Appendix provided.[6]
Higher basis Set (6-31G(d)) for Anti 2 conformer:
The Anti 2 structure is further optimised using B3LYP/6-31G(d), a higher level of theory.
Result:
| Structure | Point Group | Energy/Hartrees HF/3-21G |
Energy/DFT 6-31G (d) |
Summary of Optimisation |
|
|
Ci | -231.6925 | -234.6117 |
|


Although the energy is reported to be lower using this higher level basis set, it cannot be used to compare the different optimisations (due to the different energy scales used in each method). Therefore, the geometry (dihedral angles and bond lengths) of both confirmations can be compared.
Table 3: Angles and bonds analysis of the two methods
| HF/3-21G | DFT-B3LYP/6-31G(d) | Literature [7] | |
| Dihedral angle of terminal carbons(°) | 114.7 | 119.0 | N/A |
| Dihedral angle of central carbons(°) | 180.0 | 180.0 | N/A |
| C=C bond(A) | 1.32 | 1.34 | 1.34 |
| C2-C3(A) | 1.51 | 1.51 | 1.51 |
| C3-C4(A) | 1.55 | 1.55 | 1.54 |
It is observed that the optimised structure is very similar to that obtained using HF/3-21G. The main difference in the two geometries is the C-C-C-C dihedral angle of the terminal carbons, which change from 114.7° to 119.0° when the higher level method is applied. This suggests the angle is made wider in order to minimize steric interactions within the molecule, thereby giving it a lower energy (more stabilisation).
Vibrational Analysis of Anti2 Conformer
The final energies given in the output file represent the energy of the molecule on the bare potential energy surface. To be able to compare these energies with experimentally measured quantities, a frequency calculation will be carried out. The frequency calculation can also be used to characterize the critical point; confirm that it is a minimum in this case: that all vibrational frequencies are real and positive.[8]
The vibrational analysis also determines if the optimisation has been successful in obtaining the lowest energy configuration of the conformer. This can be concluded by analysis of the following parts of the log output file.
- The largest low frequency should always be almost 1 order of magnitude larger than the lowest normal vibration given. Thus, indicating that the ground state has been found instead of the transition state.
- The presence of negative frequencies in the output file. If there is one negative frequency then a maximum turning point has been found instead of a minimum and is that of the transition state instead of the ground state. If there is more than one negative value then the optimisation has failed. If all frequency values are positive then the minimum point can be concluded to have been successfully found.
- Results of Vibrational Analysis
Low frequencies ---   -7.4062    0.0007    0.0011    0.0012   13.5514   22.7268
 Low frequencies ---   71.6522   83.4582  122.7038
This shows that all of the vibrational modes are positive, which proves that a minimum was reached.
The IR spectrum is shown below. It shows peaks resulting from C-H stretches (3000-3400cm-1), C-H bends (670-1100 cm-1) and a C=C double bond stretch at 1734cm-1. The animated vibration is also shown below.

|

|
|||
| Figure 3: IR Spectrum | Figure 4: Animation of vibration |
Additional thermochemical data about the energies of the anti2 confomer were obtained from the vibrational analysis output file.
| Energy/Hatree | |
|---|---|
| Sum of electronic and zero-point Energies | -234.469179 |
| Sum of electronic and thermal Energies | -234.461834 |
| Sum of electronic and thermal Enthalpies | -234.460890 |
| Sum of electronic and thermal Free Energies | -234.500753 |
In order they represent the following:
- The potential energy at 0K taking zero-point vibrational energy into account: E0 = Eelec + ZPE;
- The energy at standard conditions including translational, vibrational and rotational contributions to the total thermal energy: E = E0 + Evib + Erot + Etrans
- The energy containing a correction term for RT which is particularly significant when looking at dissociation reactions: H = E + RT;
- The energy including entropic contributions: G=H-TS
Optimizing the "Chair" and "Boat" Transition Structures
Carrying out Transition State optimisations are more difficult, because the calculation needs to know where the negative direction of curvature is (i.e. the reaction coordinate). In this section the various ways of optimising transition structures are explored.
Four different techniques were used:
First technique: Optimisation of Allyl fragment
- The first required an approximation of a 'guess' transition state structure for the chair conformer. This was created by optimising (HF/3-21G level) an allyl fragment (CH2CHCH2) and pasting the optimised fragment twice into a new molecule window. [21063]
- Results of Allyl Optimisation
 Item               Value     Threshold  Converged?
 Maximum Force            0.000141     0.000450     YES
 RMS     Force            0.000045     0.000300     YES
 Maximum Displacement     0.001538     0.001800     YES
 RMS     Displacement     0.000596     0.001200     YES
 Predicted change in Energy=-1.503703D-07
 Optimization completed.
    -- Stationary point found.
 | |||
|---|---|---|---|
|
The summary table shows that the RMS gradient is 0.00005721 a.u, below 0.0003 which is the criterion by which Gaussian concludes whether an optimisation has converged and is complete.
The two fragments were then rearranged into a structure replicating the transition state as closely as possible (with a separation ~2.20Å). This was our guess transition state structure (see figure 5). The force constant matrix (i.e. the Hessian Matrix) was then computed in the first step of the optimisation, and updated during the course of the transition state optimisation (called 'TS Berny' after Berny Schlegel, one of Gaussian's developers). [21071]
 |
 |
 |
 |
 |
- The summary shows that the RMS gradient is 0.00000626 a.u, below 0.0003 which is the criterion by which Gaussian concludes whether an optimisation has converged and is complete.
- The fragment separation between the terminal carbons falls from 2.20Å to 2.02Å.
- An imaginary vibrational mode is found at -818cm-1, which represents the breaking and forming of a σ bond occurring in the [3,3]-sigmatropic rearrangement.
- The vibrations shown reveal one imaginary frequency, concluding that a transition structure has been found between two minima.
Technique 2: Optimisation of the 'Chair' TS using Frozen coordinates:
- The second technique was carried out on the same 'guess' structure and involved freezing the reaction coordinate using the keyword Opt=ModRedundant and minimising the rest of the molecule. Once the molecule is fully relaxed, the reaction coordinate was unfrozen and the transition state optimisation was started again.
Redundant Method:[21085] 'Unfreezing coordinates':[21089]
Item               Value     Threshold  Converged?
 Maximum Force            0.000016     0.000450     YES
 RMS     Force            0.000004     0.000300     YES
 Maximum Displacement     0.000497     0.001800     YES
 RMS     Displacement     0.000089     0.001200     YES
 Predicted change in Energy=-4.487882D-08
 Optimization completed.
    -- Stationary point found.
 |
 |
 |
 |
Similar results to the first method were observed, with one imaginary vibration appearing at -818cm-1, thus confirming the identity of the turning point as a transition state. Again, the Allyl fragment separation dropped from 2.20Å to 2.02Å. To conclude; both techniques optimise to the same transition structure, with the same bond lengths and imaginary frequency.
Technique 3: QST2 Method on the Boat confirmation
- The third technique was applied to the boat structure and used Gaussian's facility for automatically generating a starting structure for a transition state optimisation based upon the reactants and products that the structure connects, known as the Synchronous Transit-Guided Quasi-Newton (STQN) Method.[9] This method uses a quadratic synchronous transit to get closer to the quadratic region around the transition state and then uses a quasi-Newton algorithm to complete the optimisation.
Unlike other methods, the STQN does not require a guess for the transition structure, instead the reactant and product structures are input and itself generates a guess structure in terms of redundant internal coordinates.
The HF/3-21G method was requested using an opt+freq to TS (QST2) calculation which required only the reactant and product to be inputted. The mechanism studied has 1,5-hexadiene as the reactant and product and so the numbering for the product molecule was manually changed so that it corresponds to the numbering obtained if our reactant had rearranged (Figure 13)
|
|
|
| Reactant molecule | Product molecule |


However, the optimisation was not successful, as shown in Figure 14. The transition structure looks more similar to a chair than boat structure - the reason for this is that during interpolation, the one allyl fragment has simply been translated over the other and rotation about the central C-C bond has not been considered. This is further confirmed in Figure 15, which shows that the RMS gradient graph did not reach zero. [21115]
 |
 |
We therefore apply some modifications to change the C2-C3-C4-C5 dihedral angle to 0° and the C2-C3-C4 and C3-C4-C5 angle to 100° (figures 16 and 17) and re-run the job.
|
|
|
| Figure 16: Modified Reactant molecule | Figure 17: Modified product molecule |


A TS (QST2) optmisation + frequency calculation was then run in the same way as before on these modified molecules. [21120]
 |
 |
 |
 |
A boat transition state was found successfully. The frequency section of the calculation found there to be a single imaginary frequency mode at -840cm-1, confirming the presence of a transition state.
Teqnique 4: Chair IRC:
- The last technique known as the Intrinsic Reaction Coordinate (or IRC) method was used in order to allow prediction of which conformer the reaction paths from the transition structures will lead to. This creates a series of points by taking small geometrical steps in the direction of the PES area with the highest gradient, allowing us to follow the minimum energy path from a transition structure down to its local minimum on a PES.
An intial calculation is made in which the force constant is calculated once at the beginning. The reaction coordinate was computed only for the forward direction as the reaction coordinate is symmetrical. The number of points along the IRC was set to 50.
The .ckh file for the optimized transition chair structure (TS Berny) under the redundant coordinate method was opened. The IRC job type was selected and the number of points along the IRC was set to 50 (from default of 6).
| Image of Chair after IRC | Summary table | IRC Pathway and Gradient |
|---|---|---|
 |
 |
 |
| [21125] | ||
- The summary table shows the total energy of the transition state to be -231.6894, which is less stable than some of the conformers found in the first part of the module (and in Appendix 1). Therefore, the IRC has not found the most stable conformer.
- The three methods are then applied to improve the results of this IRC calculation:
IRC Method 1:
We take the last point on the previous IRC (step 29) and run a normal minimisation on this (3-21G/HF method). This is quick, but if we are not close enough to a local minimum, we may end up at the wrong minimium.
| Summary table | Diagram of Optimised Transition state | RMS Gradient and total energy |
|---|---|---|
 |
 |
 |
| [21141] | ||
 Item               Value     Threshold  Converged?
 Maximum Force            0.000003     0.000450     YES
 RMS     Force            0.000001     0.000300     YES
 Maximum Displacement     0.000184     0.001800     YES
 RMS     Displacement     0.000061     0.001200     YES
 Predicted change in Energy=-4.266345D-10
 Optimization completed.
    -- Stationary point found.
- The Point Group of the optimised molecule when symmetrize'd in Gaussian was C2.
- The energy was -231.6917 a.u which is identical to the energy of the gauche 2 conformer optimised at this level previously, suggesting that the transition state here is the gauche 2 conformer.
- Also, the RMS gradient has decreased significantly to 0.00000171 signifying that a more successful optimisation has been performed than the previous IRC calculation above.
IRC Method 2:
The IRC was redone, this time using 150 points until it reaches a minimum. From analysis of the first IRC run- the calculation terminated after 29 steps and so increasing the number of points to 150 is expected to give the same result as when 50 points were specified.
This is what is observed:
| Summary table | Optimised Transition state | RMS Gradient and total energy graphs |
|---|---|---|
 |
 |
 |
| [21146] | ||
- Again the summary table shows the Energy is -231.68944 a.u which is still not as stable as some of the conformers found in the first section of this module. Therefore, the most stable conformer has not been found using this IRC method.
IRC Method 3
The IRC was again redone, this time computing the force constants at every step. This is the most reliable option but is also expensive and is not always feasible for large systems.
| Diagram for 1st step of IRC | Diagram for last step of IRC | Summary table | IRC Pathway and Gradient Graphs | Dihedral angle |
|---|---|---|---|---|
 |
 |
 |
 |
 |
| [21149] | ||||
- The summary table shows the energy is -231.69158 which is lower than the energy reported for the previous IRC calculation. This energy is also extremely close to the energy reported for the gauche 2 conformer in Appendix 1 and therefore it is assumed that this IRC calculation has reported the gauche 2 conformer as the most stable.
- The RMS gradient is 0.00015 which is below the threshold value of 0.01 and so a minimum point has been confirmed.
- The dihedral angle of the molecule is 67.19° and the point group was C2 which also matches that of the Gauche 2 conformer.
Activation Energies of the "Chair" and "Boat" structures
The HF/3-21G (TS(Berny)) were compared to those optimized using B3LYP/6-31G(d) (calculated from the optimized HF/3-21G structures). The thermochemistry results from these optimizations were then used to find the activation energies for each transition state calculated. The energies of the starting “anti2” conformer and both the chair and boat transition states were calculated at 0k.
- 1 hartree = 627.509 kcal/mol
| HF/3-21G level | B3LYP/6-31G* level | |||||||||||
|---|---|---|---|---|---|---|---|---|---|---|---|---|
| log File | Electr. energy | Sum of electr. and zero-point energies (0K) | Sum of electr. and thermal energies (298.15K) | Sum of electr. and thermal enthalpies | Sum of electr. and free thermal enthalpies | log File | Electr. energy | Sum of electr. and zero-point energies (0K) | Sum of electr. and thermal energies (298.15K) | Sum of electr. and thermal enthalpies | Sum of electr. and free thermal enthalpies | |
| Reactant (APP2) | [21006] | -231.69254 | -231.53954 | -231.53257 | -231.53162 | -231.57092 | [21030] | -234.61172 | -234.46918 | -234.46183 | -234.46089 | -234.50075 |
| Chair TS | [21125] | -231.61932 | -231.46670 | -231.46134 | -231.46040 | -231.49520 | [21156] | -234.55446 | -234.41162 | -234.40516 | -234.40421 | -234.44125 |
| Boat TS | [21120] | -231.60280 | -231.45093 | -231.44530 | -231.44436 | -231.47977 | [21162] | -234.54046 | -234.39850 | -234.39257 | -231.39163 | -231.42733 |
Table 10: Summary of activation energies (Kcal/mol)
| HF/3-21G | B3LYP/6-31G* | Experimental | |
| ΔE (Chair) | 45.95 | 35.93 | 33.5 ± 0.5 |
| ΔE (Boat) | 56.31 | 54.35 | 44.7 ± 2.0 |
- This analysis reveals that the Boat Transition state has the larger activation energy and thus is the least favoured TS structure for the reaction.
The Diels Alder Cycloaddition
In the above section, the [3,3] Cope rearrangement reaction was studied and the activation energies were determined through analysis of the transition states. The same methods will now be used to analyse two pericyclic type reactions. These are defined as Diels-Alder reactions which involves a 4π diene system reacting in a concerted fashion (via one transition state) with a 2π dienophile.
Two types of cycloaddition reactions will be studied;
- A Prototypical Reaction between Cis-Butadiene and Ethylene where there are no secondary orbital effects to consider (Figure 18).
- A more complex Diels Alder reaction which has the involvement of substituents that bring about secondary orbital effects (Figure 19).


The formation of new bonds is subject to sufficient overlap of the HOMO on one reactant and the LUMO on the other, with the reaction only being allowed if the orbitals are of the same symmetry and overlap well with one-another with a small energy difference between the overlapping frontier orbitals.
Semi-Empirical AM1 Method
This method of calculation is much faster than ab initio ones, because the number of integrals to be dealt with is greatly reduced by ignoring some and approximating others with the help of experimental quantities, or values from high-level calculations. It is the combination of theory and experiment that makes the method 'semiemprical.'[10]
Semi-Empirical AM1 method Optimisation of Cis-Butadiene and Ethylene
Cis-Buatadiene and Ethylene were both separately optimised using the Semi-Empirical AM1 method and their MO's were analysed to provide information on the interacting orbitals within the Diels Alder reaction.
 |
|
- Optimisation of Cis-Butadiene
 Item               Value     Threshold  Converged?
 Maximum Force            0.000030     0.000450     YES
 RMS     Force            0.000011     0.000300     YES
 Maximum Displacement     0.000370     0.001800     YES
 RMS     Displacement     0.000162     0.001200     YES
 Predicted change in Energy=-9.691157D-09
 Optimization completed.
    -- Stationary point found.
- Optimisation of Ethylene
 Item               Value     Threshold  Converged?
 Maximum Force            0.000129     0.000450     YES
 RMS     Force            0.000035     0.000300     YES
 Maximum Displacement     0.000162     0.001800     YES
 RMS     Displacement     0.000100     0.001200     YES
 Predicted change in Energy=-1.347969D-08
 Optimization completed.
    -- Stationary point found.
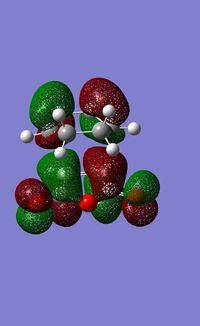
MO Analysis of Cis-Butadiene and Ethylene
Using the DFT Optimised output files, the frontier orbitals of the two molecules were also visualised.
| Molecular Orbital | Molecular Orbital Image | Symmetry of orbital | Energy of Orbital |
|---|---|---|---|
| Cis-butadiene HOMO |  |
Anti-symmetric | - 0.34381 |
| Cis-butadiene LUMO |  |
Symmetric | 0.01707 |
| Ethylene HOMO |  |
Symmetric | -0.38779 |
| Ethylene LUMO |  |
Anti-symmetric | 0.05286 |
| [21169];[21170] | |||
The HOMO of the cis-butadiene and LUMO of the Ethylene are both anti symmetric which allows them to have a favourable orbital overlap. Thus orbital interactions between these frontier orbitals are allowed. The HOMO-LUMO gap is 0.397 (a.u.)
Similarly the LUMO of the cis-butadiene and HOMO of the Ethylene are both symmetric which allows them to have a favourable orbital overlap. Thus orbital interactions between these frontier orbitals are also allowed. However, the HOMO-LUMO gap would be 0.558 (a.u.). This larger HOMO-LUMO gap suggests that the most favourable interaction would be between the HOMO of cis-butadiene and the LUMO of Ethylene which has a smaller energy hap and therefore a larger stabilization energy. Thus this fits with theory where the butadiene acts as the diene and the ethylene as the dienophile.
To further conclude that the HOMO of the butadiene overlaps with the LUMO of the the ethylene during the reaction, we now investigate the transition state.
Transition State Analysis

The transition state of this reaction is thought to have an envelope structure formed by drawing a bicyclo compound and removing the CH2CH2fragment. This is shown in Figure 20. The two fragments separated by the dotted line were optimised firstly using the AM1 semi-empirical method and then repeated using the DFT 6-31G(d) method.
| Method | Semi-Empirical AM1 [21169] and [21170] | DFT B3LYP/6-31G(d) [21266] and [21268]]] |
|---|---|---|
| Cis-Butadiene Optimisation |
|

|
| Ethylene Optimisation | 
|

|
The optimised fragments were then arranged together with an interfragmental distance of 2.1 Å to give a 'guess' of the expected transition structures.
A TS (Berny) Optimisation was then completed for both methods to generate the transition structures.
| Method | Semi-Empirical AM1 [21264] | DFT B3LYP/6-31G(d) [21274] |
|---|---|---|
| Optimized Transition Structure | 
|

|
| Summary Tables |  |

|
| Imaginary Frequency/cm-1 | -956 | -525 |
| Animation of Imaginary Frequency |  |

|
- There is a single imaginary frequency which is indicative of the transition state so the optimisation has been successful towards the transition state instead of the ground state.
- Looking at the RMS gradient, both the optimisations can be concluded to have reached a convergence. This is because both have a gradient significantly lesser than the required 0.001 a.u. of 0.000004 a.u. and 0.000005 a.u. respectively. Thus the results can be concluded to be accurate and successfully optimised towards the transition.
- Analysis of the animations show the ethylene approaching the terminal end of the cis-butadiene, and during this there is the back-bending of the hydrogens. This could be due to the loss of bond order (2 to 1) which results in an sp2 towards sp3 carbon center so the bond angles increase.
The ethylene approaches in a synchronous fashion which reveals that the reaction is a concerted mechanism which is as expected for a cycloaddition. The elongation of the double bonds on the cis-butadiene indicate a lower bond order; bond breaking occurs. Similarly the c-c (2 and 3) are seen to get shorter as the ethylene approaches which is indicative of higher bond strength and hence a higher bond order (double bond). From this it can be seen that the TS(Berny) methods have successfully optimised towards the envelope-shaped transition state of the cycloaddition.
| Property | AM1 (Å) | DFT (6-31G(d)) (Å) |
| Terminal C-C fragmental separation | 2.12 | 2.27 |
| C-C Bond length in Ethene fragment | 1.38 | 1.38 |
| C-C bond length in diene fragment | 1.38 | 1.38 |
- Typical sp3 C-C bond length/Å = 1.53[11]
- Typical sp2 C-C bond length/Å = 1.35[12]
- Typical VDW radius/Å =1.70[13]
- Analysis of this geometrical data shows the following:
- All the C-C single bonds are 1.38Å which is shorter of the ideal length of 1.53Å.
- All the C=C double bonds are slightly longer than the ideal length of 1.35Å.
- These differences suggest that the transition structure obtained has bonds which are changing from sigma to pi forms. (The transition structure lies between the reactant and products).
- The distance between the terminal carbons of the two fragments is 2.12Å and 2.27Å which is longer than the ideal C-C bond length, but within the van der Waals contact radius*2 of 3.40Å, which implies that there is overlap of electron density between the terminal carbons.
Comparison of the two methods reveals that DFT gave geometrical results in exact agreement with literature. The AM1 results only differed significantly from literature for the interfragmental distance.
Confirmation of obtaining the correct Transition Structure
IRC Analysis
An IRC of this Diels Alder cycloaddition reaction starting from the transition state optimised using the DFT method above was run in the forward directions, with force constants calculated at every step. [21287]
 |
 |
 |
The graphs reveal that the total energy plateau's off which indicates the convergence to a stationary point. The first and final steps in the optimisation shows that the final step has the exact conformation of the expected transition state. Therefore, it can be concluded that the optimisation was successful in both the methods used.
Molecular Orbital Analysis: HOMO and LUMO of the Transition State
The Semi-Empirical AM1 method was then used to compute the HOMO and LUMO of the transition state structure:
| Parameter | HOMO of Transition State | LUMO of Transition State |
|---|---|---|
| Image of MOs |  |
 |
| Energy of MO (a.u) | -0.324 | 0.023 |
| Symmetry of MO | Asymmetric | Symmetric |
- The Asymmetric HOMO is formed from an overlap between the LUMO of Ethylene and the HOMO of the 1,3-Butadiene orbitals.
- The Symmetric LUMO if formed from an overlap between the HOMO of Ethylene and the LUMO of 1,3-Butadiene orbitals.
Pericyclic reaction between 1,3-Cyclohexadiene + Maleic Anhydride
In order to investigate the regioselectivity of the diels alder cycloaddition, the reaction of cyclohexa-1,3-diene and maleic anhydride is studied. This reaction can result in either the formation of the endo or exo product and it is expected that the endo product is the kinetic product. Although the exo product is more stable (thermodynamically), there is a secondary orbital interaction in the endo form which stabilises the transition state. The DFT method is used to investigate the regioselectivity as it takes electron correlation into account and has been shown to give the most accurate results so far. The mechanism of this reaction can be seen in figure 19 above.
Optimisation and MO Analysis
The reactants' were both optimised using the DFT B3LYP/6-31G(d) level and the frontier orbitals of both reactants were also visualized.
Results of Optimisation:
Cyclohexadiene- [21300]
Maleic Anhydride- [21301]
 |
 |
 |
 |
- MO Analysis
 |
 |
 |
 |
- For the cyclohexa-1,3-diene, the HOMO is symmetric and has a node in the middle. However, there are also bonding interactions, making this orbital weakly bonding overall. The LUMO is visibly symmetric, and the nodes make the orbital antibonding overall.
- For the maleic anhydride, the HOMO is symmetric and largely bonding due to good overlaps between atoms around the ring. The LUMO, however, is antisymmetric, with nodes on the C=C and two C=O bonds causing it to have an overall antibonding character.
- In this reaction, the dienophile (Maleic Anhydride) is significantly electron poor due to the electron withdrawing nature of the oxygens present. This helps explain why this reaction is easy. The diene (cyclohexadiene) is electron rich, and so we would expect the HOMO of the diene to interact favourably with the LUMO of the dienophile. The diagrams above reveal that both these orbitals are antisymmetric and thus this interaction is symmetry allowed and therefore possible. Furthermore, the two MOs are similar in energy, and so their interaction energy ΔEi is small (stabilisation energy Estab is large), thus this is a very favourable interaction
Transition State Analysis
The Optimised fragments were then orientated together in such a way as to increase the likelihood of finding the exo and endo transition states:

This 'guess' transition states for both exo and endo products were then optimised via the frozen reaction coordinate method, setting the expected partly formed bonds to 2.2Å. and then optimised to a TS(Berny).
| Summary table | Optimised Structure | Imaginary Vibration | Animation of the imaginary frequency (-447cm-1) | HOMO at -0.24231 a.u | LUMO at -0.06772 a.u | Electronic Energy (a.u) |
|---|---|---|---|---|---|---|
 |
 |
 |
 |
 |
 |
-612.68340 |
| [21337] | ||||||
| Summary table | Optimised Structure | Imaginary Vibration | Animation of the imaginary frequency (-447cm-1) | HOMO at -0.24220 a.u | LUMO at -0.07836 a.u | Electronic Energy (a.u) |
|---|---|---|---|---|---|---|
 |
 |
 |
 |
 |
 |
-612.67931 |
| [21344] | ||||||
- The results show that the gradient was well below the threshold value for both structures and therefore the optimisations were considered successful.
- Only one imaginary frequency was found at -447cm-1 and -449cm-1 which concludes that a TS was successfully found for both 'endo' and 'exo' products.
- The partly formed bond distances are 2.27Å and 2.29Å for the Endo and Exo TS respectively. These values are larger than the sp3/sp2 C-C bond lengths, but shorter than 2*VDW radius. This therefore reveals that the transition state is between the bonded structure and the non-bonded structure.
Further Confirmation of Transition Structure; IRC Analysis
An IRC in both directions was run on the optimised Endo and Exo transition structures to further confirm that the transition structure results in the correct product and to visualise the path of the reaction from reactants to products. The IRC calculation was set to calculate the force constants at every step as this previously proved to be the most accurate method. Also, 100 points along the IRC were computed.
| Transition structure | Molecule at first step of IRC | Molecule at last step of IRC | IRC Path Graph |
| EXO |  |
 |
 |
| ENDO |  |
 |
 |
The results show that the correct product is obtained from the Optimised transition structures (both Exo and Endo) and the expected reactants were also confirmed. From the graphs, you can also see that the Endo product is the most stable compared to the Exo product.
Geometric Analysis of Endo and Exo Transition States

|

|
|||
| Endo TS | Exo TS |
- For the Exo transition state, the front end of the Maleic Anhydride is much further from the C=C bond (3.88A) than in the endo transition state (2.99A). This explains why the C-C forming sigma bonds are longer in the Exo transition state (2.29A) than in the Endo (2.27A).
- The C=C bonds which were previously single bonds (1.39A) are much longer than the typical C=C bond (1.35A) which is due to the molecule being a transition state structure, where the pi bonds are not completely formed or broken.
- When comparing the through space distance of the C=C bond group of MA from the cyclohexadiene, the endo TS has smaller distance of 2.84 Å compared to the Exo that has a sterically more favourable distance of 2.94 Å.
- These steric effects that favour the Exo product are dominated by secondary orbital stabilisations in the endo product- rendering this the kinetically more stable molecule.
Activation Energy of Endo and Exo Transition Structures
- The energies of the two products confirms that the 'endo' product is the kinetic product as it has the lowest energy and therefore is the most stable molecule. To further prove that it is the fastest formed product (i.e kinetic) the activation energies are calculated for the formation of each product using the sum of the electronic energies of the reactants. (Tables ..and..)
| Energy | Cyclohexa-1,3-diene Energy (Hartrees) | Maleic Anhydride Energy (Hartrees) | Sum of Energy (Hartrees) |
|---|---|---|---|
| Electronic Energies | -233.41588 | -379.28954 | -612.70542 |
| Energy | Endo TS Energy | Exo TS Energy |
|---|---|---|
| Sum of electronic energies (a.u) | -612.683397 | -612.67931 |
| Activation Energy (a.u) | 0.02202 | 0.02611 |
| Activation Energy(Kcal/mol) | 13.82 | 16.38 |
- This confirms the expectation that the Endo product is the kinetic product of the reaction as it has the smallest activation energy and thus will be formed more quickly in the reaction than the Exo product. Hence, the selectivity for the Endo product in this reaction is shown.
Secondary Orbital Effects
Numerous literature sources report that the 'endo' product corresponds to the kinetic product.[14] [15]. The product to be formed (exo or endo) depends on the balance between steric effects and secondary orbital overlaps. These secondary orbital overlaps are the interaction of orbitals not involved in the primary bond forming overlaps and bring additional stabilisation to molecules. However, in some cases the presence of a bulky substituent can override this effect, making the endo approach sterically hindered, rendering the exo product as the kinetic product.
These secondary orbital interactions were not visable from only looking at the HOMO and LUMO orbitals of the Exo and Endo TS's as these showed little differences. However, the HOMO-1 orbital of each transition state displays these secondary orbital interactions (indicated by the yellow arrows).

|

|
|||
| Endo HOMO-1 | Exo HOMO-1 |
- The Endo HOMO-1 orbital shows these interactions between the Oxygen atoms and the Pi orbital of the Cyclohexadiene fragment. This interaction is absent in the Exo HOMO-1 orbital due to the 180° rotation of the cyclohexadiene fragment resulting in a loss of this stabilising interaction.
- It is this secondary orbital stabilising interaction that dominates over the steric effects (that favour the Exo TS) that render the Endo product the more favourable kinetic product of the reaction. Therefore, the regioselectivity has been explained.
Conclusion
In this module, Hartree-Fock, DFT and AM1 semi-empirical molecular orbital methods were used to optimise reactants to a transition state. Vibrational analyses of the transition states were performed and the imaginary frequencies explored. IRC paths were also visualised to show that the transition states resulted in the desired products. Finally, activation energies were calculated to explain regioselectivity of a Diels-Alder reaction.
Overall the calculations proceeded successfully and the aims of the module have been achieved - to investigate the performance of Gaussian even further and learn about transition states, which are one of the main focuses of Chemist's research.
References
- ↑ M. Dupuis, P. Mougenot, I. D. Watts, G. I. B. Hurst, and H. O. Villar. Modern Techniques in Computational Chemistry, Chap. 7
- ↑ http://www.chm.bris.ac.uk/pt/harvey/msci_pract/back_qm.html
- ↑ https://wiki.ch.ic.ac.uk/wiki/index.php?title=Mod:phys3
- ↑ A. C. Cope, E. M. Hardy, "The Introduction of Substituted Vinyl Groups.....", Journal of the American Chemical Society, 1940,62, 441, DOI:10.1021/ja01859a055
- ↑ 5.0 5.1 Second Year Conformational Analysis lectures DOI: http://www.ch.ic.ac.uk/local/organic/conf/
- ↑ https://wiki.ch.ic.ac.uk/wiki/index.php?title=Mod:phys3
- ↑ G. Schultz, Istvfin Hargittai, Journal of Molecular Structure, 346, 1995, 63-69, DOI:10.1016/0022-2860(94)09007-C
- ↑ https://wiki.ch.ic.ac.uk/wiki/index.php?title=Mod:phys3
- ↑ http://www.gaussian.com/g_whitepap/qst2.htm
- ↑ Lewars E.G., "Computational Chemistry", Introduction to the theory and applications of molecular and quantum mechanics, Springer Science, 2011.
- ↑ F. H. Allen, O. Kennard, et. al., J. Chem. Soc ., 1987, 2, S1. DOI:10.1039/P298700000S1
- ↑ F. H. Allen, O. Kennard, et. al., J. Chem. Soc ., 1987, 2, S1. DOI:10.1039/P298700000S1
- ↑ A. Bondi., J. Phys. Chem., 1964, 68, 441. DOI:10.1021/j100785a001
- ↑ M. Fox, R. Cardona and N. J. Kiwiet, Steric effects vs. secondary orbital overlap in Diels-Alder reactions MNDO and AM1 studies, J. Org. Chem., 1987, 52 (8), pp 1469–1474. DOI:10.1021/jo00384a016
- ↑ M. A. Fox, R. Cordona and N. J. Kiwiet, J. Org. Chem., 1987, 52, 1469-1474 DOI:10.1021/jo00384a016