Rep:Mod2GL1990
Module 2
Introduction
In this module the analysis techniques used in the previous module are used along with new computational methods. This module focuses slightly more on the 'inorganic' parts of computational chemistry. Computational chemistry is used in 'inorganic' chemistry to model new catalysts and understand the solvent effects around an inorganic molecule.
During this module Gaussian is used to construct molecules and then optimise there structures. The optimised structures can then be analysed in order to determine the different vibrational modes and the occupied and un-occupied molecular orbitals. The calculations are run using the Gaussian 09W program and the results are visualised using GaussView 5. To conduct these calculations the HPC server was used as they required extra computing power.
The optimisation process involves key quantum mechanic concepts. Firstly the Schrodinger equation is used to solve the distribution electron density over the molecule and then the born; the positions of the atoms are assumed to be fixed due to the Born-Oppenheimer approximation which states that electronic motion is instant compared to nuclear motion. After the Schrodinger equation is solved for the electrons it is solved for the nuclei. The nuclei are then moved and the calculation is carried out again.
Investigation of BH3
Optimisation of BH3
A molecule of borane is constructed in GuassView 5.0. The bond lengths between the boron and the hydrogen atoms are lengthened to 1.5Â. The molecule is then optimised using the B3LYP method and a 3-21G basis set.
The summary of the results are shown in figure 1.
Optiomisation_Bh3
File Name = GL1990_BH3_OPT
File Type = .log
Calculation Type = FOPT
Calculation Method = RB3LYP
Basis Set = 3-21G
Charge = 0
Spin = Singlet
E(RB3LYP) = -26.46226348 a.u.
RMS Gradient Norm = 0.00020657 a.u.
Imaginary Freq =
Dipole Moment = 0.0000 Debye
Point Group = D3H
Job cpu time:  0 days  0 hours  0 minutes 5.0 seconds.
Figure 1: The Gaussian Calculation Summary for BH3
This process produced an optimised structure for borane. The calculated bond length is 1.19Â and the optimised H-B-H bond angle is 120o which is the expected bond angle. Both of these values agree with the literature [1], [2]. The bond angle is expected to be 120o because the molecule has the symmetrical D3h point group. This symmetrical point group mean there is no dipole momenet, 0.00 Debye. The point group also shows us the different symmetry which the molecule possesses; borane has 2C3, 3C'2, σh, 3σv and 2S3 symmetry.
From the text based .log file the final set of displacements and forces can be observed. This is the 'real' set of the results and provides more detail than the summary shown in figure 1.
     Item               Value     Threshold  Converged?
 Maximum Force            0.000415     0.000450     YES
 RMS     Force            0.000270     0.000300     YES
 Maximum Displacement     0.001620     0.001800     YES
 RMS     Displacement     0.001053     0.001200     YES

 Predicted change in Energy=-1.070270D-06
 Optimization completed.
    -- Stationary point found.
Figure 2: Evidence that the LOG file confirms that all LOG files converge.
When the structure was optimised the root mean square of the gradient for the force was decreased at 0.001. This indicates that the optimised structure is the energy minimum. Therefor the bond length after the molecule has been optimised is the equilibrium bond length.
The LOG file also shows a more detailed values for the bond lengths of the molecules. These values are more accurate than the length quoted before however they are not necessarily more accurate because of the inaccuracies introduced from the assumptions of the program.
                          ----------------------------
                           !   Optimized Parameters   !
                           ! (Angstroms and Degrees)  !
 --------------------------                            --------------------------
 ! Name  Definition              Value          Derivative Info.                !
 --------------------------------------------------------------------------------
 ! R1    R(1,2)                  1.1935         -DE/DX =    0.0004              !
 ! R2    R(1,3)                  1.1935         -DE/DX =    0.0004              !
 ! R3    R(1,4)                  1.1935         -DE/DX =    0.0004              !
 ! A1    A(2,1,3)              120.0001         -DE/DX =    0.0                 !
 ! A2    A(2,1,4)              120.0001         -DE/DX =    0.0                 !
 ! A3    A(3,1,4)              119.9999         -DE/DX =    0.0                 !
 ! D1    D(2,1,4,3)            180.0            -DE/DX =    0.0                 !
 --------------------------------------------------------------------------------
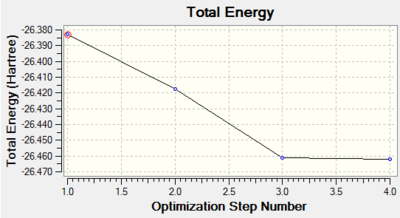
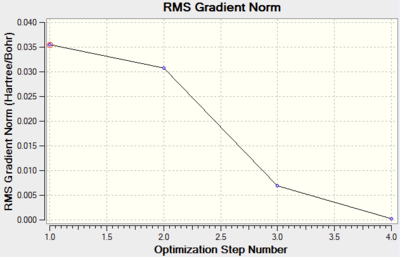
The graphs shows that as the molecule is optimised the energy of the molecule reduces.
Frequency Analysis
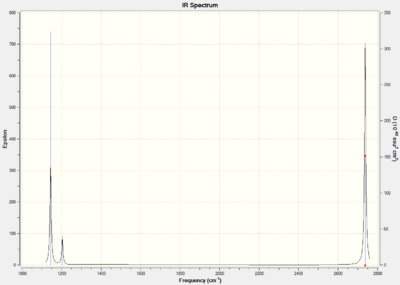
Vibrational analysis of the compound can be calculated in order to determine the degree of optimisation. By analysing the frequency of the vibrations we can calcuate if the molecule is in a transition state or an energy minimum. If all the vibrations are positive the molecule is an energy minimum whereas if some are negative then it is a transition state.
| Vibration Mode | Vibration Frequency (cm-1) | Literature Vibrational Frequency (cm-1) | Vibration |
|---|---|---|---|
| A2” | 1144 | 1148[3] | Show Vibration |
| E' | 1203.64 | 1197[4] | Show Vibration |
| E' | 1203.64 | 1197[5] | Show Vibration |
| A1' | 2598 | Not observed[6] | Show Vibration |
| E' | 2737 | 2602[7] | Show Vibration |
| E' | 2737 | 2602[8] | Show Vibration |
Figure 6: Table of the vibrations for BH3
Three stretches are observed on the infrared spectrum. These stretches are visible because the change the dipole moment of the molecule. By comparing all the stretches calculated with the literature it can be observed that the values are accurate.
The A2” vibration is the lowest vibration (1145 cm-1) and is an umbrealla deformation. The H3 fragment moves above and below the central boron atom. All the B-H bonds remain the same length throughout the vibration.
The next visible vibration represented by a degenerate set of vibrations (1203 cm-1). The first is a scissoring motion, where one of the H and the B stay stationary and the other two hydrogen atoms move towards each other. All the atoms stay in the same plane. The second motion is a rocking motion, where two of the H atoms vibrate in a the same direction around the boron center and the other H atom vibrates in the opposite direction with a larger magnitude. The bond angle between the two H atoms which vibrate in the same direction is maintained.
The final visible vibrations are also degenerate (2737 cm-1). The first is an asymmetric stretch where two of the B-H bonds stretch out of phase with each other. All the atoms are in the same plane. The other vibration involves two B-H bonds stretching out of phase with another. The bond which is out of phase with the other two has a larger displacement.
There is a vibrational frequency which is not observed on the infrared spectrum (2598 cm-1) which corresponds to a completely symmetrical stretch of all of B-H bonds. During the vibrations all the B-H bond lengths remain an equal and in the same plane. Unlike the other vibrations which produce a visible stretch in the infrared spectrum there is no change in the dipole of the molecule.
There is not a negative vibrational frequency which suggests that BH3 molecule is in the ground state.
Molecular Orbitals of BH3
A molecular orbital diagram can be calculated for the optimised structure of BH3.
To produce the molecular orbital diagram the molecule is split into fragments, H3 and B. The fragment/atomic orbitals of the two parts where placed on either side of the molecular orbital diagram. The 1s atomic orbital of boron is ignored in the molecular orbital diagram because it lies too low in energy. The hydrogen orbitals are placed lower in energy than the boron orbitals because hydrogen is more electronegative and as a result the orbitals are lower in energy.

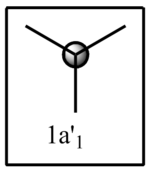
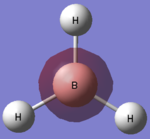
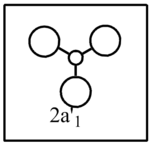
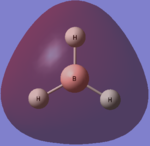
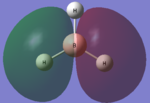
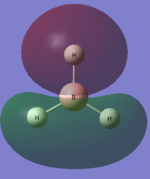
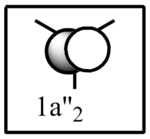
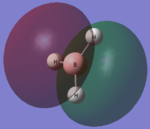
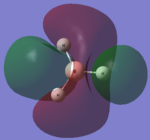
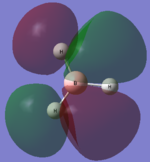
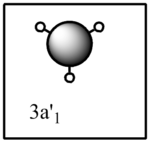
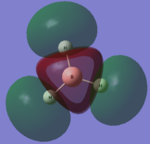
The computed molecular orbital diagram shows 4 filled orbitals, which is expected because there are 8 electrons (5 from boron and 3 from hydrogen). Each molecular orbitals is formed using the linear combination of atomic orbitals. Orbitals 1 to 8 shown in the diagram produced by the computational analysis can be shown in a different manner. A molecular orbital diagram is constructed using ChemDraw Pro and shows the structure of the molecular orbitals.
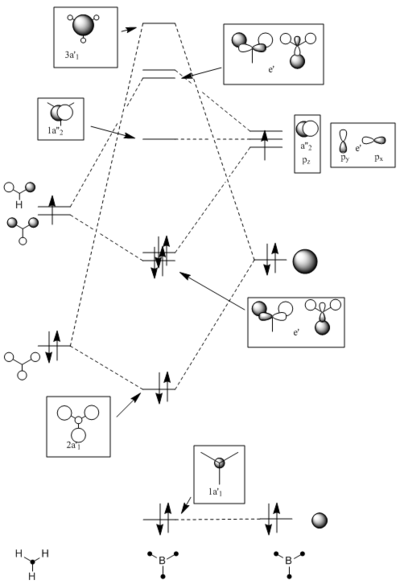
Figure 8: The molecular orbital diagram for BH3
The calculated molecular orbitals show are similar in shape to the orbitals which are suggested as a result of LCAO. This shows that the computational analysis is accurate, however this is just a small molecule and this may not be accurate for large molecules which have significantly more electrons.
| LCAO | Calculated orbital |
|---|---|
 |
 |
 |
 |
 |
  |
 |
 |
 |
  |
 |
 |
Natural Bond Orbital Analysis
The charge distribution and natural bond orbitals can be calculated using the "full NBO" option of the under the NBO tab when running an molecular orbital calculation. Gaussian calculates the charges and NBOs and they can be visulaised using Gaussview 5. Gaussview shows the different charges with different colours. The negatively charged atoms are shown in red and the positivity charged atom is in green.
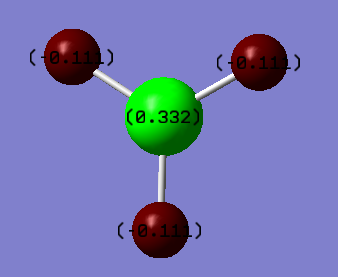
The hydrogen atoms are expected to be more negatively charged than the boron atoms surrounding it because the hydrogen atoms are more electronegative. This supported by the calculations made which show that the boron is positively charged (+0.332) and the hydrogens are negatively charged (-0.111).
From the Log file the charges of the atoms and the nature of the bonding between the two atoms can be seen.
 Summary of Natural Population Analysis:

                                       Natural Population
                Natural  -----------------------------------------------
    Atom  No    Charge         Core      Valence    Rydberg      Total
 -----------------------------------------------------------------------
      B    1    0.19785      1.99962     2.80253    0.00000     4.80215
      H    2   -0.06596      0.00000     1.06582    0.00013     1.06596
      H    3   -0.06595      0.00000     1.06581    0.00013     1.06595
      H    4   -0.06595      0.00000     1.06581    0.00013     1.06595
 =======================================================================
   * Total *    0.00000      1.99962     5.99998    0.00040     8.00000
Figure 10: Summary of natural population analysis for BH3
       (Occupancy)   Bond orbital/ Coefficients/ Hybrids
 ---------------------------------------------------------------------------------
     1. (1.98096) BD ( 1) B   1 - H   2
                ( 46.64%)   0.6830* B   1 s( 33.33%)p 2.00( 66.67%)
                                            0.0000  0.5773  0.0000  0.0000  0.0000
                                            0.0000  0.0000 -0.8165  0.0000
                ( 53.36%)   0.7304* H   2 s(100.00%)
                                            1.0000  0.0005
     2. (1.98096) BD ( 1) B   1 - H   3
                ( 46.65%)   0.6830* B   1 s( 33.33%)p 2.00( 66.67%)
                                            0.0000  0.5774  0.0000  0.0000  0.0000
                                            0.7071  0.0000  0.4082  0.0000
                ( 53.35%)   0.7304* H   3 s(100.00%)
                                            1.0000  0.0005
     3. (1.98096) BD ( 1) B   1 - H   4
                ( 46.65%)   0.6830* B   1 s( 33.33%)p 2.00( 66.67%)
                                            0.0000  0.5774  0.0000  0.0000  0.0000
                                           -0.7071  0.0000  0.4082  0.0000
                ( 53.35%)   0.7304* H   4 s(100.00%)
                                            1.0000  0.0005
     4. (1.99962) CR ( 1) B   1           s(100.00%)
                                            1.0000  0.0000  0.0000  0.0000  0.0000
                                            0.0000  0.0000  0.0000  0.0000
Figure 11: Summary of occupancy for BH3
From the data shown the relative orbital contribution towards the bond between the two atoms can be deducted. The BD column shows this information. For the three bonds in this molecule it can be seen that the hydrogen orbitals contribute more to the bonds. This could of be concluded from the molecular orbital diagram constructed because the Hydrogen fragment is lower in energy than the boron fragment it will contribute more to the bonding orbital. The hybridisation of the boron orbitals can be seen from the occupancy data. Two thirds of the electron density is from the p orbital whereas one third is from the s orbital. Therefore the boron atom is sp2 hybridised which is expected due to the empty p orbital which gives borane its Lewis acid behavior.
Analysis of TlBr3
Optimisation of TlBr3
Similar to borane the Thallium tribromide complex is formed in Gaussview. The DFT-B3LYP method was use with the LANL2DZ basis set to optimise the structure of the TlBr3. The LANL2DZ basis set used in the calculation is a moderate level of accuracy so takes into account the pseudo potentials of the molecule. The pseudo-potentials are taken into account because heavier atoms because they have too many electrons that need to be modeled. The pseudo-potentials make the assumption that the majority of the interactions arise valence electrons therefore these are the electrons which are taken into account when modeling the molecule.
To optimise the structure of the molecule the molecule is placed under a D3h point group constraint and the tolerance is very tight.
The summary of the optimisation is shown in the figuer below.
TlBr3 optimisation
File Name = GL1990_TLBR3_OPT
File Type = .log
Calculation Type = FOPT
Calculation Method = RB3LYP
Basis Set = LANL2DZ
Charge = 0
Spin = Singlet
E(RB3LYP) = -91.21812851 a.u.
RMS Gradient Norm = 0.00000090 a.u.
Imaginary Freq =
Dipole Moment = 0.0000 Debye
Point Group = D3H
Job cpu time:  0 days  0 hours  0 minutes 10.0 seconds.
Such a low RMS gradient norm shows that the optimisation was successful. The bond length was calculated as 2.65Â which is slightly longer than the literature value of 2.51Â[9]. The bond angles are 120o and the dipole moment is 0.00 Debye which are both expected due to the point group set.
         Item               Value     Threshold  Converged?
 Maximum Force            0.001656     0.000450     NO
 RMS     Force            0.001084     0.000300     NO
 Maximum Displacement     0.020850     0.001800     NO
 RMS     Displacement     0.013649     0.001200     NO
 Predicted change in Energy=-5.625298D-05
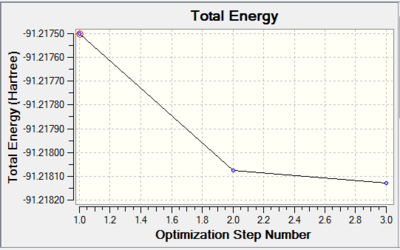
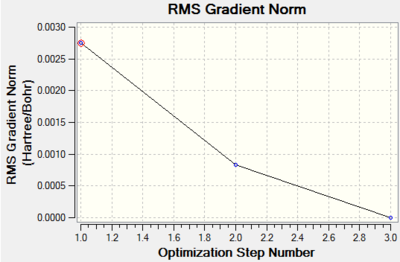
The output data from the Log file shows that the parameters are converging. The total energy graph is shown below.
Frequency Analysis
TlBr3 is analysed using the energy minimum structure. The summary of the computational analysis is shown below.
TlBr3 optimisation
File Name = GL1990_TLBR3_FREQ
File Type = .log
Calculation Type = FREQ
Calculation Method = RB3LYP
Basis Set = LANL2DZ
Charge = 0
Spin = Singlet
E(RB3LYP) = -91.21812851 a.u.
RMS Gradient Norm = 0.00000088 a.u.
Imaginary Freq = 0
Dipole Moment = 0.0000 Debye
Point Group = D3H
Job cpu time:  0 days  0 hours  0 minutes 12.0 seconds.
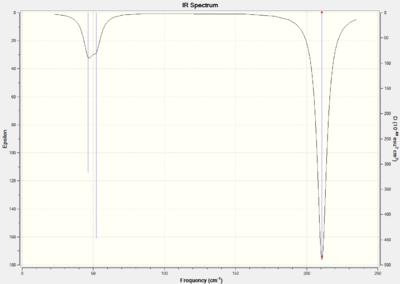
Six vibrational modes were found and are shown in the table below along with their vibrations.
| Vibration Mode | Vibration Frequency (cm-1) | Literature Vibrational Frequency (cm-1) | Vibration |
|---|---|---|---|
| A2“ | 52.1 | 63[10] | Show Vibration |
| E' | 46.4 | 47[11] | Show Vibration |
| E' | 46.4 | 47[12] | Show Vibration |
| A1' | 165 | 185[13] | Show Vibration |
| E' | 211 | 205[14] | Show Vibration |
| E' | 211 | 205[15] | Show Vibration |
Figure 6: Table of the vibrations for BH3
The same vibrations as are present in TlBr3 are shown in BH3. The low frequency degenerate vibrations at 46.4 cm-1 are symmetric scissoring and rocking respectively. During the scissoring motion the thallium and one of the bromine atom stays stationary while the other two bromines swing together. The rocking motion involves two of the bromine atoms vibrating in the same direction around the boron center and the other bromine atom vibrates in the opposite direction with a larger magnitude. The bond angle between the two bromine atoms which vibrate in the same direction is maintained at 120o.
The next lowest vibration (52.1 cm-1) is an umbrella deformation. The three bromine atoms move as a whole fragment above and below the plane of the thallium center. The thallium atom is displaced slightly in the opposite direction to the thallium vibration.
The A1' (165 cm-1) is a completely symmetrical stretch. All the Tl-Br bonds stretch at the same time with the same displacement. This is not shown in the infrared spectrum because there is no change in dipole due to the symmetrical nature of the stretch.
The final set of degenerate stretches occurs are 211 cm-1. One of the stretches is an asymmetric Tl-Br stretch, which involves the symmetrical stretch of two Tl-Br bonds while the other Tl-Br bond is out of phase. The bond which is out of phase has a much larger displacement than the other two bond vibrations. The second bond vibration is an asymmetric Tl-Br stretch, where one Tl-Br does not move and the other two bonds move out of phase with each other.
Low frequencies --- -3.4213 -0.0026 -0.0004 0.0015 3.9367 3.9367
These are the low frequency vibrations which are present in the molecule. The lowest real vibration is the E' mode which is present at 52.1 cm-1. The closer the low frequencies are to 0 is an indicator on how accurate the frequency optimisation was.
What is a Bond?
Gaussview draws bonds between atoms based on the distance between the two atoms. This value is predetermined and does not take into account unique circumstances/properties which a molecule may have. Therefore it is possible that Gaussview may not draw a bond between two atoms which are bonded together. This problem is more prevalent in 'inorganic' structures because the bond lengths are generally longer. The simple method used to describe what is a bond and what is not a bond can not be used to conclusively suggest if a bond is present or not and needs to be investigated further.
If distance between the atoms is not a suitable definition of a bond what is? An ionic bond is an electrostatic attraction between two oppositely charged atoms. Most, covalent bonds are thought to be the overlap of electronically occupied atomic/molecular orbitals. A covalent bond was thought to be the sharing of two electrons between two nuclei, the attraction of the nuclei to the shared electrons causes the bond to form. A bond can incorporate a mixture of the two types of bonds described above. As a result there are a broad range of types of bonds which can exist, all with different bond lengths. This means that it is difficult to define a bond with strict parameters, as is required to describe it computationally.
Isomers of Mo(CO)4(PCl3)2
Isomers of Mo(CO)4L2 have been investigated during the second year synthesis labs. During the labs the different C=O stretches of the ligands were investigated to deduce the structure of the complex. The number of different C=O stretches indicated how many different environments which were present in the complex.
Optimisation of Structures
Both structures were constructed in Gaussview prior to there optimisation. They were first optimised using a 'loose' optimisation procedure. The 'loose' optimisation was used in order to form a good starting point for further optimisations. The B3LYP method was used with a LANL2MB basis set in order to achieve a low level basis set and pseudo potential. The 'loose' optimisation structure was reasonable accurate, here are the log files for cis-[16] and trans-[17].
The 'loose' optimised structures require further optimisation, which is done manually first, see diagram below. In the cis- form one of the axial CO ligands and the chlorides, from the PCl3 group, are set to 0o. In the trans form the dihedral angles between the two of the chlorides is set to 0o so when looking down the P-Mo bond the chloride atoms should overlap.
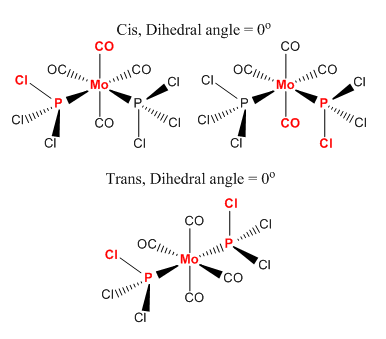
The manually optimised basis set was then optimised using a higher level basis set. The B3LYP method was used however the higher level LANL2DZ basis set was used as well. The geometry was set. In addition to the higher level basis set the convergence criteria were tightened by adding “int=ultrafine scf=conver=9”.
The two optimized structures can be seen from these jmols.
The Logs files which correspond to the full optimisation can be seen by following the following references, cis-[18] trans-[19].
The results summary's are shown below.
Title Card Required
File Name = checkpoint_57031[1]
File Type = .fch
Calculation Type = FOPT
Calculation Method = RB3LYP
Basis Set = LANL2DZ
Charge = 0
Spin = Singlet
Total Energy = -623.57707190 a.u.
RMS Gradient Norm = 0.00001374 a.u.
Imaginary Freq =
Dipole Moment = 1.3114 Debye
Point Group =
Title Card Required
File Name = checkpoint_57030[1]
File Type = .fch
Calculation Type = FOPT
Calculation Method = RB3LYP
Basis Set = LANL2DZ
Charge = 0
Spin = Singlet
Total Energy = -623.57592214 a.u.
RMS Gradient Norm = 0.00001040 a.u.
Imaginary Freq =
Dipole Moment = 0.0051 Debye
Point Group =
The bond lengths for the optimised structures are shown in the table below.
| Bond | Cis- Isomer Bond length, Â | Literature Bond Length, Â | Trans- Isomer Bond length, Â | Literature Bond Length, Â |
|---|---|---|---|---|
| Mo-C | 2.01 | 2.01 [20] | 2.06 | 1.87[21] |
| C-O | 1.18 | 1.15[22] | 1.17 | 1.15[23] |
| Mo-P | 2.51 | 2.58[24] | 2.44 | 2.37[25] |
| P-Cl | 2.24 | No ref. | 2.24 | No ref. |
It wasn't possible to find a reference for the complex being investigated in this part of the module. Therefore values from similar complexes have been looked into and used as the literature comparisons. The bond lengths for the cis complex are from cis- Mo(CO)4(PPh3)2 and the the trans complex are from trans-Cr(CO)4(PPh3)2.
The bond lengths calculated show a good correlation to the literature values, which shows that the calculation has been successful in predicting some of the bonding. The differences between the cis and the the trans isomers are most pronounced when the Mo-P bond is investigated. The cis isomer because as the longer, weaker bond because the PCl3 groups are bulky and try to move away from each other.
Advanced Optimisation of Structures
To make the optimisation calculations more accurate the d-orbitals can be taken into consideration. This is imporatant not only because of the d orbitals present in the Mo but also because phosphorus has the capability to become hypervalent. The input files were changed and the geometry of the complex was optimised in order to take into account the d orbitals, the log files produced are provided, cis-[26] trans-[27] and there summaries are shown below.
Title Card Required
File Name = gl1990_cis_tight_opt_adv
File Type = .fch
Calculation Type = FOPT
Calculation Method = RB3LYP
Basis Set = GEN
Charge = 0
Spin = Singlet
Total Energy = -623.69291230 a.u.
RMS Gradient Norm = 0.00001314 a.u.
Imaginary Freq =
Dipole Moment = 0.0760 Debye
Point Group =
Title Card Required
File Name = gl1990_trans_tight_opt_adv
File Type = .fch
Calculation Type = FOPT
Calculation Method = RB3LYP
Basis Set = GEN
Charge = 0
Spin = Singlet
Total Energy = -623.69396728 a.u.
RMS Gradient Norm = 0.00002214 a.u.
Imaginary Freq =
Dipole Moment = 0.0040 Debye
Point Group =
Again all the bond lengths are compared to the literature values after the d orbitals were taken into account.
| Bond | Cis- Isomer Bond length, Â | Literature Bond Length, Â | Trans- Isomer Bond length, Â | Literature Bond Length, Â |
|---|---|---|---|---|
| Mo-C | 2.02 | 2.01 [28] | 2.06 | 1.87[29] |
| C-O | 1.18 | 1.15[30] | 1.17 | 1.15[31] |
| Mo-P | 2.48 | 2.58[32] | 2.42 | 1.15[33] |
| P-Cl | 2.11 | No ref. | 2.12 | No ref. |
The bond lengths of optimised complex which takes d orbitals into account shows a close agreement with the literature values. The addition of d orbitals to the calculation means that the properties of the phosphours are better accounted for during the calculation. There is a slight change in the Mo-P bond length which is due to the donation of electron density to the phosphorus from the molybdenum which forms a stronger bond as the phosphorous can accommodate the extra electron density.
The carbonyl ligand is able to accept electron density into its π* orbital in order and as a result the C-Oπ bond becomes weaker whereas the Mo-C bond becomes stronger. When the d orbitals are modeled in this calculation the the trans effect can be seen. The phousphours ligand is able to donate electrons back to the metal which means there is more electron density on the metal and as a result there is more back bonding to the π* orbital of the CO ligand.
Again the largest difference between the two isomers is observed between the Mo-P bond lengths.
Frequency Analysis of Mo(CO)4(PCl3)2
The optimised structure which did not take the d orbitals into consideration is analyised using the Scan system in order to calculate the Vibrations. Unlike the molecules which have been analysied in the first part of this module there are many different vibrations (i.e. using 3N - 6 to find the number of vibrational modes for a non-linear molecule, where N = number of molecule. There are 45 vibrations). The vibrations which are responsible for each bond are investigated and used to first ensure that the structure has been optimised correctly and secondly to compare to the literature values for the stretches.
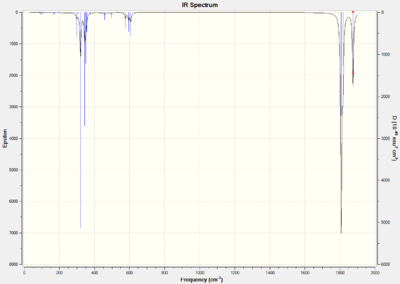
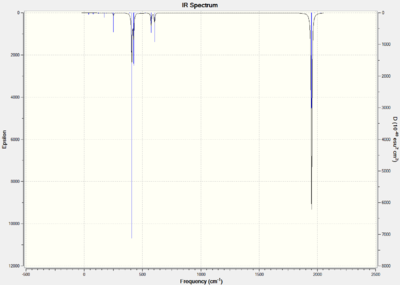
For the trans isomer it is expected that there will only be one C=O peak because all the carbonyl ligands are in the same environment. However for the cis isomer all the C=O stretches will be different because they are all in the different environments. The predicted infrared spectrums are shown below and the log files for the calculations are provided, cis-[34] trans- [35].
The cis isomer
Title Card Required
File Name = gl1990_cis_tight_freq
File Type = .fch
Calculation Type = FREQ
Calculation Method = RB3LYP
Basis Set = LANL2DZ
Charge = 0
Spin = Singlet
Total Energy = -623.54227312 a.u.
RMS Gradient Norm = 0.01802714 a.u.
Imaginary Freq =
Dipole Moment = 3.0803 Debye
Point Group =
The trans isomer
Title Card Required
File Name = gl1990_trans_tight_freq
File Type = .fch
Calculation Type = FREQ
Calculation Method = RB3LYP
Basis Set = LANL2DZ
Charge = 0
Spin = Singlet
Total Energy = -623.57592214 a.u.
RMS Gradient Norm = 0.00001035 a.u.
Imaginary Freq =
Dipole Moment = 0.0051 Debye
Point Group =
Comparisons of the Vibrations
The vibrational frequencies of the optimised structures for the structures which taken into account the d orbitals are analysied for the cis and trans isomers respectively. The vibrational modes are determined using the point groups of each complex. The cis isomer has a C2v point group and the trans isomer has a D4h point group.
Firstly the cis isomer is analysed.
| Vibrational Mode | Vibrational Frequency, initial analysis, cm-1 [Intensity] | Literature Vibration, cm-1 | Vibration Animation |
|---|---|---|---|
| PCl3 scissor bend | 56.0 [0.1] | - | Show Vibration |
| PCl3 twist | 61.9 [0.1] | - | Show Vibration |
| b2' | 1807 | 1869[36] | Show Vibration |
| b2 | 1808 | 1896[37] | Show Vibration |
| a1' | 1817 | 1924[38] | Show Vibration |
| a1' | 1874 | 2026[39] | Show Vibration |
Secondly the trans isomer is analysed.
| Vibrational Mode | Vibrational Frequency, initial analysis, cm-1 [Intensity] | Literature Vibration, cm-1 | Vibration Animation |
|---|---|---|---|
| PCl3 bend, 1 | -2.11 [0.0] | - | Show Vibration |
| PCl3 bend, 2 | 3.14 [0.0] | - | Show Vibration |
| eu | 1950 [1476] | 1886[40] | Show Vibration |
| eu | 1951 [1476] | 1886[41] | Show Vibration |
| b1g | 1977 [0.0] | 1933[42] | Show Vibration |
| a1g | 2031 [0.0] | 2050[43] | Show Vibration |
The calculated frequencies shown for carbonyl peaks are close the to literature values. Therefore confidence in the different values can be taken. From the investigation is is clear there are 4 difference C=O stretches which was expected. The calculations have therefore taken to the different environments into consideration in order to calculate the frequencies of the vibrations. The trans isomer only has one C=O stretch which is also expected because all the carbonyl groups are in the same environment.
In the trans isomer the b1g and a1g stretches have a very low intensity because there is very little change in dipole. There are two other C=O vibrations present in the vibration frequency table however only one peak is observed in the infrared spectrum because the vibrations are degenerate.
The major difference between the molecule which has been been optimised to include d orbitals occurs at the low frequency vibrations. These vibrations involve the PCl3 group. All the frequencies of the vibrations which have had the d orbtials included are larger than when the d orbitals are not included. This implies that the bonds are stronger because the d orbitals have been taken into consideration.
MiniProject
Introduction
All the forms of analysis explored in the other parts of the module are included in the analysis of the mini project. These analysis techniques are used in order to predict the bonding of a molecule. They can be compared to practically obtained values for bond lengths, vibrational frequencies and bond angles. This sort of analysis is common in organic compounds however the situation is different in inorganic compounds as the bond lengths are longer and the compounds involved can coordinate to more than four atoms due to the presence of d atomic orbitals.
In this mini project dimers of boron complexes are investigated. The simplest diborane B2H6 complex is modeled in order to understand the basic bonding. This complex is interesting because the boron atom could be assumed to be sp3 hybridised and form a structure similar to ethane. This structure is not possible as the complex only has 12 electrons, where as 14 electrons would be required in order to form all 7 bonds. This problem was resolved by a new structure which was proposed, where the two bridging hydrogens formed 3 centered- 2 electron bonds.
The dimers of the boron hydrides have been investigated and will be compared to boron halides. The halides have many more electrons and are being investigated in order to see if the same sort of binding can be predicted.
Diborane
Diborane is a simple structure which contains two bridging hydrogens along with a BH2 unit at either end. Its structure will first be optimised and then the molecule orbitals will be investigated.
Optimisation
The diborane molecule was first drawn in ChemBio 3D and then transferred to Gaussview for geometry optimisation. The structure was optimised using the DFT/B3LYP method using the LANL2DZ basis set.
The summary of the optimisation can be seen below and its log file DOI.
Title Card Required
File Name = gl1990_dibor_opt_out1
File Type = .fch
Calculation Type = FOPT
Calculation Method = RB3LYP
Basis Set = LANL2DZ
Charge = 0
Spin = Singlet
Total Energy = -53.2604086 a.u.
RMS Gradient Norm = 0.00002978 a.u.
Imaginary Freq =
Dipole Moment = 0.0000 Debye
Point Group =
The bond lengths and the bond angels from the optimised diborane compound are compared to literature in order to test the accuracy of the calculation. These values can also be used in order to compare them to values obtained for the halides.
| Bond | Bond Length, Â | Triatomic Bond | Bond Angle (o) |
|---|---|---|---|
| B-H (bridging) | 1.34 | H-B-H (bridging) | 85.4 |
| B-H (terminating) | 1.19 | H-B-H (terminating) | 123 |
The point group of the molecule is D2h because it has C2(x), C2(y), C2(z), σ(xy), σ(yz).
Molecular Orbital Analysis
The energies of the molecular orbitals are calculated using the same method as was used for BH3. The energies of the orbitals 1-12 are shown in the diagram below. Orbitals 1-8 are occupied and orbitals 9-12 are unoccupied. The energies shown in the table are given in Hartrees.
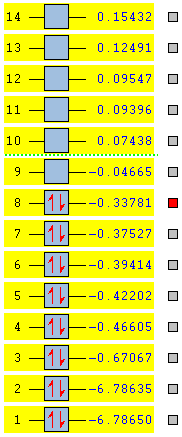
This calculated molecular orbitals which are produced are compared with the a molecular orbital diagram which is constructed using linear combination of atomic orbitals to predict the energy levels. The molecule was split in to a H2 fragment and two BH2 fragments.
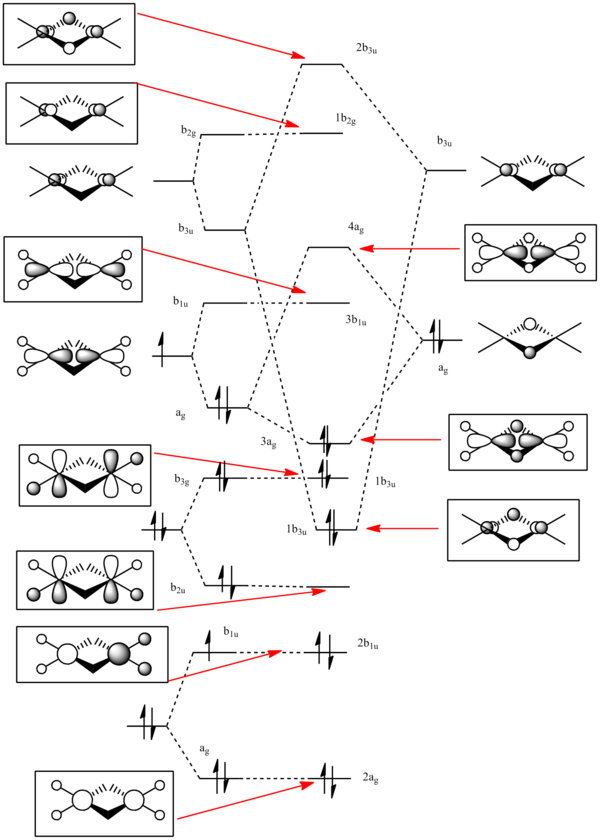
The calculated atomic orbitals which refer to each orbital are in the table below. The first two energy orbitals from the computational analysied molecular orbital diagram are ignored because they have a significantly lower energy.
| LCAO | Calculated orbital |
|---|---|
| 2ag |  |
| 2b1u |  |
| 1b2u | 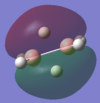 |
| 1b3g |  |
| 1b3u |  |
| 3ag |  |
| 3b1u |  |
| 4ag |  |
| 1b2G | 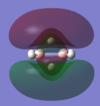 |
| 2b3u |  |
By using both molecular orbital diagrams some of the properties of diborane can be explain. Firstly, the LUMO(3b1u) is a non-bonding orbital so if a lone pair of electrons are added to the molecule there would not be a significant destabilisation effect. This makes diborane a strong Lewis acid. The three center two electron bond is also possible because of this non bonding orbital.
The computationally formed atomic orbitals correspond well with the orbitals formed from the linear combination of atomic orbitals, which shows that the computational analysis is accurate for molecules with more complex bonding.
B2Cl4Br2
In order to investigate the effect of different atoms bonded to the boron center the hydrogens are replaced with halides. There are three different conformations of B2Cl4Br2 which will all be investigated; bridging, cis and trans. The differences and similarities between the three conformations and diborane will be shown.

Optimisation
The isomers are all optimised in the same way as for diborane so that the values can be compared. Firstly the compounds were constructed in ChemBio 3D before being imported to GaussView where the structure was optimised using method B3LYP and the LANL2DX basis set. The summaries of the optimisations are shown below along with there log files, bridging[44], cis[45], trans[46].
Title Card Required
File Name = gl1990_bridging_opt_out
File Type = .fch
Calculation Type = FOPT
Calculation Method = RB3LYP
Basis Set = LANL2DZ
Charge = 0
Spin = Singlet
Total Energy = -135.94859385 a.u.
RMS Gradient Norm = 0.00001765 a.u.
Imaginary Freq =
Dipole Moment = 0.0000 Debye
Point Group =
Title Card Required
File Name = gl1990_cis_opt_out
File Type = .fch
Calculation Type = FOPT
Calculation Method = RB3LYP
Basis Set = LANL2DZ
Charge = 0
Spin = Singlet
Total Energy = -135.94531490 a.u.
RMS Gradient Norm = 0.00001270 a.u.
Imaginary Freq =
Dipole Moment = 0.6697 Debye
Point Group =
Title Card Required
File Name = gl1990_trans_opt_out
File Type = .fch
Calculation Type = FOPT
Calculation Method = RB3LYP
Basis Set = LANL2DZ
Charge = 0
Spin = Singlet
Total Energy = -135.94530097 a.u.
RMS Gradient Norm = 0.00004148 a.u.
Imaginary Freq =
Dipole Moment = 0.0001 Debye
Point Group =
By looking at the different energires of the molecules it can be seen that they are all similar. Although the engergies are similar, the slight differences in the energies which can be qualified. The bridging isomer is highest in energy because it has the large bromine atoms in the bridging positions which causes streic hindrance. The cis and trans isomers are slightly lower in energy because the smaller chlorine atoms are in the bridging position. From investigating the bonding orbitals present in both the cis and trans isomers they are similar shapes and sizes which is expected seen as the compounds have a similar energy.
The different structures have different dipoles depending on there structure. The dipole is caused by a the positions of the bromine atoms in the structure because the bromine atoms have a smaller electronegative than the chlorine atoms and as a result will not be as negatively charged.. If the bromine atoms are on opposite sides of the structure like in the cis structure the molecule is symmetrical and therefore the charge is not unevenly distributed. The same is true if the bromine atoms are bridging as the molecule is symmetrical again. A dipole is present in the trans isomer because the bromine atoms are on the same side of the structure, therefore there is a charge gradient from one side of the molecule to the other.
The bond lengths and bond angles of each complex are measured after the optimisation and are shown in the table below.
Bridging
| Bond | Bond Length, Â | Triatomic Bond | Bond Angle (o) |
|---|---|---|---|
| B-Br (bridging) | 2.25 | B-Br-B (bridging) | 86.9 |
| B-Cl (terminating) | 1.82 | Cl-B-Cl (terminating) | 120 |
Cis
| Bond | Bond Length, Â | Triatomic Bond | Bond Angle (o) |
|---|---|---|---|
| B-Cl (bridging) | 2.11 | B-Cl-B (bridging) | 89.4 |
| B-Cl (terminating) | 1.80 | Cl-B-Br (terminating) | 121 |
| B-Br (terminating) | 1.96 | - | - |
Trans
| Bond | Bond Length, Â | Triatomic Bond | Bond Angle (o) |
|---|---|---|---|
| B-Cl (bridging) | 2.11 | B-Cl-B (bridging) | 89.4 |
| B-Cl (terminating) | 1.80 | Cl-B-Br (terminating) | 121 |
| B-Br (terminating) | 1.96 | - | - |
By comparing the three structures the differences between them can be see. The cis and trans isomers have exactly the same bond angles and bond lengths which is mainly due to the bridging chloride atoms. The bridging ligands significantly effect the bond angles and bond lengths. The bond length between the boron and the bridging bromine is long than if the boron was bound to a chloride atom. This is because bromine is larger and has a more diffuse electron cloud and therefore forms a weaker bond with the boron. The bond angle between the bridging atoms is a lot smaller then the bond angle in the cis or trans isomer. This is due to the steric size of the bromine atoms which will sterically repel each other and move away from each other. This can be seen in a different way by measuring the distance between the two bridging bromine atoms (3.26Â) and comparing it to the the distance between the two bridging chlorides (3.01Â).
Vibrational Analysis
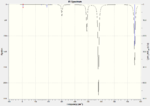
The frequency analysis of each isomer was conducted using the same method as used before. The B3LYP method was used with the LANL2DZ basis set for all the isomers so that the values obtained could be compared. The log files of each frequency analysis is provided, cis[47], trans[48], bridging[49].
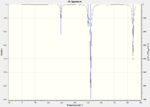
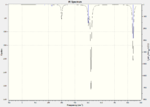
The three vibrations of boron atoms along each plane are measured for each isomer. These vibrations are shown below and have been chosen because they are present in all three structures.
| Vibration Mode | Vibration Description |
|---|---|
| 1) The vibration of the boron atoms forward and back in the same plane as the bridging halogens. | Show Vibration |
| 2) The vibration of the boron atoms in the same plane as the bridging halogens towards and away from the terminal BH2 units. | Show Vibration |
| 3) The vibration of the boron atoms out of the plane of the bridging halogens. | Show Vibration |
| Vibrational Mode | Bridging Isomer Vibrational Frequency, cm-1 [Intensity] | Cis Isomer Vibrational Frequency, cm-1 [Intensity] | Trans Isomer Vibrational Frequency, cm-1 [Intensity] |
|---|---|---|---|
| 1 | 301 [158] | 295 [162] | 299 [107] |
| 2 | 491 [195] | 501 [195] | 501 [252] |
| 3 | 579 [915] | 521 [908] | 521 [847] |
The distance and strength of the bond can be deduced as a result of the frequency analysis. The stronger the bond the large the frequency of the vibration.
Vibration 1 stretches in the plane of the bridging halides towards each bridging halogen. The bridging bond is the bond which stretches most during this vibration however the terminal bonds also stretch slightly. All three of the isomers have similar vibrational stretch frequencies due to the stretches involving the whole molecule therefore it is difficult to distinguish between the isomers.
Vibration 2 involves the stretching of the bridging ligands mainly as the boron atoms vibrate towards the terminal BH2 groups. The frequencies of the vibratiosn for the cis and trans isomers are the same because identical bonds are been stretched by the same distance. The frequency of the vibrations for the bridging isomer is lower than for the cis and trans because the B-Br bridging bonds are the significantly stretch during the vibration. This supports the theory that the B-Br bond is weaker and longer than the B-Cl bond because they have a smaller vibration.
Vibration 3 involeves the displacement of the boron atoms above and below the plane of the bridging halogens. Therefore the terminal bonds are stretched the most. As concluded from vibration 2 the bonds which involve a B-Br stretch will have a lower vibrational frequency. As a result the bridging isomer has a significantly higher vibrational frequency because the bromine atoms are in the bridging position and therefor the B-Br stretch has a minimal effect of the frequency. However the cis and trans isomers both have B-Br bonds on in the terminal positions which significantly stretch during the vibration. The cis and trans isomer have the same value for the frequency of the stretch because the same bonds are being stretched in the vibration just in a different order.
| Bridging Isomer | Cis Isomer | Trans Isomer |
|---|---|---|
 |
 |
 |
Molecular Orbital Analysis
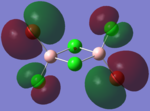
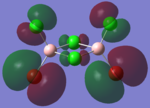
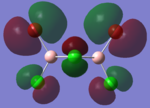
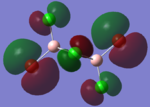
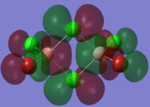
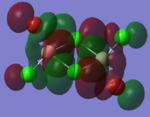
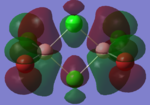
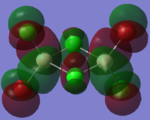
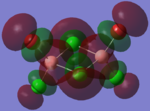
The molecular orbitals of the isomers around the HOMO and LUMO are analysed to see if any differences in the different isomers could be observed. They are shown in the table below in order to see if different structural properties and vibrational differences can be explained from the molecular orbitals. cis[50], trans[51], bridging[52].
| Molecular Orbit | Bridging Isomer | Cis Isomer | Trans Isomer |
|---|---|---|---|
| HOMO -2 | 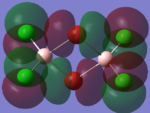 |
 |
 |
| HOMO -1 | 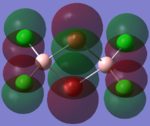 |
 |
 |
| HOMO | 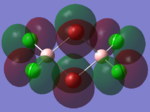 |
 |
 |
| LUMO | 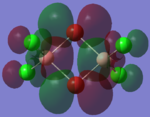 |
 |
 |
| LUMO +1 | 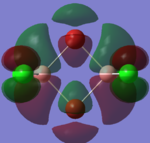 |
 |
 |
| LUMO +2 | 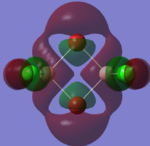 |
 |
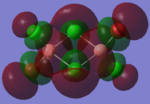 |
By looking at the molecular orbitals chosen as a whole the similarities between the cis and trans isomers can be seen. This is expected because they have similar properties so there orbital arrangement and properties would be expected to be similar. The cis and trans isomers are only different because terminal bromine atoms are in different places, however this difference does not effect the bonding between the two BClBr fragments with the Cl2 central fragment.
The bridging isomers seem to have different structures to the cis and trans isomers. However the visual difference in the structure is due to the difference in the size of the bromine and chloride orbitals.
The HOMOs of the bridging isomer are different to the cis and trans isomers as the orbitals are significantly more diffuse. Therefore there the orbitals from the bridging ligand are closer to the orbitals from the terminal atom and the antibonding interaction is larger. Therefore this orbital is higher in energy and the molecule is less stable.
When analysing the LUMOs of all three isomers the differences the structures seem similar. The orbitals of the bridging orbitals are a similar size. Therefore all the orbitals have a similar energy.
Charge Distribution and Naural Bond Orbitals
The charge distribution of the isomers is analysed using the full NBO option as explained before. These calculations are used to calculate the charge and the natural bond orbitals of the molecule.
| Bridging Isomer |  |
|---|---|
| Cis Isomer |  |
| Trans Isomer | 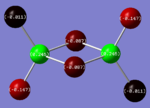 |
| Diborane |  |
The charges present on each atom in the structure can be seen in each image. Diborane is shown in the table to allow the values to be compared to a standard.
Firstly the symmetrical nature of the bridging and trans isomers can be seen from the diagrams. These isomers have no dipole across the whole molecule and this can be seen by viewing the charge distribution. The uneven charge distribution of the cis isomer can be seen with the dipole moving from the bottom to the top of the image.
In all three of the B2Cl4Br2 complexes the boron atom is positively charged because it is surrounded by electronegative halogen atoms. This is different to the diborane compound where the borane is negatively charged because it forms 2 conventional bonds and 2 three centered two electron bonds. The three centered 2 electron bonds do not cause the boron to be negatively charged because the halogens withdraw the electron density away from the boron atom.
In the bridging isomer the bridging bromine atoms are positivity charged like the bridging hydrogens in diborane. This is because the bromine atom is not as electronegative as the hydrogen (or chlorine) and as a result the bridging atoms are positively charged.
The summary below shows the charges of the bridging isomer in more detail.
 Summary of Natural Population Analysis:

                                       Natural Population
                Natural  -----------------------------------------------
    Atom  No    Charge         Core      Valence    Rydberg      Total
 -----------------------------------------------------------------------
      B    1    0.20975      1.99979     2.72306    0.06740     4.79025
     Br    2    0.10750     28.00000     6.88958    0.00292    34.89250
     Br    3    0.10750     28.00000     6.88958    0.00292    34.89250
     Cl    4   -0.15863     10.00000     7.15616    0.00247    17.15863
     Cl    5   -0.15863     10.00000     7.15616    0.00247    17.15863
      B    6    0.20975      1.99979     2.72306    0.06740     4.79025
     Cl    7   -0.15863     10.00000     7.15616    0.00247    17.15863
     Cl    8   -0.15863     10.00000     7.15616    0.00247    17.15863
 =======================================================================
   * Total *    0.00000     99.99959    47.84991    0.15051   148.00000
By viewing the log file for the summary of the occupancies of the orbitals can be seen. Again the bridging isomer is investigated
       (Occupancy)   Bond orbital/ Coefficients/ Hybrids
 ---------------------------------------------------------------------------------
     1. (1.97013) BD ( 1) B   1 -Br   2
                ( 27.75%)   0.5268* B   1 s( 19.90%)p 4.02( 80.10%)
                                           -0.0001  0.4433 -0.0501 -0.5484  0.0153
                                           -0.7065 -0.0297  0.0000  0.0000
                ( 72.25%)   0.8500*Br   2 s( 16.02%)p 5.24( 83.98%)
                                            0.4002  0.0044  0.7070  0.0148  0.5829
                                           -0.0011  0.0000  0.0000
     2. (1.97014) BD ( 1) B   1 -Br   3
                ( 27.75%)   0.5268* B   1 s( 19.90%)p 4.02( 80.10%)
                                           -0.0001  0.4433 -0.0501 -0.5484  0.0153
                                            0.7065  0.0297  0.0000  0.0000
                ( 72.25%)   0.8500*Br   3 s( 16.02%)p 5.24( 83.98%)
                                            0.4002  0.0044  0.7069  0.0148 -0.5829
                                            0.0011  0.0000  0.0000
     3. (1.98641) BD ( 1) B   1 -Cl   4
                ( 30.88%)   0.5557* B   1 s( 30.36%)p 2.29( 69.64%)
                                            0.0000  0.5495  0.0398  0.4417  0.0369
                                            0.0000  0.0000 -0.7049 -0.0554
                ( 69.12%)   0.8314*Cl   4 s( 27.54%)p 2.63( 72.46%)
                                            0.5247 -0.0113 -0.4419 -0.0127  0.0000
                                            0.0000  0.7272  0.0188
     4. (1.98641) BD ( 1) B   1 -Cl   5
                ( 30.88%)   0.5557* B   1 s( 30.36%)p 2.29( 69.64%)
                                            0.0000  0.5495  0.0398  0.4416  0.0369
                                            0.0000  0.0000  0.7049  0.0554
                ( 69.12%)   0.8314*Cl   5 s( 27.54%)p 2.63( 72.46%)
                                            0.5247 -0.0113 -0.4419 -0.0127  0.0000
                                            0.0000 -0.7272 -0.0188
     5. (1.97014) BD ( 1)Br   2 - B   6
                ( 72.25%)   0.8500*Br   2 s( 16.02%)p 5.24( 83.98%)
                                           -0.4002 -0.0044  0.7069  0.0148 -0.5829
                                            0.0011  0.0000  0.0000
                ( 27.75%)   0.5268* B   6 s( 19.90%)p 4.02( 80.10%)
                                            0.0001 -0.4433  0.0501 -0.5484  0.0153
                                            0.7065  0.0297  0.0000  0.0000
     6. (1.97013) BD ( 1)Br   3 - B   6
                ( 72.25%)   0.8500*Br   3 s( 16.02%)p 5.24( 83.98%)
                                           -0.4002 -0.0044  0.7070  0.0148  0.5829
                                           -0.0011  0.0000  0.0000
                ( 27.75%)   0.5268* B   6 s( 19.90%)p 4.02( 80.10%)
                                            0.0001 -0.4433  0.0501 -0.5484  0.0153
                                           -0.7065 -0.0297  0.0000  0.0000
     7. (1.98641) BD ( 1) B   6 -Cl   7
                ( 30.88%)   0.5557* B   6 s( 30.36%)p 2.29( 69.64%)
                                            0.0000  0.5495  0.0398 -0.4417 -0.0369
                                            0.0000  0.0000 -0.7049 -0.0554
                ( 69.12%)   0.8314*Cl   7 s( 27.54%)p 2.63( 72.46%)
                                            0.5247 -0.0113  0.4419  0.0127  0.0000
                                            0.0000  0.7272  0.0188
     8. (1.98641) BD ( 1) B   6 -Cl   8
                ( 30.88%)   0.5557* B   6 s( 30.36%)p 2.29( 69.64%)
                                            0.0000  0.5495  0.0398 -0.4416 -0.0369
                                            0.0000  0.0000  0.7049  0.0554
                ( 69.12%)   0.8314*Cl   8 s( 27.54%)p 2.63( 72.46%)
                                            0.5247 -0.0113  0.4419  0.0127  0.0000
                                            0.0000 -0.7272 -0.0188
By analysing the NBO log file the hybridisation of each atom and the distribution of the electron density can be seen.
The terminal bonds are first looked at and the data shows the expected results. The majority(69.12%) of the electron density is situated on the chlorine which is expected because it is more electronegative than boron. Also the hybridisation of the boron and chloride atoms in B-Cl bond is approximatley sp2.
The bridging bonds between boron and bromine have already been shown to be longer bonds. The B-Br bond has the majority(72.25%) of the electron density situated of the the bromine, again this is expected because bromine is more electronegtive than boron. The hybridisation of the boron and bromine atoms B-Br bond is sp4, which is not expected as the p orbital contribution is too large. When the polarity of the atoms involved in both the terminal and bridging bonds are compared it can be seen that the value for bormine is larger than for Chlorine. Again this is unexpected because chlorine is more electronegative then bromine and should have a larger share of the electron density than bromine.
Therefore it seems the NBO analysis seems not to be accurate for the 3 centred 2 electron bonds. This is likely due to the definition of a bond which is used by gaussian. The bond may have been modeled on the standard 2 centered 2 electron bond.
Conclusion
This mini project has shown the existence of 3 centered 2 electron bonds in the simplest borane dimer and in a more complex dimer containing chlorine and bromine. When the structures of both compounds were optimised the expected structures where produced.
For the different isomers of B2Cl4Br2 were investigated to see how the bonding changed depending on the different atoms which are present in the bridging position. It was concluded that the type of bonding did not change however the the geometry of the structure did slightly.
Vibrational analysis showed the difference between the terminal and bridging bonds. It also showed the difference between the types of bonds, that the B-Br bond is longer than the B-Cl bond.
The NBO and charge distribution analysis showed how the difference in electronegtivity of the atoms effects the dipole of the isomer. From the NBO analysis of the isomers it was shown that it is accurate in predicting the bonding of the terminal atoms however it could not predict the bonding of the bridging atoms.
References
- ↑ M. Schuurman, et. al., J. Comp . Chem., 26, 2005, pp.1106-1112
- ↑ R. DeKock et. al., Chemical Structure and Bonding, 1989, p.162
- ↑ M. Jacox, Vibrational and Electronic Energy Levels of Polyatomic Transient Molecules, J. Phys. Chem. Ref. Data, 1994, Monograph 3
- ↑ M. Jacox, Vibrational and Electronic Energy Levels of Polyatomic Transient Molecules, J. Phys. Chem. Ref. Data, 1994, Monograph 3
- ↑ M. Jacox, Vibrational and Electronic Energy Levels of Polyatomic Transient Molecules, J. Phys. Chem. Ref. Data, 1994, Monograph 3
- ↑ M. Jacox, Vibrational and Electronic Energy Levels of Polyatomic Transient Molecules, J. Phys. Chem. Ref. Data, 1994, Monograph 3
- ↑ M. Jacox, Vibrational and Electronic Energy Levels of Polyatomic Transient Molecules, J. Phys. Chem. Ref. Data, 1994, Monograph 3
- ↑ M. Jacox, Vibrational and Electronic Energy Levels of Polyatomic Transient Molecules, J. Phys. Chem. Ref. Data, 1994, Monograph 3
- ↑ J. Glaser et al., Acta Chemica Scandanavica A, 36, 1982, pp.125-135
- ↑ J. Davies, et al., J. Chem. Soc A, 1968, pp.2050-2054
- ↑ J. Davies, et al., J. Chem. Soc A, 1968, pp.2050-2054
- ↑ J. Davies, et al., J. Chem. Soc A, 1968, pp.2050-2054
- ↑ J. Davies, et al., J. Chem. Soc A, 1968, pp.2050-2054
- ↑ J. Davies, et al., J. Chem. Soc A, 1968, pp.2050-2054
- ↑ J. Davies, et al., J. Chem. Soc A, 1968, pp.2050-2054
- ↑ DOI:10042/to-13022
- ↑ DOI:10042/to-13023
- ↑ http://hdl.handle.net/10042/to-13029
- ↑ http://hdl.handle.net/10042/to-13027
- ↑ F. A. Cotton, Inorg. Chem., 21, 1982, pp 294 - 299
- ↑ D. W. Bennett, J. Chem. Cryst., 34(6), 2004, pp 353 - 359
- ↑ F. A. Cotton, Inorg. Chem., 21, 1982, pp 294 - 299
- ↑ D. W. Bennett, J. Chem. Cryst., 34(6), 2004, pp 353 - 359
- ↑ F. A. Cotton, Inorg. Chem., 21, 1982, pp 294 - 299
- ↑ D. W. Bennett, J. Chem. Cryst., 34(6), 2004, pp 353 - 359
- ↑ http://hdl.handle.net/10042/to-13054
- ↑ http://hdl.handle.net/10042/to-13055
- ↑ F. A. Cotton, Inorg. Chem., 21, 1982, pp 294 - 299
- ↑ D. W. Bennett, J. Chem. Cryst., 34(6), 2004, pp 353 - 359
- ↑ F. A. Cotton, Inorg. Chem., 21, 1982, pp 294 - 299
- ↑ D. W. Bennett, J. Chem. Cryst., 34(6), 2004, pp 353 - 359
- ↑ F. A. Cotton, Inorg. Chem., 21, 1982, pp 294 - 299
- ↑ D. W. Bennett, J. Chem. Cryst., 34(6), 2004, pp 353 - 359
- ↑ http://hdl.handle.net/10042/to-13062
- ↑ http://hdl.handle.net/10042/to-13061
- ↑ M. Ardon et al., J. Chem. Educ., 79, 2002, pp.1249-1251
- ↑ M. Ardon et al., J. Chem. Educ., 79, 2002, pp.1249-1251
- ↑ M. Ardon et al., J. Chem. Educ., 79, 2002, pp.1249-1251
- ↑ M. Ardon et al., J. Chem. Educ., 79, 2002, pp.1249-1251v
- ↑ F. A. Cotton et al., Inorg. Chem., 21, 1982, pp.294-299
- ↑ F. A. Cotton et al., Inorg. Chem., 21, 1982, pp.294-299
- ↑ F. A. Cotton et al., Inorg. Chem., 21, 1982, pp.294-299
- ↑ F. A. Cotton et al., Inorg. Chem., 21, 1982, pp.294-299
- ↑ http://hdl.handle.net/10042/to-13155
- ↑ http://hdl.handle.net/10042/to-13156
- ↑ http://hdl.handle.net/10042/to-13157
- ↑ http://hdl.handle.net/10042/to-13173
- ↑ http://hdl.handle.net/10042/to-13174
- ↑ http://hdl.handle.net/10042/to-13172
- ↑ http://hdl.handle.net/10042/to-13173
- ↑ http://hdl.handle.net/10042/to-13174
- ↑ http://hdl.handle.net/10042/to-13172
