
Rep:Mod2DanielPohoryles:InorganicCompChemExperiment
In this module the structure and bonding of molecules will be analysed by computational methods using Gaussian calculations. The first part is an exercise investigating bonding in BH3 and BCl3, the purpose of this is mostly to understand and learn the use of the computational techniques needed to optimise structures of molecules and analyse molecular orbitals and vibrations of these. This part will be presented in the form of a log or lab book, with some analysis of MOs, dipole moments and vibrations. In a second part the bonding of transition metal complexes will be investigated. The knowledge gained from the first exercise will be used to analyse the structures and bonding in the cis and trans conformers of Mo(CO)4(PCl3)2 and to comment on relative stabilities. Finally a mini project was carried out investigating the different modes of bonding of the butadiene ligand to transition metal complexes.
BH3 and BCl3
In this exercise the structure and bonding in BH3 and BCl3 were analysed using computational studies. Both molecules were created in Gaussview and then optimised using the B3LYP method with a 3-21G basis set. The optimised molecules were then checked by frequency analysis, their Molecular Orbitals were computed and the NBOs were also analysed. General aspects of optimisation were looked at.
DAY 1
1. Create BH3 and optimise
Create BH3 molecule on Gaussview. Get familiar with the program
Bond distances of BH3 set to 1.5 Å ±0.01 Å.
BH3 molecule is optimised using the Gaussian calculation:
the method (approximations that are made in solving the Schrodingerequation): B3LYP the basis set (accuracy): 3-21G and what type of calculation to do: OPT (for optimisation)
Optimised molecule was created: pohoryles_bh3_opt
Geometry info:
· bond distance B-H=1.194 Å ±0.01 Å
· bond angle H-B-H= 120.0° ±0.1°
Opened log file as text, checked that your job has really converged
2. Optimisation?
Open pohoryles_bh3_opt.log in gaussview
“results" and then "optimization"->Get graphs showing how the energy and gradient have changed over the optimisation
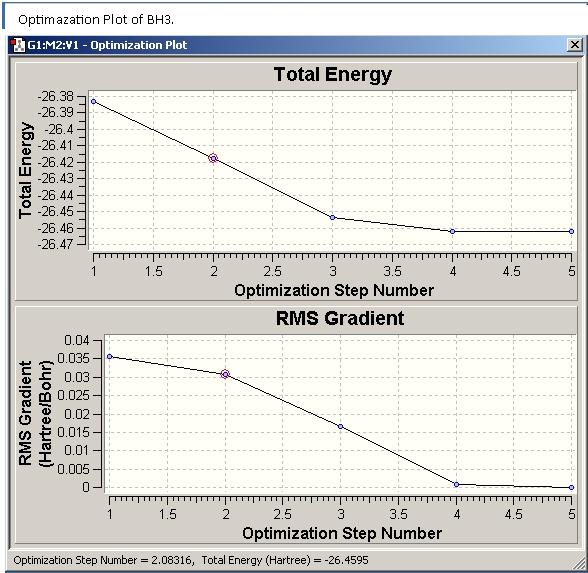

What is gradient?
Gradient= rate of change of energy (hartree) with change in distance between the atoms (Bohr), slope of energy vs. Atomic separation
Clicked on green button for animation of the optimisation steps, ie the different position of the nuclei for each step of the optimisation
Frames 1 to 3 no bond is drawn-> distance exceeds some pre-defined value
- Born-Oppenheimer approximation we assume the nuclei are fixed, and we solve for the electrons
- Optimise structure-> towards stable equilibrium point -> not too far not too close
- solve the Schrödinger equation for the nuclear positions and electrons and find the energy E(R), then move atoms->new E(R’) -> compare to E(R), if smaller, continue in that direction, etc. Towards lowest E structure, in equilibrium
- molecule will experience forces F(R) as long as a change in position (delta R) causes a change in energy, delta E(R) -> first derivative, i.e. slope. If slope=0, equilibrium because no forces
- ->” Gradient” shows the slope/gradient going to zero as we approach the minimum
3. Pseudo potential and basis sets
- Assume valence electrons that dominate in bonding interactions -> pseudo-potential (PP) or an effective core potential (ECP)
- Basis sets determine the number of functions used to describe the electronic structure -> balance computational difficulty vs the size of the basis set.
o diffuse functions allow the electron density to extend out and away from the molecule
o Polarization functions allow the electron density to become polarized to one side
4. Calculate MOs of BH3
Gaussian energy calculation-> B3LYP/ basis set: 3-21G (LIKE OPTIMISATION); additional keywords" section "pop=full"; "Full NBO” -> pohoryles_ bh3_pop
This is the MO diagram of BH3 with the added MOs from Computational Calculations The MOs are similar, the exact shape of the orbitals is of course not visible in the LCAO MOs, but can be understood from this approach for a simple moelcule

MO theory is quite accurate, useful because no computer needed for a quite reasonable display of molecular orbitals, especially for small molecules we can get a good idea of the actual shape
5. NBO charges:
NBO charges for the boron 0.198
hydrogen atoms > -0.066
LOGFILE-> bonding info, compute the charges, interactions betweens MOs
Day 2
6. Vibrational analysis and confirming minima
A frequency calculation for the opt BH3 molecule was carried out. The results window can be seen below.
energy calculation-> B3LYP/ basis set: 3-21G (LIKE OPTIMISATION). Energy is approx the same as for the optimisation BH3 molecule (-0.00000005 a.u.).
Obtain frequencies from text file:
Low frequencies --- -0.3716 -0.0098 -0.0019 37.2444 37.9574 37.9592 Low frequencies --- 1146.0292 1204.8631 1204.8641
The “-6” frequencies are indeed by more than one order of magnitude lower than the three main frequencies. The highest of the “zero” frequencies is at 37.9592, this is because we use a low level of accuracy in our calculation method. All obtained frequencies are positive, the structure is hence an energy minimum.


Only three peaks are observed even if there are 6 vibrations. If we look at the table above, it can be seen that the totally symmetric vibration at 2591.65 cm-1 has an intensity of 0 because it is not IR active. The totally symmetric vibrations result in a zero net dipole moment and hence in a zero intensity IR peak. This can be easily obtained from the character table of the D3h point-group, indicating on the right-hand side that only A2” and E’ modes are IR active. Moreover the vibrations at 1204.86 and 2730.07 cm-1 are degenerate and are observed at the exact same wavenumber. This explains why only three peaks are observed on the spectrum even if six vibrational modes exist for the molecule.
There is a known systematic error of around 10%, this is because we use a harmonic approximation for vibrations that are actually anharmonic.
7. Create BCl3
optimise the D3h ground state structure of BCl3, confirm this structure is a minima by frequency analysis
Restrict symmetry to D3h, tolerance-> “very tight” (0.0001)
Optimise structure method (approximations that are made in solving the Schrodinger equation): DFT/ B3LYP; basis set: LanL2MB (medium level accuracy)-> pohoryles_bcl3_opt
· In order to compare energies, we must use the same method and basis set for both calculations. This is because different methods provide different values for the energy and different basis sets result in different accuracies and hence also in different values that cannot be compared.
· The frequency analysis allows us to determine if the structure that was optimised is actually a minimum. The frequency analysis corresponds to the second derivative of the potential energy surface. As all the frequencies are positive, this corresponds to an energy minimum and the structure is actually a minima.
· In the optimised molecules of BH3 and BCl3 no bonds are observed on gaussview. Gaussview draws bonds based on a distance critera, so this does not mean there are no bonds. The distance between atoms is just higher than the pre-defined value. "Bonds" in gausview are a structural convenience, but a bond is not just a line on a structure.
· A chemical bond is the attraction caused by the electromagnetic force between the opposing charges of electrons and nuclei. The negatively-charged electrons orbiting the nucleus and the positively-charged protons in the nucleus attract each other. Hence in a bond electrons positioned between two nuclei will be attracted to both of them and result in the most stable configuration of nuclei and electrons. Between the nuclei there is a higher electron density, causing the nuclei to be attracted which results in a bond.
· Gaussview used D3H symmetry for BCl3, this is what is expected for the groundstate structure of BCl3.
· The calculations for such small molecules are very quick, the optimisation took 11 seconds, the frequency analysis 13 seconds
· Geometry info:
- bond distance B-Cl=1.866 A ±0.01 Å
- bond angle Cl-B-Cl= 120.0° ±0.1° [1]
- E= -69.43928112 a.u.
Frequency calculation; method: DFT/ B3LYP; basis set: LanL2MB -> pohoryles_bcl3_frq
The outcome of the frequency calculation is that the structure is a minima as all the frequencies are positive.
The IR spectrum of BCl3 can be obtained.

The spectrum looks similar to the one obtained for BH3, however all the peaks are shifted to lower wavenumbers for BCl3.
Mo(CO)4(PCl3)2
Optimisations of the structures of the two conformers of Mo(CO)4(PCl3)2
A molecule of cis-Mo(CO)4(PCl3)2 and a molecule of its trans isomer were created on GaussView 5.0 and then these models were optimised in three steps. First the models were sent to Gaussian, the optimisation method being B3LYP and the basis set LANL2MB. Moreover "opt=loose " in the "Additional keywords" box. The first calculation corresponds to the “*_opt1” files in the summary table.
A second optimisation was then carried out, but first the geometries of the two isomers were slightly adapted, as the dihedral angles needed to achieve the absolute minimal configurations were not obtained from the Gaussian calculations. The PCl3 groups of the complexes were rotated manually in order to obtain a confirmation in which the PCl3 groups are eclipsed, with one Cl parallel to the axial Mo-C bond, for the trans conformer, whereas for the cis-conformer, it was made sure that one Cl points up parallel to the axial bond, and that one Cl of the other group points down as shown below in the optimised molecules.
The second optimisation was send to Gaussian using the B3LYP method and LANL2DZ basis set. Moreover, "int=ultrafine scf=conver=9" was added in the "Additional keywords" box. The second calculation corresponds to the “*_opt2” files in the summary table.
In the log file of the second optimisation a problem was observed:
Warning! P atom 10 may be hypervalent but has no d functions.
Warning! P atom 11 may be hypervalent but has no d functions.
This is because the used LANL2DZ pseudo-potential and basis set is not precise enough. The Phosphorous atom still only has valence s and p orbital functions as basis set, however P likes to be hypervalent and uses its low lying d Atomic Orbitals. In order to include these, the log file of the second optimization was altered to create the input file with included d AOs:
At the beginning the text was changed to get:
- opt b3lyp/lanl2dz geom=connectivity
int=ultrafine scf=conver=9 extrabasis
At the end the following lines were added:
(blank line)
P 0
D 1 1.0
0.55 0.100D+01
(blank line)
To the P atom is added a d function with a specific width and decay rate (line 3). The third optimisation was ran with the same method and basis set as used for _opt2, including the aforementioned change in the input file. The third calculation corresponds to the “*_opt3” files in the summary table.
The optimised structures obtained for the Trans conformer [2] and cis conformer [3] can be seen below and were published in the chemical database (“D-space”):
![]()
File:Selected bond lengths (A) and angles (°) for cis- and trans-Mo(CO)4(PCl3)2.jpg
It can be seen that the geometrical data for the trans conformer is in very good agreement with the data obtained experimentally from X-ray crystallography [4]. For the cis-conformer, there are some variation, especially in the P-Mo-P and P-Mo-C bond angles. This might arise from a non complete optimisation, but can much rather be explained by the different ligands used in comparison to the literature [5]. As PPh3 is a bulkier ligand then PCl3, the structure of the complex is naturally further away from the ideal octahedral structure. For example, the P(1)-Mo-P(2) angle obtained from computational calculations using PCl3 is close to the ideal 90° (94.3), whereas using the PPh3 ligand, the two ligands are separated by 104.6° due to very large steric repulsion. Also the PCl3 ligand has much longer P-Cl bonds then the P-C bonds in PPh3 (see table). This results in the PCl3 ligand being more wide spread and the steric repulsion between the groups is hence smaller.
An important observation is that the relative energies obtained after the three optimisation steps is the same for the cis and the trans conformer, indicating that both have similar stability. It would be expected however that the cis isomer is less stable due to a greater steric hindrance between the PCl3 groups in this isomer. This is observed, the difference in Energy between the trans and the cis conformer is not negligeable, but not very large with -3.267kJ.mol-1. This is observed for Mo(CO)4(PPh3)2 or Mo(CO)4(n-Bu3P)2 with a much higher energu difference. For Mo(CO)4(PPh3)2 the ΔE is -72.98 kJ.mol-1 [6], hence 20 times more important than for the ligand used in the computational exercise. For these ligands the trans conformer is far more stable due to steric interactions between the highly sterically demanding ligands in the cis conformer. This result is interesting when thinking about stabilising the structurally more efficient isomer for catalysis for example. Clearly, using sterically less demanding ligands results in a greater stability of the cis conformer. Also it was found that H-bonding properties in PR3 can be used to enhance the stability of the cis conformer, for example using 2-pyridyldiphenylphosphane as ligand [7].
Frequency analyses of the optimised structures of the two conformers of Mo(CO)4(PCl3)2 =
The frequency analyses of the optimised structures were carried out using the same LANL2DZ pseudo-potential and the extrabasis described previously. For the cis-conformer, a frequency analysis was also performed for the molecule obtained from the second optimisation (_opt2), this was done in order to analyse the expected differences in accuracy arising from the addition of the d AOs. This calculation corresponds to the “cis_Mo(CO)4(PCl3)2_freq” file whilst the other frequency analyses are called “*_opt3_freq”.
For all the jobs it was checked that the job has really converged by reading the summary, with specific attention to the “Gradient”, which should be a value very close to zero, and the output text file in which it is explicitly stated if the job converged or not:
Item Value Threshold Converged?
Maximum Force .000090 .000450 YES
RMS Force .000059 .000300 YES
Maximum Displacement .000352 .001800 YES
RMS Displacement .000230 .001200 YES
Predicted change in Energy=-4.580915E-08
Optimization completed.
The frequency analyses were used to determine if the optimised structures actually correspond to minima, as the frequency corresponds to the second order derivative of the potential energy surface. If all the frequencies are positive (or just very slightly negative) this corresponds to an energy minimum and the structure is actually a minima.
For both molecules (and for both frequency analyses in the case of the cis-conformer) the IR frequencies were all positive. An example of the log file for cis_Mo(CO)4(PCl3)2_opt3_freq shows that all the frequencies are positive, because the lowest IR frequencies are positive:
Frequencies -- 11.7330 20.2822 45.8821
etc.
Not only the frequencies that can be obtained on Gaussview were analysed, in order to see if the structure was accurately optimised, also the “low frequencies” from the log file have to be taken into account. These “zero frequencies” are the motions of the center of mass and should be close to zero, in the range of ±10cm-1.
For the less accurate cis_Mo(CO)4(PCl3)2_freq the following “zero frequencies” were obtained:
Low frequencies --- -1.7021 0.0000 0.0004 0.0005 1.0650 1.5481
For the molecule for which the d-orbitals have been added, cis_Mo(CO)4(PCl3)2_opt3_freq, the following “zero frequencies” were noted:
Low frequencies --- -1.2971 -0.0007 -0.0005 -0.0004 0.7933 1.9452 For trans_Mo(CO)4(PCl3)2_opt3b_freq, including the d AOs the following “zero frequencies” were noted: Low frequencies --- -2.2969 -1.9493 -0.0006 0.0001 0.0002 3.0293
All the low frequencies are very close to zero, this confirms that the structures were actually optimised.
4(PCl3)2.jpg)
![]()
Differences in the results obtained from opt2 and opt3
Let us quickly compare the differences obtained from the frequency analyses of the opt2 and opt3 molecules of the cis conformer. It can be observed that there is a slight difference in the low frequencies, the first ones having a more negative lowest frequency, but the second one having a more positive last frequency. If we compare the IR frequencies, it can be observed again that all the frequencies are shifted to higher wavenumber (the shift is about 10% for low frequencies and 1% for higher frequencies). The energies can of the optimised structures can be compared as they are both obtained from the same calculation method and it can be seen that effectively the third optimisation reduced the energy of the structure slightly from -623.58 to -623.69 a.u..
IR spectra of cis- and trans-Mo(CO)4(PCl3)2
From the frequency analysis, the IR spectra can be obtained using GaussView 5.0. The spectra are displayed below and a deeper analysis of the C-O stretching vibrations was performed and explained using a Group Theory approach [8]
It is expected that the trans isomer presents only one IR stretch for CO whereas the cis isomer should have three bands for CO. This can be explained by the fact that the trans isomer is a more symmetrical D4h compound whereas the cis isomer is only C2v in symmetry. More symmetrical compounds are generally believed to present less IR stretches [9].
Analysis of the CO-stretches
IR spectrum of cis-Mo(CO)4(PCl3)2[10]
4(PCl3)2.jpg)
4(PCl3)2.jpg)
As expected there are four different vibrations of CO resulting in three stretches in the spectrum as the first two overlap. All four stretching modes are IR active, this could be seen looking at a character table of the C2v point group. The order of the four modes is as expected from literature A1>B1>B2 [11].
IR spectrum of trans-Mo(CO)4(PCl3)2[12]
![]()
![]()
The two modes A1g and B1g are not allowed in the D4h point group, however we can see very weak bands, which can be explained by the fact that the PCl3 ligands remove the D4h symmetry of the molecule. The perturbation is small enough not to affect the Eu species which is only very slightly split. On the spectra obtained experimentally and from computational calculations, only one peak is observed because it of the very low intensity of the peaks 3 and 4. Comparing the spectrum to the spectrum of the cis conformer it can clearly be seen that higher symmetry of a complex leads to fewer IR active stretching modes.
Analysis of the very low frequency vibrations
For both conformers two vibrations with very low or zero intensity are observed at low frequencies (4 to 10 cm-1). These correspond to rotations of the PCl3 ligands about the P-Mo axes, one vibration being symmetrical, the other one assymetrical. As these vibrations are very low in energy they will occur at room temperature, this means that the interchange between structures is very facile, which is also expected from the low energy barrier (3.267kJ.mol-1). The vibrations at low frequencies are summarised in the table beside.
![]()
Miniproject – Computational investigation of bonding in Metal-butadiene complexes
In this mini project for MODULE the different ways in which the butadiene ligand can bond to a metal centre, ie how the ligand responds to “the needs” of the metal center was investigated. Structures of Rh(C4H6)2Cl (A), Fe(CO)3(C4H6)(B) and (C5H5)Ta(C4H6)Cl2 (C) were optimised using the B3LYP method and the LANL2DZ pseudo potential and basis set. From the optimised structure the three different C-C bondlenghts in the butadiene ligand were analysed and the findings were rationalised by Molecular Orbital theory, explaining the different extents of backbonding.
In a second part the butadiene ligand is replaced in complex B by cyclobutadiene to generate (C4H4)Fe(CO)3(D) and their relative stabilities aswell as the results of MO and IR analysis are compared. Particular analysis of the CO stretches in the IR spectrum will be performed to analyse if there is a variation of the way the Iron center bonds to the CO ligand depending on the other ligand being butadiene or cyclobutadiene.
The four molecules and the two ligands used were all optimized using the same method and basis set:
First the models were sent to Gaussian, the optimisation method being B3LYP and the basis set LANL2MB. Moreover "opt=loose " in the "Additional keywords" box. The first calculation corresponds to the “*_opt1” files in the summary table.
The second optimisation was send to Gaussian using the B3LYP method and LANL2DZ basis set. Moreover, "int=ultrafine scf=conver=9" was added in the "Additional keywords" box. The second calculation corresponds to the “*_opt2” files in the summary table.
The optimised structures were confirmed by a frequency analysis which was performed using the same details as the second optimisation. This corresponds to the “*_freq” files.
The geometrical features of the four complexes were analysed on Gaussview on the optimised structures were analysed. The bond lengths in the butadiene/cyclobutadiene ligands are of high importance. They are different for all three complexes as the way of bonding is different.
Free butadiene and cyclobutadiene were also optimised so as to have a comparison for the following geometrical analyses.

A. Rh(C4H6)2Cl
The optimised structure was published on D-space [13] The full frequency analysis and IR spectra can be obtained here[14]
2Cl_table.JPG)
B. Fe(CO)3(C4H6)
The optimised structure was published on D-space [15] The full frequency analysis and IR spectra can be obtained here[16]
3(C4H6)_table.JPG)
C. (C5H5)Ta(C4H6)Cl2
The optimised structure was published on D-space [17] The full frequency analysis and IR spectra can be obtained here[18]
Ta(C4H6)Cl2_table.JPG)
These variations cannot not be explained by considering the butadiene as two alkene fragments, we need to consider molecular orbitals. The molecular orbitals are taken from the first lecture of Ed Marshalls Advanced Organometallic Third Year Course at Imperial College London.
Molecular orbitals of the butadiene ligand, as obtained from computational results and as expected from MO theory.

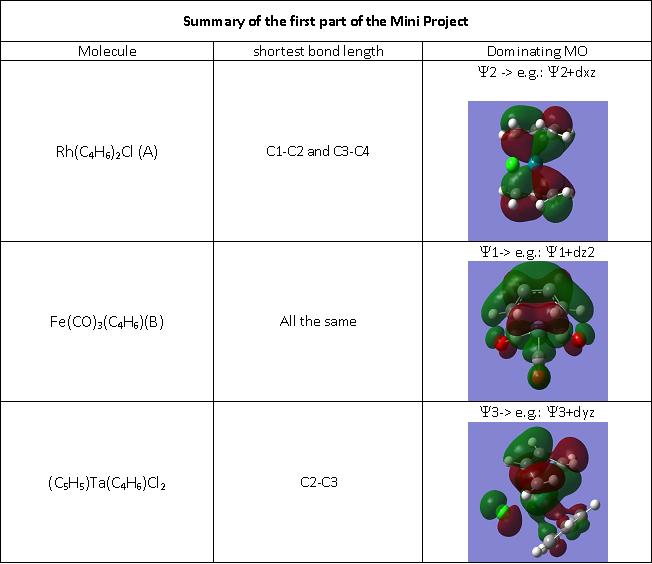
The bonding basically depends on the Frontier orbitals, which are Y2 (HOMO) and Y3 (LUMO). When butadiene binds to a metal, Y1 and Y2 are used to form a s-bond and a p-bond (hence it is an L2-type ligand). However, if the metal backbonds with butadiene, then also Y3 becomes occupied. This results in C1-C2 and C3-C4 lengthening and C2-C3 will shorten. This is observed in the variations in bond lengths obtained from computational studies. Hence for A, the Y2 orbital dominates, for B its the Y1 and for C its the Y3 orbital. The Ligand responds to the needs of the metal, and the relevant frontier orbitals from combined metal and ligand MOs for A, B and C are displayed below. Only the dominating MOs for each molecule are displayed so as to not make the page to crowded with MOs:

_and_angles_(%C2%B0)_for_cis-_and_trans-Mo(CO)4(PCl3)2.jpg)
For (C4H4)Fe(CO)3 the cyclobutadiene ligand experiences a change in geometry, free cyclobutadiene should be rectangular, however in coordination it is square as shown from the computational data.

D. (C4H4)Fe(CO)3
The optimised structure was published on D-space [19] The full frequency analysis and IR spectra can be obtained here[20] .
Fe(CO)3_table.JPG)
Again this can be explained from MO theory. The MO diagram below shows that the Y2 and Y3 orbitals become degenerate upon coordination to the metal center
Fe(CO)3.JPG)
As the metal donates two electrons onto the ligand, it makes it a 6e- Huckel aromatic p-system. Now the geometry of the ligand is expected to be square and the p system delocalised over the whole ring. This is effectively observed and explains why all 4 bond lengths are the same.
Now we take a quick look at the IR spectra of B and D. Both molecules are just differing in the ligand being butadiene or cyclobutadiene. Looking at the C-O stretches in order to determine if there is a difference in π-backbonding to the C=O ligands was the aim of the IR analysis.
What can be observed is that for the cyclobutadiene complex, the C=O stretches are broader and they are shifted to slightly higher wavenumbers. This indicates that the C=O bonds are slightly stronger, which means there is less π-backbonding into the antibonding orbitals of C=O because the electron density is oriented more towards the aromatic π-cloud of cyclobutadiene. CO stretches on the IR spectrum of D. (C4H4)Fe(CO)3
Fe(CO)3.JPG)
CO stretches on the IR spectrum of A. (C4H6)Fe(CO)3
Fe(CO)3.JPG)
References
- ↑ Inorg. Chem., 2003, 42 (24), pp 7990–7994 DOI:10.1021/ic034141o
- ↑ Pohoryles Daniel trans_Mo(CO)4(PCl3)2_opt3bDOI:10042/to-3115
- ↑ Pohoryles Daniel cis_Mo(CO)4(PCl3)2_opt3DOI:10042/to-3113
- ↑ Crystal structures of trans-[Mo(CO)4(PPh3)2] and 1,4-bis(diphenylphosphino)-2,5-difluorobenzene” G. Hogarth., T. Norman, Inorganica Chimica Acta 254 (1997) 167-171DOI:10.1016/S0020-1693(96)05133-X
- ↑ Steric contributions to the solid-state structures of bis(phosphine) derivatives of molybdenum carbonyl. X-ray structural studies of cis-Mo(CO)4[PPh3-nMen]2 (n = 0, 1, 2)", F. Albert Cotton, Donald J. Darensbourg, Simonetta Klein, and Brian W. S. Kolthammer, Inorg. Chem., 21, (1982), p294-299DOI:10.1021/ic00131a055
- ↑ The crystal and molecular structure of trans-tetracarbonylbis(triphenyl-phosphine)chromium(0) in a new unit cell: Is the trans conformer more stable than the cis?, Dennis W. Bennett, Tasneem A. Siddiquee, Daniel T. Haworth, Shariff E. Kabir and Farzana Camellia. J. Chem. Cryst., 34 (6) (2004) p353-359DOI:10.1023/B:JOCC.0000028667.12964.28
- ↑ Intramolecular hydrogen bonding and cation &pi-interactions affecting cis to trans isomerization in tungsten hexacarbonyl derivatives of 2-pyridyldiphenylphosphane and triphenylphosphane", Leeni Hirsivaara, Matti Haukka and Jouni Pursiainen, Inorg. Chem. Comm., 3 (2000) p508-510DOI:10.1016/S1387-7003(00)00131-3
- ↑ Infrared Determination of, Stereochemistry in Metal Complexes. M.Y. Darensbourg and D.J. Darensbourg., Journal of Chemical Education, 47(1):33-35, 1970 [1]
- ↑ I“Experiment 3.14 - Identification of Stereochemical (Geometrical) Isomers of [Mo(CO)4(L)2] by Infra-Red Spectroscopy,Robert H. Guinn,Regina Gilliland,September 17, 2008”[2]
- ↑ Daniel Pohoryles IR spectrum of cis-Mo(CO)4(PCl3)2DOI:10042/to-3026
- ↑ Phosphine-substituted carbonyl halide complexes of chromium and molybdenum.A.D. Allen and P.F. Barrett. CANADIAN JOURNAL OF CHEMISTRY. VOL. 46, 1968, 1649[3]
- ↑ Daniel Pohoryles IR spectrum of trans-Mo(CO)4(PCl3)2DOI:10042/to-3116
- ↑ Daniel Pohoryles A_Rh(C4H6)2Cl_opt2DOI:10042/to-3462
- ↑ Daniel Pohoryles (C4H4)Fe(CO)3_opt2DOI:10042/to-3457
- ↑ Daniel Pohoryles Fe(CO)3(C4H6)_opt2DOI:10042/to-3463
- ↑ Daniel Pohoryles (C4H4)Fe(CO)3_opt2DOI:10042/to-3458
- ↑ Daniel Pohoryles (C5H5)Ta(C4H6)Cl2_opt2DOI:10042/to-3461
- ↑ Daniel Pohoryles (C4H4)Fe(CO)3_opt2DOI:10042/to-3456
- ↑ Daniel Pohoryles (C4H4)Fe(CO)3_opt2DOI:10042/to-3459
- ↑ Daniel Pohoryles (C4H4)Fe(CO)3_opt2DOI:10042/to-3454