Rep:Mod2:ypl07
Bonding (Ab initio and density functional orbital)
The aim of this experiment was to study molecular bonding using ab initio and density function theory. The calculation was done by Gaussview 3.09. Density function theory method with appropriate basis set was used depending on the type of molecule were used.
Electronic structure calculated by ab initio molecular orbital theory is building from empirical formula and no experimental results were used.
Software/OS
Gaussian 3.09
Method
DFT-B3LYP was used. B3LYP is Becke three parameter hybrid functions with LYP expression for local correlation. It provides good approximation and short range correlations. In this experiment, all the molecule are less than 20 atoms, therefore long range coupling is not expected to be found.
Basis set[1]
Split valence basis sets
| log file | STO-3G | 3-21G | 6-31G | 6-311++G | Common |
| Definition | The calculation is based on slater type orbitals which simulated by add 3 Gaussian functions together. | The basis set used 3 Guassian functions summed to describe the inner shell orbital, 2 Gaussian functions that comprise the first STO of the double zeta and 1 Gaussian function summed in the second STO of the double zeta. | The basis set used 6 Guassian functions summed to describe the inner shell orbital, 3 Gaussian functions to first STO of the double zeta and 1 Gaussian function summed in the second STO of the double zeta. | STO-3G is the simplest basis set and 6-31G is the most complicated basis set. | |
| Optimisation step number | 9 | 10 | 10 | 9 | |
| Average Bond length/ Å | 1.17305 | 1.19436 | 1.19354 | 1.18803 | |
| Bond angle/ o | 119.989/120.128/119.884 | 120.001/119.999/120.000 | 120.008/119.994/119.998 | 119.934/120.038 | STO-3G is accurate up to first integer. 3-21G and 6-21G are in the same degree of accuracy. |
| Energy/ Hartree a.u. | -26.29366737 | -26.46226374 | -26.60595928 | -26.62367558 | Using 6-31++G as the true energy, the percentage error for STO-3 method is 1.24%, 3-21G is 0.61% and 6-31G is 0.06%. |
| RMS gradient Norm/ Hartree a.u. | 0.00021472 | 0.00001946 | 0.00007785 | 0.00012320 | All the RMS gradients were less than 0.001, hence the optimisation was converged. |
| Dipole moment/ Debye | 0.0014 | 0.0001 | 0.0004 | 0.0011 | BH3 should have zero dipole moment, hence the error is 0.001 Debye. |
| Job cup time/ Second | 10.8 | 13.1 | 13.0 | 72.5 |
In conclusion, 3-21G is the most suitable basis set for small molecule. The calculation is fast with reasonable degree of accuracy.
Error Analysis
The method of calculation is density function theory. The degree of accuracy depends on the basis set. The basis set with more Gaussian function would give more accurate results. In this section, the comparison of the error described in the lab script and the relative accuracy using different basis set is discussed.
Energy
The lab script states the energy has an error of ≈ 10 kJ/mol ≈ 0.0038088 Hartree a.u.. However, the basis set comparison shows that the 3-21G basis set has 1% error with respect to the energy calculated by 6-31++G basis set. Therefore, the energy reported is 1 decimal place.
Bond length
The lab scrip indicates that the bond length calculation is accurate to ≈ 0.01 Å. The basis set comparison also shows that the bond length calculated by various basis set are in good agreement to 2 decimal places. However, the calculation using STO-3 basis set only accurate up to 1 decimal place, which shows the lack of accuracy. It is no longer acceptable as publication resource. In the experiment, 3-21G basis set was used and the bond length was reported to 2 decimal places.
Bond angle
The lab script states that the bond angles are accurate to ≈ 0.1°. This is the same as with the conclusion of the comparison of basis set. All the bond angles are reported to 0.1°.
Frequency and intensity
The lab script suggests that the frequencies should only reported without decimal places, and the systematic error is know to be 10%. In the other words, the larger wavenumber, the greater error. The intensity is also suggested to report to the nearest whole integer and the accuracy is less than that.
Dipole moment
The lab script indicates that the dipole moment is accurate to 2 decimal places. This is the same as the conclusion from comparison of various basis set. Hence the dipole moment is reported to 2 decimal places.
Molecule Analysis Using Computational Simulation
Molecule analysis consists of two parts. Simple molecules analysis and an organometallic complex analysis. The structure, molecular orbitals and frequency were studied for simple molecules as BH3 and BCl3. Mo(CO)4 (PCl3)2 has cis and trans isomers. The optimisation and frequency were calculated for both conformation.
Simple Molecule Analysis
BH3 Analysis
BH3 is very reactive molecule. It has SP2 hybridised orbital and bonding with three hydrogen atoms, leave an empty P orbital. It normally exists as a dimer B2H6. In the calculation, it is assumed that there is only one BH3 molecule, therefore it has no chance to form a dimer.
Geometry Optimisation
The geometry optimisation was carried out using optimization job type, DFT/ B3LYP method and 3-21G basis set.
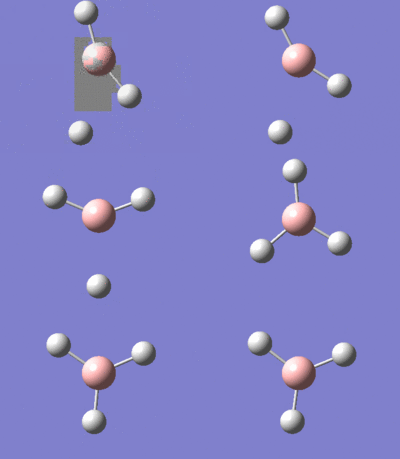
In order to make sure that the optimisation is working, the initial structure of boron hydride was distored.
Code for optimisation
# opt b3lyp/3-21g geom=connectivity

BH3 optimisation

0 1
Partial detail of log file
         Item               Value     Threshold  Converged?
 Maximum Force            0.000045     0.000450     YES
 RMS     Force            0.000018     0.000300     YES
 Maximum Displacement     0.000099     0.001800     YES
 RMS     Displacement     0.000049     0.001200     YES
 Predicted change in Energy=-3.100327D-09
 Optimization completed.
    -- Stationary point found.
                           ----------------------------
                           !   Optimized Parameters   !
                           ! (Angstroms and Degrees)  !
 --------------------------                            --------------------------
 ! Name  Definition              Value          Derivative Info.                !
 --------------------------------------------------------------------------------
 ! R1    R(1,2)                  1.1943         -DE/DX =    0.0                 !
 ! R2    R(1,3)                  1.1943         -DE/DX =    0.0                 !
 ! R3    R(1,4)                  1.1944         -DE/DX =    0.0                 !
 ! A1    A(2,1,3)              119.9989         -DE/DX =    0.0                 !
 ! A2    A(2,1,4)              120.0013         -DE/DX =    0.0                 !
 ! A3    A(3,1,4)              119.9997         -DE/DX =    0.0                 !
 ! D1    D(2,1,4,3)            180.0            -DE/DX =    0.0                 !
 --------------------------------------------------------------------------------
 GradGradGradGradGradGradGradGradGradGradGradGradGradGradGradGradGradGrad
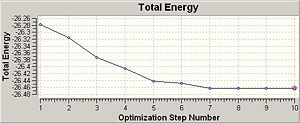
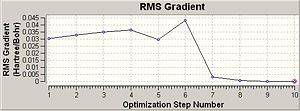
The RMS gradient is less than 0.001, therefore the optimisation is converged. The log file also confirmed that maximum force, RMS force, maximum displacement and RMS displacement were converged. The minimum energy is -26.46 Hartree a.u. and the most stable conformation is reached. The optimised BH3 molecule has B-H bond length 1.19 Å, bond angle 120.0° and dihedral angle 180.0°.
Molecular Orbitals
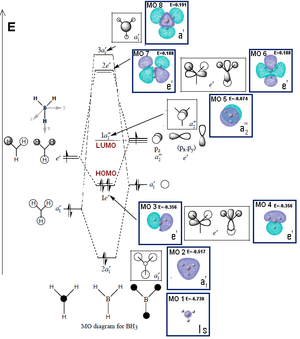
The molecular orbitals and NBO calculation was done by using the optimised structure log file. The job type changed to energy. The method and basis set remained unchanged. Extra keyword "pop=(nbo,full)" was added. The MO 1 to MO 8 were visualised by using the .chk file. The comparison of MO diagram predicted by LCAO method was also done.
Code for MO calculation and NBO analysis
# rb3lyp/3-21g pop=(nbo,full) geom=connectivity

BH3 molecular orbitals

0 1
Output log file
The calculated MO is similar with the MO predicted by LCAO. However, the calculated MO is more accurate than LCAO. LCAO can not give exact energy of each MO. The size of the orbital can not be predicted by LCAO. The calculated MO can give the exact final shape where ac LCAO can only give the relative structure based on the original atomic orbital. Moreover, LCAO gives good approximation for bench working, but in the present of computer, calculating MO can be done in 5 seconds. In conclusion, the Gaussian calculation is more accurate and faster than LCAO.
NBO analysis

The NBO analysis was done with the energy calculation in the previous section. The NBO results shows there are three B-H bonding orbitals. The all three B-H bond has 2 electron occupied. In the other words, those are two-electron-two-centre bonds. The bonding orbital from B atom is a mixture of 33.33% of s orbital and 66.67% of p orbital. This is also known as a SP2 hybridised orbital. The results also indicate that there is a core boron s orbital that is not combining with any other orbital.
The probability of finding electrons in middle of B-H is higher than anywhere els near H atoms. Hence the H atoms are slightly positive charged and the B atom is negatively charged.
Partial detail in the output file
       (Occupancy)   Bond orbital/ Coefficients/ Hybrids
 --------------------------------------------------------------------
     1. (1.99851) BD ( 1) B   1 - H   2
                ( 44.49%)   0.6670* B   1 s( 33.33%)p 2.00( 66.67%)
                                            0.0000  0.5774  0.0000  0.7545  0.0000
                                            0.3121  0.0000  0.0000  0.0000
                ( 55.51%)   0.7451* H   2 s(100.00%)
                                            1.0000  0.0000
     2. (1.99851) BD ( 1) B   1 - H   3
                ( 44.49%)   0.6670* B   1 s( 33.33%)p 2.00( 66.67%)
                                            0.0000  0.5774  0.0000 -0.6476  0.0000
                                            0.4973  0.0000  0.0000  0.0000
                ( 55.51%)   0.7451* H   3 s(100.00%)
                                            1.0000  0.0000
     3. (1.99851) BD ( 1) B   1 - H   4
                ( 44.49%)   0.6670* B   1 s( 33.33%)p 2.00( 66.67%)
                                            0.0000  0.5773  0.0000 -0.1069  0.0000
                                           -0.8095  0.0000  0.0000  0.0000
                ( 55.51%)   0.7451* H   4 s(100.00%)
                                            1.0000  0.0000
     4. (1.99904) CR ( 1) B   1           s(100.00%)
                                            1.0000  0.0000  0.0000  0.0000  0.0000
                                            0.0000  0.0000  0.0000  0.0000
(...)
The NBO summary shows that molacular number 8 is the unoccupied molecular orbital with lowest energy ( -0.045 Hartree a.u.) which is also known as LUMO. This is the empty p orbital on boron atom. The negative energy indicates the extremely reactive property of BH3. The empty p orbital which makes the BH3 can behave like Lewis acid as it is desperately to accept a pair of electron in order to reach even stable state.
Natural Bond Orbitals (Summary)
 Natural Bond Orbitals (Summary):

                                                            Principal Delocalizations
           NBO                        Occupancy    Energy   (geminal,vicinal,remote)
 ====================================================================================
 Molecular unit  1  (H3B)
     1. BD (   1) B   1 - H   2          1.99851    -0.43699
     2. BD (   1) B   1 - H   3          1.99851    -0.43699
     3. BD (   1) B   1 - H   4          1.99851    -0.43689
     4. CR (   1) B   1                  1.99904    -6.64518  10(v),11(v),12(v)
     5. LP*(   1) B   1                  0.00000     0.67702
     6. RY*(   1) B   1                  0.00000     0.37187
     7. RY*(   2) B   1                  0.00000     0.37187
     8. RY*(   3) B   1                  0.00000    -0.04545
     9. RY*(   4) B   1                  0.00000     0.43447
    10. RY*(   1) H   2                  0.00032     0.90028
    11. RY*(   1) H   3                  0.00032     0.90029
    12. RY*(   1) H   4                  0.00032     0.90043
    13. BD*(   1) B   1 - H   2          0.00149     0.41101
    14. BD*(   1) B   1 - H   3          0.00149     0.41099
    15. BD*(   1) B   1 - H   4          0.00149     0.41051
       -------------------------------
              Total Lewis    7.99456  ( 99.9320%)
        Valence non-Lewis    0.00447  (  0.0559%)
        Rydberg non-Lewis    0.00097  (  0.0121%)
Frequencies and Vibrations
The frequencies and vibrations were calculated using the optimised structure. The job type was frequency. The method and basis set was the same as previous work. An extra keyword "pop=(nbo,full)" was added.
Code for frequency analysis
# freq b3lyp/3-21g pop=(nbo,full) geom=connectivity

BH3 frequency

0 1
| No. | Vibration | Frequency | Intensity | Symmetry D3h point group |
| 1 | 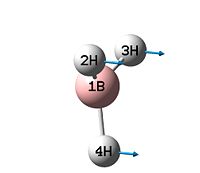 |
1146 | 93 | A2" |
| 2 | 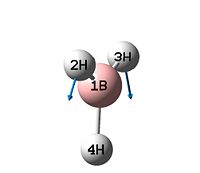 |
1205 | 12 | E' |
| 3 |  |
1205 | 12 | E' |
| 4 | 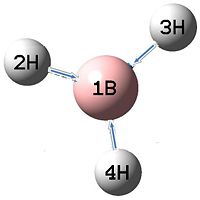 |
2592 | 0 | A1' |
| 5 | 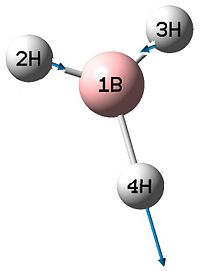 |
2730 | 104 | E' |
| 6 | 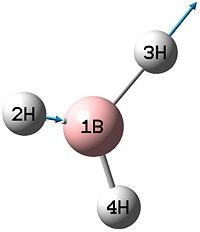 |
2732 | 104 | E' |

BH3 is a nonlinear molecule, therefore it should have 3N-6 vibration modes.
3 × 4 - 6 = 6 vibration modes
There are 6 vibration modes which is the same as predicted. However, the IR spectrum only shows 3 peaks. This is because that there are 2 sets of degenerate frequencies (1205 cm-1 and 2730 cm-1)and one vibration has no net dipole moment (IR inactive). The systematic error of the calculation method is around 10%, hence the 2730 and 2732 cm-1 frequencies are consider as degenerate set. As a result, the spectrum only shows 3 peaks.
BCl3 Analysis
Geometry Optimisation
A BCl3 molecule was drawn in Gassview by replace the H atom in the optimised BH3. The symmetry of the molecule is set to the D3h point group with very tight tolerance (0.0001). Method of calculation is DFT-B3LYP and the basis set is LanL2MB.
Code for optimisation
# opt b3lyp/lanl2mb geom=connectivity

BCl3 optimisation

0 1
| Energy / Hartree a.u. | -69.4 |
| RMS Gradient Norm | 0.00 |
| Dipole moment/ Debye | 0.00 |
| Point group | D3h |
| B-Cl bond length / Å | 1.87 |
| Bond angle /° | 120.0 |
Frequencies and vibrations
The frequency calculation was based on the optimised BCl3 geometry. The job type is frequency. The method and basis set is DFT-B3LYP/LanL2MB.
Code for frequency analysis
# freq b3lyp/lanl2mb geom=connectivity

BCl3 frequencies and vibrations

0 1
| No. | Frequency | Intensity | Symmetry D3h point group |
| 1 | 214 | 4 | E' |
| 2 | 214 | 4 | E' |
| 3 | 377 | 44 | A2" |
| 4 | 417 | 0 | A1' |
| 5 | 939 | 259 | E' |
| 6 | 939 | 259 | E' |
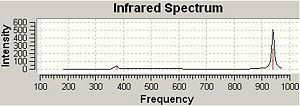
The frequencies and vibrations of BCl3 shows similar characteristic behavior as BH3. However the wavenumber is generally smaller than BH3. This is because Cl atom is heavier than H atom. All the frequencies are positive, hence the structure is the most stable conformation.
Discussion
The optimised ground state of BCl3 structure is expected to be D3 symmetry point group and the symmetry used by Gaussview is identical. All the frequencies are positive, hence the structure is a minima.
The calculation method is DFT-B3LYP and the basis set is LanL2MB.
The calculation method is based on density function theory and B3LYP is Becke three parameter hybrid functionals with LYP expression for local correlation. It provides good approximation and short range correlations.LanL2MB[3] is a pseudo-potential basis set. For the element higher than period three, it is really hard to describe the electron structure using normal basis set. This is because those elements have larger core radius and need to use effective core potentials (ECPs) to calculate the electrons near the core. This is important when considering the relativistic effect between the electrons and the core.
Comparing result with different calculation method or basis set is not sensible as the number of Gaussian function used to describe the electron structure is different. There for it is necessarily to use identical method and basis set for both optimisation and frequency analysis.
The bond length and bond angle is in good agreement with lit.[4] which shows that the calculation results are reliable. Sometime the Gaussview does not show a bond where we expected. This is because the Gaussview has a default bond length range for specific bonding with respects to the bonding atoms. If the bond length is not in the default range, then the software will treat it as no bonding. e.g. The BH3 molecule before optimisation.
The definition of a bond[5] can be described as an attractive association between atoms or ions that is stable under the conditions of examination.Therefore, for some molecule such as borane cluster, It is hard to define the chemical bond using bond length as a parameter. A chemical bond can be defined experimentally by X-ray diffraction (bond length and angle)and Calorimetry (bond enthalpy)...etc.
The time taken to complete the optimisation is 12 seconds and 18 seconds for frequency analysis. The time taken for small molecule is short. In real world, people are more interested in large molecules such as protein. The time taken for large molecules would be even longer than overnight or weeks. Gassiview is capable to calculate molecules[6] with maximum 500 atoms and 5000 primitive shell. The number is not limited by the calculation method but limited by the CPU memory.
Mo(CO)4L2 Isomers Analysis
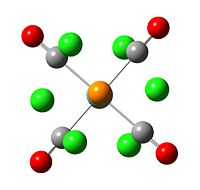
Mo(CO)4L2 has cis and trans isomers. The number of CO active vibration bands is relative to the symmetry of the complex. Cis isomer would expected to have four active vibrational bands and trans isomer only has one. Both cis and trans Mo(CO)4Cl2 isomers are studied by optimisation and frequency analysis using Gaussview.
Geometry optimisation
The cis/trans isomers were drawn on Gaussview with the right conformation, then optimised using DFT-B3LYP method and LanL2MB basis set. An extra word of "opt=loose" was added.
Code for first optimisation
# opt=loose b3lyp/lanl2mb geom=connectivity

Mo_cis/trans_isomer_optimisation

0 1
 |
 |
| trans isomer first optimisation summary | cis isomer first optimisation summary |
| trans output file | cis output file |
The trans isomer reached minimum energy with two PCl3 ligand in a staggered conformation. The cis isomer does not show any particular symmetry.
The bond between P and Cl are disappeared.
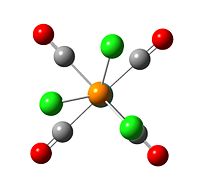
Further optimisation was carried out by using the optimised log file of each isomer, changing the basis set to LanL2DZ and restrain the tans isomer to have eclipse conformation and the torsion angle of CO-Mo-P-Cl in cis isomer was modified to be 0° = 180°. The LanL2DZ uses more Guassian functions than LanL2MB which allows us to get more accurate results. Extra basis was also used to modurate the D orbital for P atoms.
Code for second optimisation
# opt rb3lyp/lanl2dz geom=connectivity extrabasis int=ultrafine
scf=conver=9

cis/trans_isomer_optimisation_extra_basis

0 1

---the end of file---
[blank line]
P 0
D  1  1.0
0.55  0.100D+01
****
[blank line]
 |
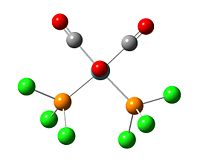 |
| eclipse trans isomer with optimisation summary | fixed torsion angle cis isomer first optimisation summary] |
|
|
|
| trans output file | cis output file |
The second optimisations give lower enegery for both cis and trans isomers than first optimisation. This is because the energey system has multiple minima, and the calculation could easily converged to a false minima, which have higher energy than globle minima with RMS convergent gradient less than 0.001. Hence the inial structure of the calculation is important.
The P-Cl bonds are appeared after second optimisation. This is because the extra basis code put in the input file allows Gaussview to deal with the D orbital in the P atoms. The distance between P-Cl is decreased from 2.41 Å to 2.11 Å. As a result, the Gaussview reconises P-Cl bond afer second optimisation.
Frequency and Vibration
The frequency analysis was preformed using the second optimised log file. The job type was frequency. The method and basis set is consistent with optimisation.
Code for frequency analysis
# freq b3lyp/lanl2dz geom=connectivity extrabasis int=ultrafine
scf=conver=9

cis/trans_isomer_frequency_extrabasis

0 1

---the end of file---
[blank line]
P 0
D  1  1.0
0.55  0.100D+01
****
[blank line]
trans isomer frequency output file cis isomer frequency output file
discussion
Structures
| lit.[7] trans [Cr(CO)4(PPh3)2] | trans [Mo(CO)4(PCl3)2] | |
| mean P-M bond length / Å | 2.36 | 2.42 |
| mean M-C bond length / Å | 1.87 | 2.05 |
| P-M-P bond angle/ ° | 176.7 | 177.3 |
| mean P-M-C bond angle / ° | 89.5 | 90.0 |
The literature value of Mo(CO)4(PPh3)2 can not be found. However, the geometry properties of trans [Cr(CO)4(PPh3)2[7] is used here for comparison. Cr is the same group as Mo, therefore Mo(CO)4(PCl3)2 should have similar propertie with slightly longer bond distance since the atomic radius is larger.
The calculated bond angle is in good agreement with literature value. The calculated bond length is slight longer than literature value which is expected since Cr has smaller atomic radius. The size of P-M(M = metal atom) bond length is generally longer than M-C bond for both literature value and calculated results. In conclusion the calculated result gives good prediction relative to reality.
| lit.[8] cis [Mo(CO)4(PPh3)2] | cis [Mo(CO)4(PCl3)2] | |
| mean P-Mo bond length / Å | 2.58 | 2.48 |
| mean Mo-C bond length / Å | 2.04 | 2.03 |
| P-Mo-P bond angle / ° | 104.6 | 94.3 |
| P-Mo-C (trans to P) bond angle / ° | 163.7 | 175.8 |
| P-Mo-C (cis to P) bond angle/ ° | 80.6 | 88.7 |
The calculated bond length is in good agreement with the literature value. Therefore the calculation provides really good prediction for the bond length. However, the calculated bond angle is not as close as the literature value. This is because that in calculation model, Cl atoms were used instead of phenyl ring, hence the space taken by the PCl3 ligand is smaller than PPh3. As a result, the bond angle will be different due to the restain exprienced by the other ligands is not the same. However, the trend of the bond angle size are the same. P-Mo-C(trans to P) > P-Mo-P > P-Mo-C(cis to P). To sum up, the calculated geometry is in good agreement with the literature value.
The optimised cis isomer structure belongs to C2v symmetry point group and the optimised trans isomer structure is D4h point group. The bond length are relatively close.
Relative energy
| Isomer | Energy / Hartree a.u. | Energy / kJ mol-1 | Relative Energy / kJ mol-1 |
| trans | -623.69415609 | -1637509.007 | -3.26554439 |
| cis | -623.69291231 | -1637505.741 | 0 |
Trans isomer has lower energy than cis isomer by 3.2 kJ mol-1, hence the trans isomer is more stable than cis isomer. This is not a large enegery difference. A typical π bond engery is 3 kJ mol-1. The calculated enegry has an error ≈ 10 kJ mol-1, which means that energy difference by few kJ mol-1 could just be calculation error. However, the method and basis set used are identical, the realitive enegry comparison should be valuable.
Cis isomer with bulky ligand would experience higher steric hindrance than trans isomer. Therefore the small energy difference can be controled by using difference size of ligand and yield the desired product.
IR spectra and Vibrations
Low energy vibrations
| No. | Vibration | Frequency | Intensity |
| 1 | 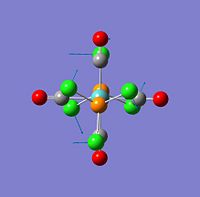 |
-6 | 0 |
| 2 |  |
-2 | 0 |
Only tran isomer has two negative frequency. The negative frequency shows that the frequency calculation is not converged. The low frequency vibration is not highly localised and it can be normally observed at room temperature.
Trans isomer
| No. | Vibration | Frequency | Intensity | Symmetry D4h point group |
| 42 | 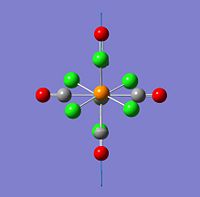 |
1939 | 1615 | eu |
| 43 | 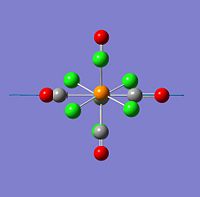 |
1940 | 1602 | eu |
| 44 | 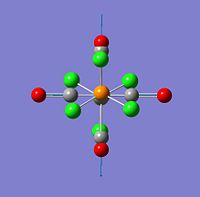 |
1967 | 0 | a1g |
| 45 | 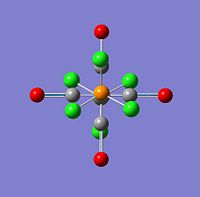 |
2026 | 0 | a1g |

The active IR band of CO strech is 1901 cm-1 for the trans Mo(CO)4(PPh3)2 in literature[9]. The calculated active IR band is 1940 cm-1. Considering that there is 10% systematic error of frequency in the associate with the calculation method, the calculatin only give rough prediction for the frequency. Also, in the calculation modle, Cl atoms were used to mimic the phenyl group, this could also be the reason why the calculated frequency is not in good agreement with literature value. However, the number of active IR band is accurately calculated as it is the same as literature value. In conclusion, calcultion using computer modelling could give accurate number of active IR bands, but the frequency would be only a rough prediction due to the systematic error of calcultion and the Cl atom can not exactly represent the phenyl group.
Cis isomer
| No. | Vibration | Frequency | Intensity | Symmetry C2v point group |
| 42 | 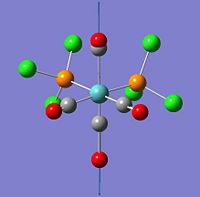 |
1939 | 1596 | eu |
| 43 | 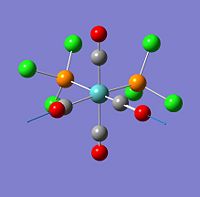 |
1942 | 822 | eu |
| 44 | 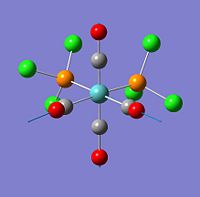 |
1953 | 592 | a1g |
| 45 |  |
2020 | 541 | a1g |

The literature[9] value for cis Mo(CO)4(PPh3)2 1897, 1908, 1927 and 2023 cm-1. The calculated number of active IR band is the same as literature value. All the CO streches are active. The calculated frequency is poorly match with literature due to the systematic error associated with calcultion method and Cl atom can not mimic phenyl group prefactly.
Mini Project
The aim of the project was to investigate the bond properties of small metallic cluster E52- (E=Ge and Pd). The structure charactorisation of adding or removing an extra electron from Ge52- cluster were also studied.
Introduction
The uses of macrocyclic polyethers as cation-sequestering reagent makes it is possible to crystalise small ion clusters, e.g. E93-, E92- and E52- (E=Ge, Sn, Pb). Those zintl ions were found to have similar properties as boranes.[10]
The metallic ion clusters does not have ordinary two-centre-two-electron bonds. It has a mixture of two-centre-two-electrons and three-centre-two-electron bonds. Another way of thinking about the molecular bonding will be imagining the whole molecule as cluster and holding by an electron cloud.
The structure of metallic cluster can be predicted by Wade's Rules[11]. Nowadays, due to the increasing of computer power and improvement of calculation method, it is possible to look at the structure of such molecule by ab initio and density function study. In the past researches[10], the geometry and electronic structure of E93-, E92- were studied. It shows that the cluster would change its structure by having an extra electron in the cluster and it would adept an transition structure between closo- and nido- structure.
Results and analysis
E52- (E=Ge and Pb) cluster
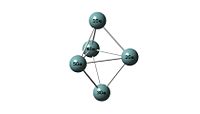
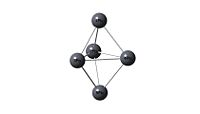
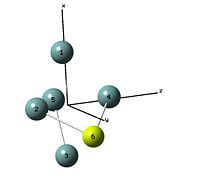
*The bond between atoms were drawn after optimisation in order to give better vision of the shape of the cluster. It is not drawn by the Gaussview and it does not represent a typical bond. The original optimised structure is shown as the Jmol model.
 |
 |
|
|
|
| Ge52- cluster output file | Pb52- cluster out put file |
By using Wade's rules [11], the strucure of E52- was calculated as follows.
Number of electrons contributed by E :
5 × 4 = 20 electrons
Number of electrons contributed by charge:
2 electrons
Total number of electrons in the cluster:
20 + 2 = 22 electrons
Since n = 5 and the total electron count is 4n+2, therefore E52- should be 5 vertexes closo- structure ( Trigonal Bipyramid).
The optimisation results confirm the prediction.
Bond length and point group
The original structure before optimisation was trigonal bipyrimidal structure which has D3h point group. The bond lengths were set to be equal to double colvalent radius long. (Ge-Ge = 2.6 Å and Pb-Pb = 2.9 Å). The charge was set to -2 and singlet multiplicity.
# opt b3lyp/lanl2dz geom=connectivity int=ultrafine scf=conver=9

Ge5(-2)_cluster_optimisation

-2 1
The optimised structure is still D3h symmetry, but the bond length has changed. There two types of metal atom in the cluster.
|
 |
The optimised E52- cluster has D3h for both Ge and Pb. This is identical with Wade's rules prediction. Although there is only one type of element in the cluster, but the geometry calculation shows there are tow type of E. The connectivity and bond distance between them were different. The trend of bond length were A-A > B-B >A-B. B type atom conected to four other atoms whereas type A atom only connected to three.
Molecular orbitals
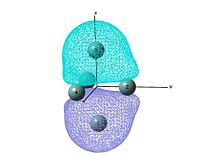
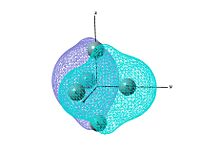
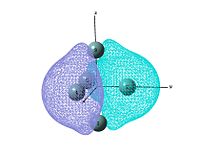
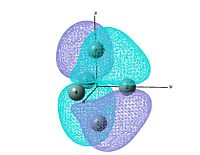
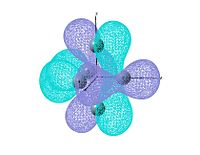
The molecular orbitals are studied by using the output file of log file and change the job type to energy. NBO is not investigated since it is not sensible to talk about bonding of a cluster type molecule. The bond drawn in the digaram is more illustrating the skeloton of the cluster, but the normally chemical bond. The method and basis set used is the same as optimisation.
# b3lyp/lanl2dz geom=connectivity int=ultrafine scf=conver=9

Ge5(-2)_cluster_molecular_orbitals

-2 1
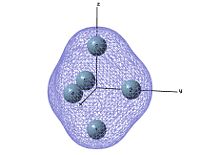
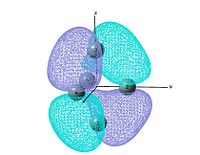
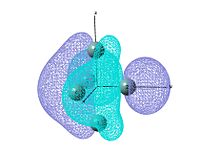
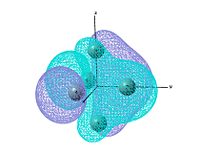
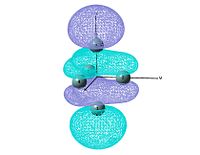
output file The MO shows that the electron density is localised mainly inside the cluster, and there is no visualised bond can be seen in the optimised structure in Gaussview. Ge atoms are hold together by a electron cloud and forming cluster type molecule.
 |
 |
 |
 |
 |
 |
 |
 |
 |
 |
 |
 |
MGe5(M=Be, Mg)
In the literature[10], the Ge52- ion cluster was generated by using macro cyclic polyether as cation sequestering agent (e.g. 18-crown-6). In this section, the structure of the ion cluster with a group II metal floating outside and inside the ion cluster is studied.
# opt b3lyp/lanl2dz geom=connectivity int=ultrafine scf=conver=9

MgGe5_cluster_optimisation

0 1
# opt b3lyp/lanl2dz geom=connectivity int=ultrafine scf=conver=9

BeGe5_cluster_optimisation

0 1
 |
 |
|
|
|
| output file of MgGe5 cluster with the Mg atom placed outside the cluster initialy | output file of BeGe5 cluster with the Be atom placed inside the cluster initialy |
The results shows that when the alkaline metal ion is floating outside and inside the cluster, the alkaline metal orbital will mix with the frontier orbital of the ion cluster. The structure of the ion cluster is the distorted in order to minimise the free energy of the molecule. The optimised structure is no longer D3h symmetry. The final point group of both molecules were C1 symmetry.
The Ge52- structure change with extra electrons
The calculation is done by using optimised Ge52- log file as initial structure and change the charge to 3- and multiplicity to doublet. The method and basis set is identical as previous calculation. The code for optimising Ge53-:
# opt b3lyp/lanl2dz geom=connectivity int=ultrafine scf=conver=9

Ge5(-3)_cluster_optimisation

-3 2
The Ge54- structure is optimised by using the optimised Ge54- log file and change the charge to 4- and multiplicity to singlet.
The code for optimising Ge54-:
# opt ub3lyp/lanl2dz geom=connectivity int=ultrafine scf=conver=9

Ge5(-4)_cluster_optimisation

-4 1
Bond length and point group
 |
 |
 |
| Ge53- cluster output file | Ge52- cluster | |
|
|
|
|
| Ge52- cluster | Ge53- cluster | Ge54- cluster | |
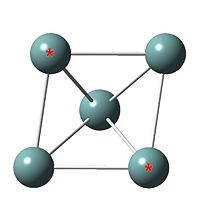
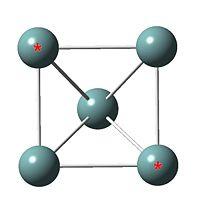
| *-* distance / Å | 2.96 | 3.47 | 3.84 |
| Point group | D3h | C2v | C4v |
| Shape | trigonal bipyramid | parallelogram based pyramid | square based pyramid |
| Energy /Hartree a.u. | -18.8(5434758) | -18.5(7565154) | -18.1(6067243) |
| Realative energy /Hartree a.u. | -0.69367515 | -0.41497911 | 0 |
| Realative energy / kJ mol-1 | -1821.24 | -1089.53 | 0 |
As more extra electron added in the system, the *-* length gets wider. The point group changed from D3h to C2v then finally C4v. The extra electron filled in LUMO orbital and weaken the attractive force between the two highted atoms.
The most stable cluster is Ge52- and the cluster gets less stable as extra electron added in the system. This is because the cluster is already negatively charged and extra electron in the system would increase the electron-electron repulsion force, hence the cluster is less stable.
Conclusion
The calculated geometry is the same as predicted by Wade's rules[11]. It proves the validation of Wade's rules[11]. The geometry data of E52- was not found, but the point group is the same as literature[12].
Although the cluster structure was not maintaining its original shape with group II alkaline metal ion.
The advantage of computional simulation is able to calculate the molecule which is unstable in the reality, and might be able to found away to get a stable compound by trying all different possible ligand until a sensible solusion is found. It is more time efficient and economical comparing with lab based experiment.
Evaluation
1.Comparing the calculated results with literature value to see the reliability of calculation.
2.Examing the change of geometry of removing electron from the Ge52-.
3.Calculating larger zintle ion cluster such as E92-.
4.Study the molecule in more detail and draw MO diagram using LCAO method.(The MO diagram was attemped, but not succsefully drawn.)
5.Using more complecated model for mimic the cluster structure with cation in the system such liquid ammonia solution or 2,2,1-crypt-Na+.
6.Discuss about the application of cluster as a catalyst.
References and Citations
- ↑ http://www.gaussian.com/g_tech/g_ur/m_basis_sets.htm
- ↑ http://www.ch.ic.ac.uk/hunt/teaching/teaching_MOs_year2/L3_Tut_MO_diagram_BH3.pdf
- ↑ http://www.iams.sinica.edu.tw/lab/wbtzeng/labtech/basis_set.htm
- ↑ W. Gerrard and M. F. Lappert, Chemical Reviews, 1958, 58,1081DOI:10.1021/cr50024a003
- ↑ Gilbert N. Lewis, Journal of the American Chemical Society, 1916, 38, 762DOI:10.1021/ja02261a002
- ↑ http://chemistry.umeche.maine.edu/Modeling/abinit.html
- ↑ 7.0 7.1 D. W. Bennett, T. A. Siddiquee, D. T. Haworth, S. E. Kabir, F. K. Camellia, J. Chem. Crys., 2004, 34, 353-359.DOI:10.1023/B:JOCC.0000028667.12964.28
- ↑ D. J. Darensbourg, R. L. Kump, Inorg. Chem., 1978, 17, 2680-2682. DOI:10.1021/ic50187a062
- ↑ 9.0 9.1 D. J. Darensbourg, R. L. Kump, Inorg. Chem., 1978, 17, 2680-2682. DOI:10.1021/ic50187a062
- ↑ 10.0 10.1 10.2 S. C. Sevov and J. M. Goicoechea, Organometallics, 2006, 25, 5678-5692.DOI:10.1021/om060480o
- ↑ 11.0 11.1 11.2 11.3 D. M. P. Mingos, Accounts of Chemical Research, 1984, 17, 311-319.DOI:10.1021/ar00105a003
- ↑ J. D. Corbett, Chemical Reviews, 1985, 85, 383-397.DOI:10.1021/cr00069a003 10.1021/cr00069a003

