Rep:Mod2:yahtingkoh123
Mod2: Inorganic
BH3
Optimisation of BH3
The constructed molecule of BH3 was optimised with Gaussian [1]. The method used here is B3LYP, with basis set 3-21G. A simple basis set like 3-21G can be used, since BH3 is a small and symmetrical molecule which is not demanding to optimise.
| File type | .log |
| Calculation Type | FOPT |
| Calculation Method | RB3LYP |
| Basis Set | 3-21G |
| Charge | 0 |
| Spin | Singlet |
| E(RB3LYP) | -26.4623 a.u. |
| RMS Gradient Norm | 0.0002 a.u. |
| Imaginary Freq | 0 |
| Dipole Moment | 0.00 Debye |
| Point Group | D3H |
| Job cpu time | 0 days 0 hours 0 minutes 26.0 seconds |
The optimised B-H bond distance is 1.19Å and the H-B-H bond angle is 120.0°.
Vibrational Analysis
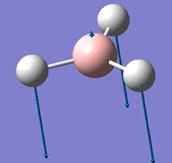
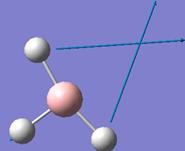
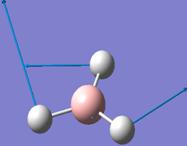
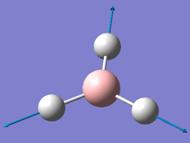
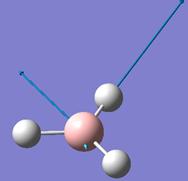
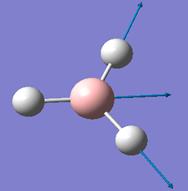
Frequency analysis was done on the optimised BH3 structure. The vibrational modes associated with the frequencies are tabulated below:
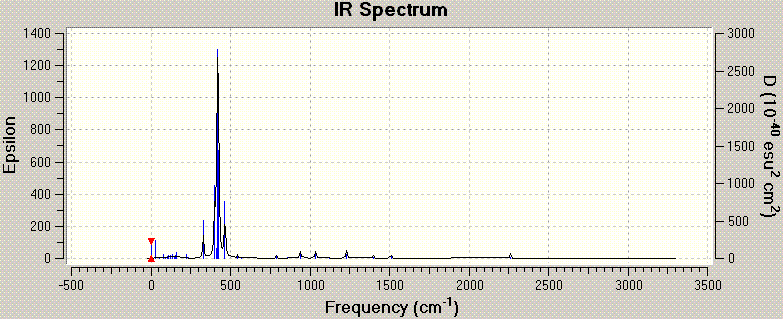
In the infrared (IR) spectrum, there appears to be only 5 peaks, while there are 6 vibrational frequencies (and modes) listed. This occurs as the IR spectrum measures changes in dipole moments generated by the vibrations. In BH3, which has D3H symmetry, the symmetric stretch involving all 3 H atoms moving in and out of the B centre in a concerted motion results in no change in dipole moment of the molecule. Thus, although the vibrational mode still exist, the intensity of the stretch is zero, and this mode is non-infrared active.
Population analysis BH3
The population analysis done on BH3 using the 'Energy' calculation. The related documents can be found here: DOI:10042/to-2592
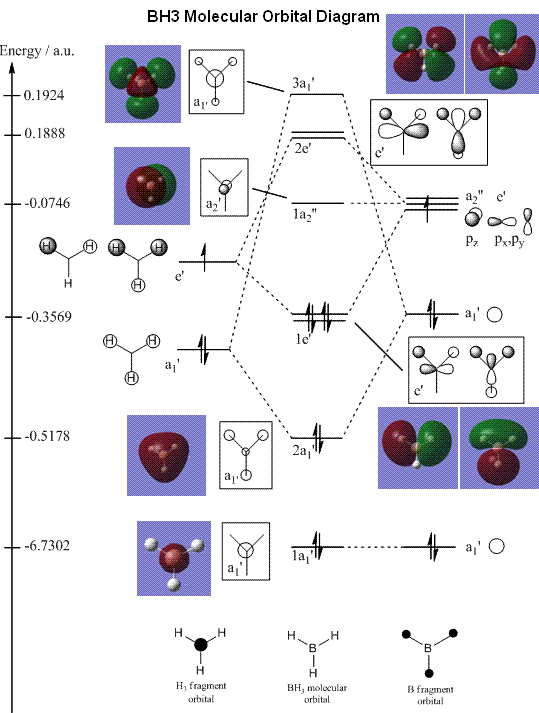
The molecular orbital (MO) diagram of BH3 is constructed, with reference to the Year 2 lecture notes on Molecular Orbitals in Inorganic Chemistry by Dr. Tricia Hunt. Screenshots were also taken of the relevant MOs obtained from the population analysis, and placed beside the pictorial MO for comparison.
The MO diagram predicted from qualitative MO theory is in close agreement with the MO diagram calculated with Gaussian energy function. By comparing the predicted MO diagram with that obtained from Gaussian, the energy levels and orbital representations determined from MO theory agree closely with those calculated. However, there is a slight difference with the unoccupied molecular orbitals, where the H orbitals appear much bigger in the calculated representation, than in MO theory's prediction.
Also, MO theory has a limitation, in that the relative energies (and therefore relative ordering) of the MOs are difficult to evaluate. In the notes, the 3a1' orbital was placed below the 2e' orbitals. This was on the account that the a1' energy levels are lower than the e', hence even with strong s-s interactions, it is probably that the 3a1' lies below the 2e'. However, the energy calculated by Gaussian shows that the 2e' MOs in fact have slightly lower energy than the 3a1'.
Hence, MO theory is largely accurate and useful for predicting the MO diagram (and hence reactivity) of molecules. It provides a very good picture of a real bonding picture, without having to use computational methods. However, for a truly accurate bonding picture, computational methods have to be employed, since there is a limit to how well we can predict the energy levels of the molecular orbitals.
BCl3
Optimisation of BCl3
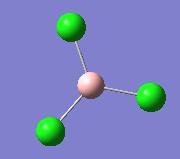
| File type | .log |
| Calculation Type | FOPT |
| Calculation Method | RB3LYP |
| Basis Set | 3-21G |
| Charge | 0 |
| Spin | Singlet |
| E(RB3LYP) | -1398.8044 a.u. |
| RMS Gradient Norm | 0.00002 a.u. |
| Imaginary Freq | 0 |
| Dipole Moment | 0.00 Debye |
| Point Group | D3H |
| Job cpu time | 18.0 seconds |
| Calculated | Literature [2] | |
|---|---|---|
| B-Cl distance / Å | 1.78 | 1.742 |
| Cl-B-Cl angle / ° | 120.0 | 120 ± 3 |
•The calculated values were corrected to 0.01Å and 0.1°, since the accuracy of the calculation was only as such.
As above, the values calculated by Gaussian are agree closely with that of literature.
What are "Bonds"?
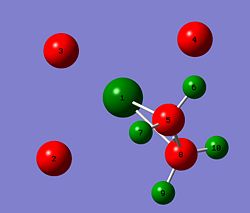
In some structures, Gaussview does not draw in the bonds where we expect, but that does not mean that the bond does not exist. This occurs as Gaussview has an internal list of bond distances, which are set up mainly for organic molecules. Inorganic bonds can sometimes be longer than those found in organic molecules. When the computed bonds are outside of Gaussview's list of bond distances, Gaussview does not recognise the bond and does not draw the bonds in, hence there appears to be "no bond".
A chemical bond is any interaction between atoms or molecules which allows the formation of polyatomic compounds. Examples of such interactions are ionic, covalent, dipole-dipole and hydrogen-bonding. Essentially, it is the attraction caused by the electromagnetic force between opposing charges, either between electrons and nuclei, or a result of dipole moments.
Frequency Analysis
In optimising a structure, we are trying to find the lowest energy structure possible. This is at the optimal bond distances, where the positive potential energy generated by nuclear repulsion is matched with the negative potential energy generated by nuclear-electron attraction. At minimum energy, the gradient of the graph is zero (though theoretically it is not possible to reach absolute zero due to the limiting precision and accuracy of the methods). A frequency analysis is carried out to confirm that we are at the minimum of the potential energy curve. As the frequency calculated is a second derivative of the energy, all frequency values calculated should be positive (d2y/dx2 = positive for minima). One negative frequency would mean that there is a maximum point, corresponding to a transition state. If there are more than one negative frequency, the optimisation has not reached a turning point.
The same method and basis set must be used for both calculations, since the accuracy depends on the methods and basis sets used. Since frequency is the second derivative of the energy, it would change with regards to the energy curve calculated. If it is changed, for example from 3-21G to 6-21G, the frequency analysis might show negative values, since the energy obtanied for the 6-21G should be lower.
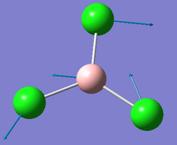
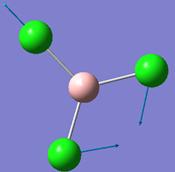
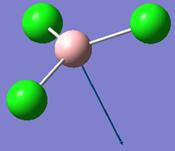
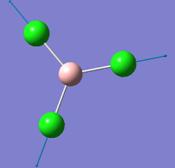
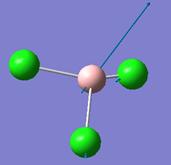
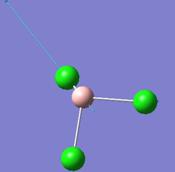
The ground state symmetry of BCl3 is expected to be D3H. However, in the frequency analysis, a C3H structure is obtained instead. This might be because Gaussian frequency analysis does not recognise the BCl3 as symmetrical in the vertical plane (lacking in σv symmetry).
Cis and Trans isomerism
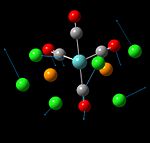
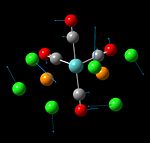
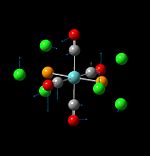
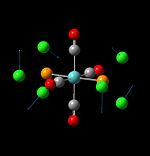
Optimisation of Cis- and Trans- Mo(CO)4(PCl3)2
The optimisation of the structures of the cis- and trans- complex was done. The Gaussian RB3LYP calculation method was used with a simple basis set LANL2MB first with the "opt=loose" criteria, so that the calculation would not take too long. After the first optimisation, the structures were than optimised a second time, with the basis set LANL2DZ, which is more accurate than the previous basis set.
The summary of the computed data is tabulated below:
| Cis-complex | Trans-complex | |||||||
|---|---|---|---|---|---|---|---|---|
| DOI | DOI:10042/to-2552 | DOI:10042/to-2551 | ||||||
| File type | .log | .log | ||||||
| Calculation type | FOPT | FOPT | ||||||
| Calculation method | RB3LYP | RB3LYP | ||||||
| Basis set | LANL2DZ | LANL2DZ | ||||||
| E(RB3LYP) | -623.5571 a.u. | -623.5760 a.u. | ||||||
| RMS Gradient Norm | 0.0000 a.u. | 0.0000 a.u. | ||||||
| Imaginary Freq | - | - | ||||||
| Dipole Moment | 1.31 Debye | 0.30 Debye | ||||||
| Point Group | C1 | C1 | ||||||
| Job cpu time | 1 hour 43 minutes 51.9 seconds | 1 hour 27 minutes 15.7 seconds | ||||||
| Structure |
|
|
The trans- isomer is found to be more stable than the cis- isomer, by ~ 50kJ/mol. This is as predicted, since the trans isomer reduces steric hindrance between the bulky phosphine groups, and there is a cancellation of dipole moments, resulting in an overall smaller dipole. However, this difference in energy is very small. This suggests that the cis- and trans- isomers are labile at room temperature. To increase the stability of the trans- isomer over the cis- isomer, more bulky ligands can be used, for example PPh3. This increases the steric clash between the PPh3 ligands in the cis- isomer, resulting in a destabilisation of the cis- isomer compared to the trans- isomer. A more electronegative P substituent, for example Fluorine instead of Chlorine, would also increase the dipole moment and decrease the stability of the cis- isomer.
The geometry of the computed trans-[Mo(CO)4(PCl3)2] complex was compared with Hogarth et. al.'s data obtained from X-ray crystallography of trans-[Mo(CO)4(PPh3)2] [3].
| Computed | Literature | |
|---|---|---|
| Mo - P | 2.44 | 2.500 |
| Mo - C | 2.06 | 2.005 |
| P - C (P-Cl in computed) | 2.24 | 1.828 |
| C - O | 1.17 | 1.164 |
| P-Mo-P | 177.4 | 180.0 |
| P-Mo-C | 88.7 | 87.2 |
| C-Mo-C (trans) | 180.0 | 180.0 |
| C-Mo-C (cis) | 90.5 | 92.1 |
The computed data correspond well with literature data. This shows that the optimised structure correspond closely to the structure obtained from synthesis. There is also little difference between the two data, suggesting that the substitution of the Ph groups on the P centres to Cl groups did not affect the structure of the complex much.
Frequency Analysis
Cis- frequency: DOI:10042/to-2560
Trans- frequency: DOI:10042/to-2559
Vibrations of very low frequencies
The low frequency vibrations require little energy to occur, since energy is proportional to the frequency. As such, these vibrations would be able to occur at room temperature, i.e. the complexes undergo low-amplitude rocking even at room temperature.
Carbonyl Stretching frequencies
The computed C=O stretching frequencies are compared with literature [4]. The C=O stretching frequency will depend on the isomers. Since PCl3 is also a good п-acceptor, its presence will result in a decrease in п backbonding into the C=O п* orbital, overall increasing the C=O bond strength (and hence stretching frequency).
| Computed Frequency / cm-1 | Computed Intensity | Lit. Frequency / cm-1 | Point Group (C2v) |
|---|---|---|---|
| 1945 | 763 | 1986 | B2 |
| 1949 | 1498 | 1994 | B1 |
| 1958 | 633 | 2004 | A1 |
| 2023 | 598 | 2072 | A1 |
| Computed Frequency / cm-1 | Computed Intensity | Lit. Frequency / cm-1 | Point Group (D4H) |
|---|---|---|---|
| 1950 | 1475 | 1896 | Eu |
| 1951 | 1467 | 1896 | Eu |
| 1977 | 1 | - | B1g |
| 2031 | 4 | - | A1g |
The computed values lie within a similar range as the literature values. However, there is some discrepancy in the stretching frequencies. This might be because Gaussian does not treat п-backbonding well, and hence the effects of increased C=O bond strength was not seen.
There are a total of 4 C=O stretches. In the cis- complex, all 4 vibrational modes are visible in the infrared spectrum. All 4 stretches result in a change in dipole moment of the molecule, and are hence IR-active. On the other hand, the trans- complex has a higher symmetry (D3H). Two of the stretches (B1g and A1g) result in no change in dipole moment, and are hence non-IR active. This explains the lack of two C=O frequencies in literature.
Mini Project: Exploring Metal Alkenes and Metallocycloalkanes
Introduction
Metal alkenes were first introduced to us in the Second Year Transition Metals and Catalysis course. Unlike free alkenes which undergo electrophilic addition reactions, coordinated alkene ligands are susceptible to nucleophilic attack. A caveat to that is that backbonding to the alkene C=C п* reduces the δ+ charge on the alkene, thereby reducing the reactivity towards nucleophiles. With increased backbonding to the alkene, the C=C double bond character reduces, to a point where the H atoms are no longer planar with the C-C bond. Such complexes have been renamed metallocyclopropanes, since they are very much like alkanes.
The aim of this project is to investigate the transition metal-alkene bonding in a series of complexes and to compare key differences between their geometries, bond strengths and reactivities.
Zeise's salt and its derivatives
Zeise's salt, K[PtCl3(C2H4)] , is one of the first organometallic compounds to be reported. The bonding within this transition metal complex puzzled scientists for years and was finally successfully described by Dewar, Chatt and Duncanson.
In this study, [PtCl3(C2H4)] will be compared with [PtCl2(CO)(C2H4)]. The substitution of Cl with CO, which is a good π acceptor, changes the reactivity of this complex. The Pt-C and C=C bond strengths will be compared, and a Molecular Orbital analysis would be done on these complexes.
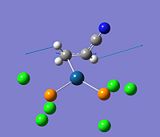
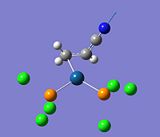
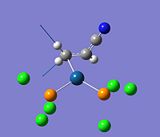
Subsequently, the metallocyclopropanes [Pt(PCl3)2(C2H4)], [Pt(PCl3)2(CH2=CHCN] and [Pt(PCl3)2(CH2=CHF)] will be compared. Many literature works cite PPh3 as the ligand instead. The Ph group on the phosphines were substituted with Cl here, since the stereoelectronics of Cl are very close to that of Ph, and that the Cl units would be much less computationally demanding. The effect on the σ and п Pt-C bonding due to the R group substitution on the alkene will be studied, via frequency analysis.
Method
The calculation method used here is the B3LYP. The low level basis set, LANL2MB was first used with "opt=loose", so that the calculations would be able to converge without difficulty. This calculation took a time ranging from 1 minute to 13 minutes (for the range of complexes). Subsequently, a second optimisation is done, with the basis set LANL2DZ, with electronic convergence=9. This time, the calculations took between 6 minutes and more than 1 hour.
Optimisation
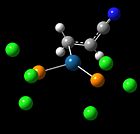
The 5 molecules were constructed and optimised. The summary of the second optimisation is tabulated below:
| [PtCl3(C2H4)] | [PtCl2(CO)(C2H4)] | [Pt(PCl3)2(C2H4)] | [Pt(PCl3)2(CH2=CHCN] | [Pt(PCl3)2(CH2=CHF)] | |
|---|---|---|---|---|---|
| DOI | DOI:10042/to-2638 | DOI:10042/to-2639 | DOI:10042/to-2640 | DOI:10042/to-2641 | DOI:10042/to-2642 |
| File type | .log | .log | .log | .log | .log |
| Calculation type | FOPT | FOPT | FOPT | FOPT | FOPT |
| Calculation method | RB3LYP | RB3LYP | RB3LYP | RB3LYP | RB3LYP |
| Basis set | LANL2DZ | LANL2DZ | LANL2DZ | LANL2DZ | LANL2DZ |
| Charge | -1 | 0 | 0 | 0 | 0 |
| Spin | Singlet | Singlet | Singlet | Singlet | Singlet |
| E(RB3LYP) | -242.8159 a.u. | -341.0422 a.u. | -300.5103 a.u. | -392.7212 a.u. | -399.7450 a.u. |
| RMS Gradient Norm | 0.0000 a.u. | 0.0000 a.u. | 0.0000 a.u. | 0.0000 a.u. | 0.0000 a.u. |
| Dipole moment | 5.74 Debye | 7.42 Debye | 4.39 Debye | 3.77 Debye | 3.60 Debye |
| Point Group | C1 | C1 | C1 | C1 | C1 |
| Job cpu time | 6 min 34.9 sec | 11 min 10.6 sec | 40 min 25.3 sec | 1 hour 33 min 31.3 sec | 1 hour 4 min 28.7 sec |
| Structure |  |
 |
 |
 |

|
Note that although the point groups computed were all C1, that is actually not the case. The complexes [PtCl3(C2H4)] and [Pt(PCl3)2(C2H4)] actually have a C2v point group. That is, when not considering the symmetries of the Hydrogens in C2H4[5] and of the PCl3 groups. Gaussian was unable to compute the Point Groups of the molecules, since the input (drawn) structures of the complexes were not exactly symmetrical, and the point groups were not restricted in the optimisation.
The structure of [PtCl3(C2H4)] is in agreement with X-ray crystallography of the salt[5]. 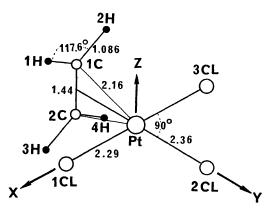
Dewar Chatt and Duncanson Model of Metal-Alkene Bonding
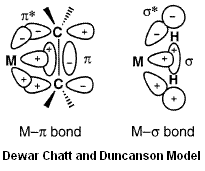
The Dewar-Chatt-Duncanson model of metal-alkene involves σ-donation from the filled C=C π-orbital into a empty metal orbital of suitable size, orientation and energy, and π-backbonding from a filled metal orbital into the empty C=C π* anti-bonding orbital. Hence, the C=C bond strength and stretching frequency is a good gauge of the metal-alkene bonding, which is dependent on many factors, including the other ligands on the metal, as well as the electronic effects of R substituents on the alkene.
Metal-Alkenes: Study of Ligand Substitution on Pt centre
The Cl ligand in [PtCl3(C2H4)] is substituted with a CO ligand to form [PtCl2(CO)(C2H4)]. Since CO is a better п-acceptor than Cl, it would result in less backbonding into the alkene C=C п* orbital, resulting in a higher C=C stretching frequency, and shorter bond lengths. This effect is investigated here.
Frequency Analysis
A frequency analysis was carried out. This confirmed that the structures were optimised to a minimum. The data obtained also enabled analysis of the vibrational spectrum of the complexes.
| [PtCl3(C2H4)] | [PtCl2(CO)(C2H4)] | |
|---|---|---|
| DOI | DOI:10042/to-2643 | DOI:10042/to-2644 |
| File type | .log | .log |
| Calculation type | FREQ | FREQ |
| Job cpu time | 5 min 15.8 sec | 7 min 22.0 sec |
The C=C stretching frequencies of the Pt-alkenes are tabulated below. The data is compared to literature values (where available). Also, since the C=C stretching frequency is proportional to the C=C bond strength and bond length, these data have been included for comparison too.
| [PtCl3(C2H4)] | Literature | [PtCl2(CO)(C2H4)] | Literature | |
|---|---|---|---|---|
| C=C stretching frequencies / cm-1 |  1246(m), 1534 1246(m), 1534 |
1243[7] | 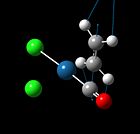 1284(m), 1557 1284(m), 1557 |
1436[8] |
| C=C bond length / Å | 1.42 | 1.40 [9] | 1.41 |
The computed data shows that the C=C stretching frequencies in [PtCl3(C2H4)] are smaller than those of [PtCl2(CO)(C2H4)]. This follows the expected trend, where decreased back-bonding into the alkene antibonding orbital results in a strengthening of the C=C bond, and hence a greater stretching frequency. This difference is however very small. This may be because the CO ligand is cis- to the ethene ligand. Since trans- electronic effects are generally stronger, a greater difference in C=C stretching frequencies would probably be observed if the CO was trans- to the alkene. The computed C=C bond length mirrors this effect too. However the difference is even smaller here, due to the limited accuracy of the calculations.
The computed data for [PtCl3(C2H4)] compare well with literature. The values obtained for [PtCl2(CO)(C2H4)] however, match poorly with literature values. This can be due to the fact that Gaussian does not compute π-backbonding into the CO ligands well, hence reduce the effects of the CO substitution.
Also, we can look into the C=O stretching frequency to gain insights on the degree of electron donation/back-bonding within the metal complex. The CO stretching frequency obtained from the calculation is 2052cm-1, compared to Alper's[8] finding of 2125cm-1. Again, the difference for this can be explained by Gaussian's reduced treatment of п-backbonding. Nakamoto[10] reported that most carbonyl complexes exhibit strong and sharp CO bands at ~2100 - 1800cm-1. The results obtained, together with Alper's findings, indicate that the CO in [PtCl2(CO)(C2H4)] has a stretching frequency belonging to the upper range, suggesting a lower degree of п-backbonding into the C=O п*. This is probably because some of the electron density of the metal centre is off-loaded into the alkene C=C п*.
Population Analysis
A population analysis was done on the metal-alkene complexes, so that their reactivities can be rationalised based on MO and NBO principles. The method used was B3LYP and basis set, LANL2DZ. The keywords "int=ultrafine scf=conver=9 pop=full" were added. The DOI are available here:
[PtCl3(C2H4)] DOI:10042/to-2664
[PtCl2(CO)(C2H4)] DOI:10042/to-2668
Molecular Orbital Analysis
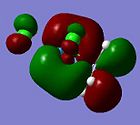
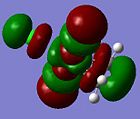
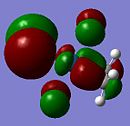
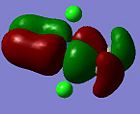
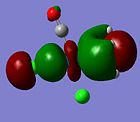
The molecular orbitals generated from the population analysis agrees with the Dewar, Chatt and Duncanson model of metal-alkene bonding, where there is σ-donation from the alkene п orbital into a metal orbital, and п-back donation from the alkene п* orbital. These effects are observed in the MO picture of both complexes.
| Orbital 30 (LUMO+1) | Orbital 29 (LUMO) | Orbital 26(HOMO-2) | Orbital 24 (HOMO-4) | Orbital 18 |
|---|---|---|---|---|
 |
 |
 |
 |
|
Here, it can be observed that there is σ-donation from the alkene п orbital in Orbital 24. However, this molecular orbital involves considerably large mixing of the ligand chlorine atomic orbitals. Orbital 26 and 18 shows п-back donation from the metal (dyz or dxz) orbital into the alkene п* orbital. This molecular orbital has less mixing of chlorine orbitals in Orbital 18. Note worthy is that the LUMO and LUMO+1 orbitals are the anti-bonding orbitals of the metal with the alkene (п or п*). An incoming nucleophile can hence attack these orbitals, resulting in nucleophilic reaction with an alkene (which is opposite to that from a free alkene, ie. electrophilic reactions).
| Orbital 35 (LUMO+3) | Orbital 33 (LUMO+1) | Orbital 32(LUMO) | Orbital 31 (HOMO) | Orbital 28 (HOMO-3) | Orbital 21 |
|---|---|---|---|---|---|
| LUMO + 3 | LUMO + 1 | LUMO | HOMO | HOMO - 3 | |
 |
 |
 |
 |
 |
|
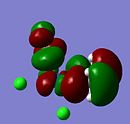
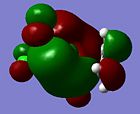
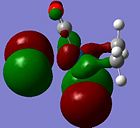
The molecular orbitals of the CO substituted Pt complex shows a similar picture. In Orbital 21, there is a very clear σ-donation from the alkene п orbital to the Pt dz² orbital. п-back donation is observed in Orbitals 31 and 28 (HOMO and HOMO-3). Again, the MOs in the LUMO region consist of anti-bonding orbitals from the Pt and alkene.
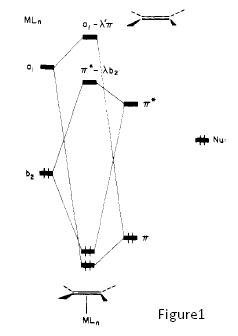
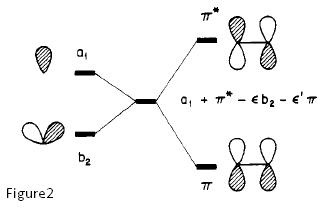
However, a point to note is that a nucleophile can add to an olefin, only when olefin slipping occurs, deforming to η1 coordination, activating the olefin[11]. Without this olefin slipping activation, the п-backbonding interaction of the C=C п* with the (lower energy, electron donating) metal orbital actually increases the energy of the resulting C=C п*. This means that nucleophilic addition is disfavoured compared to the free alkene. Olefin slipping results in a lowering of symmetry, allowing orbitals to mix which could not mix in the most symmetrical complex geometry. With the new mixing in the deformed geometry, the C=C п* orbital is now lowered with respect to the free alkene, and hence, activated towards nucleophilic addition! (See Figure below, taken from Hoffman[11].) Also, addition of п-acceptor ligands like carbonyls have yet another favourable effect, lowering the energy of п* further in the η¹ complex. This explains why the introduction of п-acceptor ligands on the metal makes a coordinated alkene more nucleophilic. Of course, a more layman explanation of the higher reactivity of for example, [PtCl2(CO)(C2H4)] compared to [PtCl3(C2H4)] is that the CO п-acceptor decreases the overall electron density on the Pt centre (since it is such a good electron acceptor), reducing back-bonding to the alkene, thereby decreasing the electron density on the alkene, resulting in the alkene being even more nucleophilic.
Figure1 shows the energy levels in the η² complex, where the п* energy is raised, while Figure2 shows the energy levels in the η¹ complex, where the п* energy is lowered.
Natural Bond Orbital Analysis
| [PtCl3(C2H4)] | [PtCl2(CO)(C2H4)] | |
|---|---|---|
| Pt centre | 0.200 | 0.114 |
| C1 of alkene | -0.448 | -0.391 |
| C2 of alkene | -0.448 | -0.392 |
As can be observed from the pictorial representation of charge distribution, the carbon atoms on the CO substituted Pt complex have a less negative charge (-0.391) compared to the unsubstituted complex (-0.448). As such, the electron density on the carbon atoms on the alkene in [PtCl2(CO)(C2H4)] is lower, and hence, also shows that this complex is the more reactive complex.
Moreover, the charge distribution on the Pt centre also differs in the two complexes. The charge on the Pt centre is less positive on the [PtCl2(CO)(C2H4)] complex (0.114 compared to 0.200). This can be attributed to the increased back-bonding from the alkene to the metal.
Below shows the NBO analysis of [PtCl3(C2H4)].
                                                      Principal Delocalizations
           NBO                          Occupancy    Energy   (geminal,vicinal,remote)
 ====================================================================================
     6. BD (   1) C   5 - C   8          1.99690    -0.55900  20(r),65(r),66(r),64(r)
                                                    34(r),33(r),47(r),44(r)
                                                    32(r)
     7. BD (   2) C   5 - C   8          1.62246    -0.24467  20(r),65(r),33(r),32(r)
                                                    34(r),39(r),66(r),64(r)
                                                    43(r),51(r),44(r)
The occupancy in the 2nd bonding orbital between C5 and C8 (i.e. the alkene C=C) shows a lower occupancy than a free state alkene (which would ideally be 2.0). This indicates that there is a decreased electron density on the alkene, which corresponds to the σ-donation from alkene to metal.
Metallocycloalkanes: Study of R Group Substitution on Olefin (CH2=CHR)
Frequency Analysis
| [Pt(PCl3)2(C2H4)] | [Pt(PCl3)2(CH2=CHCN] | [Pt(PCl3)2(CH2=CHF)] | |
|---|---|---|---|
| DOI | DOI:10042/to-2645 | DOI:10042/to-2646 | DOI:10042/to-26427 |
| File type | .log | .log | .log |
| Calculation type | FREQ | FREQ | FREQ |
| Job cpu time | 13 min 54.0 sec | 18 min 24.5 sec | 14 min 59.0 sec |
| [Pt(PCl3)2(C2H4)] | Literature | [Pt(PCl3)2(CH2=CHCN)] | Literature | [Pt(PCl3)2(CH2=CHF)] | Literature | |
|---|---|---|---|---|---|---|
| C=C stretching frequencies / cm-1 | 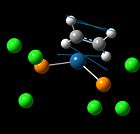 1245(m), 1541 1245(m), 1541 |
 1232(m), 1400, 1510 1232(m), 1400, 1510 |
 1242, 1373, 1497(m) 1242, 1373, 1497(m) |
|||
| C=C bond length / Å | 1.422 | 1.43[12] | 1.437 | 1.445[13] | 1.418 | 1.423[13] |
Nb: The bond lengths are reported to 3 decimal places here, so that the small differences in the values might be observed (even though it might not be significant).
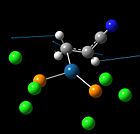
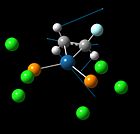
The C=C bond lengths calculated are all longer than the free olefin C=C bond lengths (1.523Å, 1.551Å, 1.511Å respectively). This is expected, since any back-bonding from the metal to C=C anti-bonding orbitals would result in a decreased bond order of the carbon-carbon bond. The C=C bond lengths show that the strength of the olefin bond is in the order CH2=CHF > C2H4 > CH2=CHCN. However, taking the accuracy of the calculations into account, there is probably no significant difference between the C=C bond lengths in C2H4 and CH2=CHCN.
Although the C=C stretching frequencies are not reported in literature, they would be useful for comparing the C=C bond strengths in the complexes, since there is a larger (and hence more observable) difference between the values, compared to difference in bond lengths. The computed C=C stretching frequency show a similar trend; in the order CH2=CHF > C2H4 > CH2=CHCN.
Both set of data suggest that compared to R=H, CN is a better п-acceptor (resulting in greater backbonding from metal to alkene), while F is a worse п-acceptor. This effect however does not appear to be very strong, as observed by the small differences in stretching frequencies.
An experimental value was available only for the ethene complex. The bond length computed agrees well with the experimental value. For the latter two complexes, the literature value above was obtained from a theoretical study. The computed values are in close agreement with the literature values. The difference observed is because different basis sets were used in the calculations (LANL2DZ here, while 6-31G(d) in literature).
The results show that the degree of σ-donation and п-backbonding is not very dependent on the R substituent. This can be explained in molecular orbital terms. The Pt-olefin bonding is mainly from Pt orbitals to the C-C п orbitals. In the substituted olefins, the R group interacts with the coordinated C=C unit in a bonding or anti-bonding way (F substituent interacts via a lone pair, while the CN substituent via a п bonded system). This results in a situation where the HOMO in the substituted olefin complexes is involved in donation and back-bonding to almost the same extent[13]. However, it can be concluded that the CN substituent is the strongest п-acceptor of the three R groups compared, meaning that the ratio of donation/backbonding is the lowest.
Vibrational Spectrum of [Pt(PCl3)2(CH2=CHCN)]
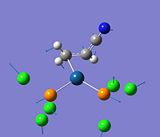
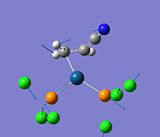
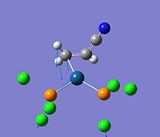
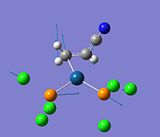
A more detailed analysis is done on the vibrational spectrum of the complex containing the CN substituted ethene. This shows the various vibrational modes possible for the complex. Not all the data is included since there are a total of 42 modes, but the key modes of vibrations are tabulated below.
The CN stretching frequency observed here is 2261cm-1. According to Nakamoto[10], the free [CN]- frequency is 2080cm-1. This shows that on coordination of the CN group to the alkene which is metal-coordinated, the strength of the C-N (triple) bond is increased. This could be due to the conjugated п system of the CN group with the C=C, which also involves some contribution from the Pt centre.
Conclusion
The use of Gaussian DFT calculations allowed for the theoretical analysis of various properties of the anion in Zeise's salt and its derivatives. The optimisation gave us fairly accurate structures of the various Pt complexes. Molecular orbital analysis allowed the reactivity of [PtCl3(C2H4)] to be rationalised. Also, the use of frequency analysis gave vibrational frequencies which can be compared to determine the degree of bonding/back-bonding within the Pt-C=C structure.
References
- ↑ www.gaussian.com
- ↑ S. Gierszal, J. Galica and E. Mis-Kuzminska, Physica Scripta. Vol. 67, 525–529, 2003
- ↑ G. Hogarth, T. Norman, Inorganica Chemica Acta 254 (1997) 167 - 171.
- ↑ F. A. Cotton, Inorg. Chem., 3, 5, 1964. DOI:10.1021/ic50015a024
- ↑ 5.0 5.1 H. Kato, Bulletin of the Chemical Society of Japan, 44, 348 - 354, 1971.
- ↑ G. J. Kubas, Journal of Organometallic Chemistry 635 (2001) 37–68. DOI:10.1016/S0022-328X(01)01066-X
- ↑ J. Hiraishi, Spectrochimi Acta, Vol 25A, pp. 749-760, 1969.
- ↑ 8.0 8.1 H. Alper and Y. Huang, Organometallics 1991,10, 1665-1671, DOI:[1]
- ↑ G. 13. Bokii and G. A. Kukina, Zhurnal Struktumoi Khimii, Vol. 6, No. 5, pp. 706.715, 1965.
- ↑ 10.0 10.1 K. Nakamoto, Infrared and Raman Spectra of Inorganic and Coordination Compounds, 4th Ed, 1986.
- ↑ 11.0 11.1 O. Eisenstein and R. Hoffmann, J. Am. Chem. Soc., 103, 4308-4320, 1981.
- ↑ A. Evans and C.T. Mortimer, J. Organomet.Chem., 72, 1974, 295-297.
- ↑ 13.0 13.1 13.2 G. Frison and H. Grutzmacher, J. Organomet.Chem., 643–644, (2002), 285–291

