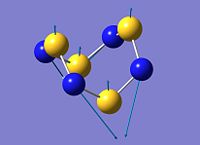
Rep:Mod2:wusiwin
Boron-Centered Small Molecules
In this exercise, Pople's Gaussian[1] density functional theory (DFT)[2] method is used to optimise the structures of molecules BH3 and BCl3. The basis set[3] used here 3-21G is a low level basis set[3] since the molecules are small and symmetrical. Subsequently, analysis of the properties of these compounds, such as molecular orbitals (MOs) and infrared spectroscopy, was conducted.
Borane BH3
Optimisation of BH3
The optimisation of BH3, from an arbitrary B-H bond length of 1.50 Å, is shown as follows:
| File Type | .log |
| Calculation Type | FOPT |
| Calculation Method | RB3LYP |
| Basis Set | 3-21G |
| Final Energy / a.u. | -26.4623 |
| RMS Gradient Norm / a.u. | 0.00020672 |
| Dipole Moment / Debye | 0.00 |
| Point Group | D3h |
| Job Time / s | 16.0 |
| Final B-H Bond Length / Å | 1.19 |
| Final B-H Bond Angle / o | 120.0 |
The optimised BH3 structure compares well to data from Schuurman et al[4]: bond length = 1.19 Å, bond angle = 120.0o, molecular geometry = trigonal planar, and point group = D3h.
Molecular Orbitals of BH3
Mulliken Population Analysis[5] of BH3 was conducted with Gaussian[1] to determine the molecular orbitals (MOs) of the molecule.
The log file of the BH3 Population Analysis[5] can be found at: https://www.ch.imperial.ac.uk/wiki/images/4/48/SHERMIN_BH3_POP.LOG
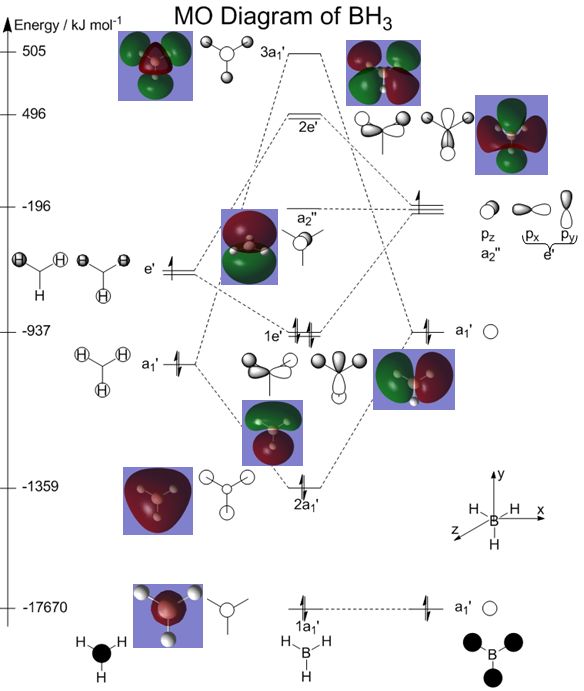
A qualitative MO diagram using linear combination of atomic orbitals (LCAO)[6] was also constructed, as shown on the right, with reference to this PDF from Dr Patricia Hunt's 2nd year lecture course on MO theory[6].
Pictures and energies of the MOs from the Population Analysis[5] have been added to the MO diagram so that results obtained from the two different methods can be compared.
The MOs produced by the linear combination of atomic orbitals (LCAO)[6] method match those generated by Population Analysis with Gaussian very well. Hence, qualitative MO theory[6] is viable for use in describing the shape of MOs, and in fact has the additional capability of being able to capture the contributions from the atomic orbitals, as well as mixing of molecular orbitals.
However, qualitative MO theory[6] is unable to predict the energies of the MOs accurately. For the case of BH3, computational calculations show that the energy of the 2e' orbital is lower than that of the 3a1' orbital, but only by 9 kJ mol-1. However, qualitative MO theory is incapable of determining which orbital is of higher energy since both arrangements, i.e. one where the 2e' orbital is lower in energy than 3a1' orbital, and the other where the 2e' orbital is higher in energy than 3a1' orbital, are possible when there is no quantitative information regarding the energies of the atomic orbitals or splitting energies.
Vibrational Frequencies of BH3
Frequency Analysis was conducted to determine that the optimised structure of BH3 is indeed the one of minimum potential energy. Another use of this computation is the prediction of molecular vibrational frequencies, which correspond to the infrared (IR) spectrum of the molecule.
The log file of the BH3 Frequency Analysis can be found at: https://www.ch.imperial.ac.uk/wiki/images/3/36/SHERMIN_BH3_FREQ.LOG
Molecular vibrations of BH3 at varying infrared frequencies are shown below:
| No. | Form of Vibration | Calculated Frequency / cm-1 | Intensity | Literature Frequency[4]/ cm-1 | Symmetry (D3h Point Group) |
|---|---|---|---|---|---|
| 1 | 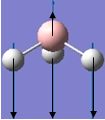 |
1144 | 93 | 1159 | A2" |
| 2 | 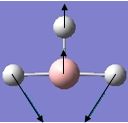 |
1204 | 12 | 1202 | E' |
| 3 | 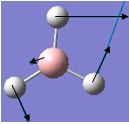 |
1204 | 12 | 1202 | E' |
| 4 | 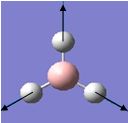 |
2598 | 0 | - | A1' |
| 5 |  |
2737 | 2506 | 104 | E' |
| 6 | 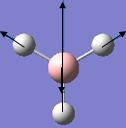 |
2737 | 104 | 2616 | E' |
Note: The length of the vibrational arrows indicate the relative direction and amplitude of molecular vibrations at a single point of time, vibrations in the opposite direction also occur.
Comparing the calculated vibrational frequencies to literature IR data, the most apparent difference is that there are only 5 IR peaks reported in experimental data[4], compared to the 6 vibrational modes observed in the computation.
On closer inspection, the IR peak which is "missing" is that of the symmetric stretch, which has an intensity of 0. This is because the IR spectrum measures changes in dipole moments as a result of vibration. As BH3 has D3h symmetry, there is no change in dipole moment observed from the symmetric stretching of all the B-H bonds, and hence that vibrational mode is non- IR active[7].
Further analysis indicates that the computed values are a close match for the lower IR frequencies, corresponding to wagging and rocking, but are a poor prediction of the higher frequency IR stretches, possibly due to anharmonicity which is not taken into account by Gaussian[1].
Boron Trichloride BCl3
Optimisation of BCl3
The optimisation of BCl3, with its point group restricted to D3h, is shown below:
| File Type | .log |
| Calculation Type | FOPT |
| Calculation Method | RB3LYP |
| Basis Set | LANL2MB |
| Final Energy / a.u. | -69.4393 a.u. |
| RMS Gradient Norm / a.u. | 0.00005905 |
| Dipole Moment / Debye | 0.00 |
| Point Group | D3h |
| Job Time / s | 13.0 |
| B-H Bond Length / Å | 1.87 |
| B-H Bond Angle / o | 120.0 |
When the computation was repeated without restraint, Gaussian[1] still produced the molecule with the same point group, indicating that the programme recognises BCl3 to have D3h symmetry as expected for its trigonal planar geometry.
The optimised BCl3 structure compares well to data from Baeck et al[8] for the bond angle = 120.0o, molecular geometry = trigonal planar, and point group = D3h.
However, the experimental bond length of 1.751 Å is significantly different from the computed bond length (1.87 Å). In fact, this computed bond length corresponds to that of BCl3- at 1.88 Å. This can be attributed to the LANL2MB basis set used to run the optimisation, which is more suitable for elements with atomic number larger than Zn, which have filled 3d orbitals.
More on Chemical Bonds
Loss of Bonds in GaussView 5.0
In the process of optimisation, Gaussview 5.0 at times omits the B-H bonds. This is not because bonds between the atoms do not exist, but rather due to programming restraints. Gaussview has a database of bond lengths which indicate to the program when bonds should be drawn. When the calculated distance between atoms exceeds the specified bond lengths in the database, Gaussview does not recognise them, and hence does not draw in the bonds. This occurs especially for inorganic compounds, since the bond lengths in the database are mainly based on organic compounds.
Definition of a Chemical Bond
A chemical bond is a force of attraction between two or more atoms which confers stability to the di- or poly- atomic species[9]. Strong bonds can result from electromagnetic interaction between positively charged nuclei and negatively charged shared electrons in a covalent bond to form a molecule[10]; electrostatic interaction between a positive cation and a negative anion in an ionic bond[10] or ion-dipole bond[11]; or electrostatic interaction between cations and electrons in a metallic bond. Weak bonds can result from electrostatic attraction between dipoles such as hydrogen bonding and some dipole-dipole interactions.
Vibrational Frequencies of BCl3
Frequency Analysis was conducted for the optimised structure of BCl3, with the log file found at: https://www.ch.ic.ac.uk/wiki/index.php/Image:SHERMIN_BCL3_FREQ.LOG
Molecular vibrations of BCl3 at varying infrared frequencies are shown below:
| No. | Form of Vibration | Calculated Frequency / cm-1 | Intensity | Literature Frequency[8]/ cm-1 | Symmetry (D3h Point Group) |
|---|---|---|---|---|---|
| 1 | 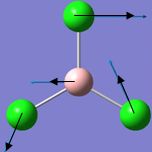 |
214 | 4 | 243 | E' |
| 2 | 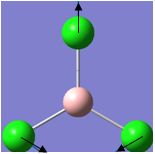 |
214 | 4 | 243 | E' |
| 3 | 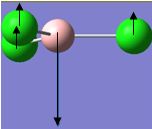 |
377 | 44 | 462 | A2" |
| 4 | 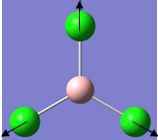 |
417 | 0 | 471 | A1' |
| 5 | 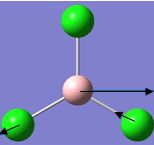 |
939 | 259 | 958 | E' |
| 6 | 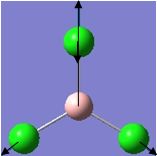 |
939 | 259 | 958 | E' |
Note: The length of the vibrational arrows indicate the relative direction and amplitude of molecular vibrations at a single point of time, vibrations in the opposite direction also occur.
The calculated vibrational frequencies generally agree well with literature IR data[8], with some differences due to anharmonicity which is not taken into account by Gaussian[1].
More on Frequency Analysis
Importance of Frequency Analysis
The purpose of optimisation is to find the ground state conformation of the molecule, which is the conformation of lowest energy.
During optimisation, the parameters of the molecule are continuously adjusted until the first derivative of potential energy is zero. However, this point may either be a maximum, which represents a transition state, or a minimum, indicating the ground state.
Frequency analysis calculates the second derivative of potential energy. When all the vibrational frequencies of the molecule are positive, this indicates that the potential energy is at a minimum, and hence the optimised structure is the ground state of the molecule. If one of the frequencies is negative, the potential energy is at a maximum, and a transition state is found. If more than one frequency is negative, then the optimisation has failed to find a turning point. Hence, frequency analysis is necessary to determine that the optimised structure is indeed the ground state structure of the molecule.
Another use of this computation is the prediction of molecular vibrational frequencies, which correspond to the infrared spectrum of the molecule.
Restraints on Frequency Analysis
One restraint of frequency analysis is that the calculation must be repeated with the same method and basis set as that utilised in optimisation. This is because the frequency analysis must be computed in the same manner as optimisation for it to be an accurate representation of the second derivative of potential energy. The use of a different method would render the frequency analysis incompatible with the optimisation, and is thus not useful to the computation.
Isomerism in Mo(CO)4(PCl3)2
In this exercise, Pople's Gaussian[1] density functional theory (DFT)[2] method is used to optimise the structures of cis- and trans- Mo(CO)4(PCl3)2. The basis set[3] of LANL2DZ is used here mainly because it is a high accuracy pseudo-potential with tight convergence, and also since elements with larger atomic number than Zn cannot be recognised by the 6-311G basis set. Subsequent comparison of the energies and infrared spectra of the isomers weas conducted.
Energies of Isomers
Mo(CO)4(PCl3)2 Isomers
The results from the optimisation of Mo(CO)4(PCl3)2 isomers are shown below:
| Property | cis-Mo(CO)4(PCl3)2 | Trans-Mo(CO)4(PCl3)2 | ||||||
|---|---|---|---|---|---|---|---|---|
| File Type | .log | .log | ||||||
| Calculation Type | FOPT | FOPT | ||||||
| Calculation Method | RB3LYP | RB3LYP | ||||||
| Basis Set | LANL2DZ | LANL2DZ | ||||||
| Final Energy / a.u. | -623.5771 | -623.5760 | ||||||
| Final Energy / kJ mol-1 | -1637202 | -1637199 | ||||||
| RMS Gradient Norm / a.u. | 0.00000772 | 0.00002444 | ||||||
| Dipole Moment / Debye | 1.31 | 0.3041 | ||||||
| Point Group | C1 | C1 | ||||||
| Job Time | 1 h 22 min 42.1 s | 49 min 43.6 s | ||||||
| Molecule |
|
|
The cis-isomer is lower energy than the trans-isomer by a very small difference of 3 kJ mol-1, and in practice both isomers can be isolated.
This can be attributed to an impasse between electronic and steric factors. Electronically, trans effect[12] in the metal complex favours the cis-isomer. As CO ligands are strong π-acceptors and have a very strong trans effect and , the preferred orientation of the ligands is such that there are less CO ligands opposite each other. This is achieved in the cis-isomer where there is only 1 pair of CO ligands which are trans to each other, while in the trans-complex there are 2 pairs of CO ligands which are trans to each other.
Cis-Trans Isomerism in Other Mo(CO)4(PR3)2 Complexes
For bulkier R groups on ligand PR3, such as R = Ph or nBu, the trans-Mo(CO)4(PR3)2 isomer becomes the more stable isomer due to sterics[13].
The results from the optimisation of Mo(CO)4(PPh3)2 isomers are shown below:
| Property | cis-Mo(CO)4(PPh3)2 | Trans-Mo(CO)4(PPh3)2 | ||||||
|---|---|---|---|---|---|---|---|---|
| File Type | .log | .log | ||||||
| Calculation Type | FOPT | FOPT | ||||||
| Calculation Method | RB3LYP | RB3LYP | ||||||
| Basis Set | LANL2DZ | LANL2DZ | ||||||
| Final Energy / a.u. | -1923.5444 | -1923.5403 | ||||||
| Final Energy / kJ mol-1 | -5050266 | -5050255 | ||||||
| RMS Gradient Norm / a.u. | 0.00000891 | 0.00000298 | ||||||
| Dipole Moment / Debye | 8.57 | 0.01 | ||||||
| Point Group | C1 | C1 | ||||||
| Job Time | 3 days 8 h 38 min 15.6 s | 18 h 39 min 10.7 s< | ||||||
| Molecule |
|
|
Oddly, the optimisation of the cis- and trans- isomers of Mo(CO)4(PPh3)2 using the LANL2DZ method again showed that the cis-isomer is the more stable by 11 kJ mol-1. However, this is a small energy difference and in practice both isomers are observed at room temperature, and in fact the trans- isomer is the more stable of the two experimentally.
The energy calculation is in contrast with experimental evidence that isomerisation from the cis- to the trans- isomer for R = Ph occurs when the cis- isomer is refluxed in dry toluene[14]. Isomerisation occurs via the initial cleavage of the Mo-P bond and dissociation of PPh3, since the phosphine size and cone angle are large[13].
A reason for this apparent discrepancy is that Gaussian[1] runs the optimisation in gas phase for these complexes, while the isomerisation reactions occurs in solution.
Vibrational Frequencies of Mo(CO)4(PCl3)2 Isomers
Low-Frequency Vibrations of Mo(CO)4(PCl3)2 Isomers
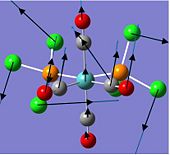
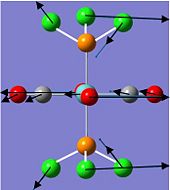
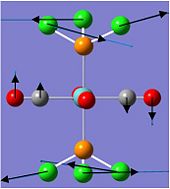
The low frequency vibrations of both Mo(CO)4(PCl3)2 isomers are recorded in the table below:
The low frequency vibrations in both cis- and trans- isomers belong to the rocking vibrational mode in which the entire molecule behaves like a continuous elastic body[15]. Since energy is directly proportional to frequency, these vibrations require little energy to occur. In fact, the complex receives sufficient energy at room temperature for the ground state vibrational levels to be significantly depopulated[16], and thus the complex undergoes the rocking motion even at room temperature.
In addition, these low vibrational frequencies show anharmonicity and contribute significantly to the entropy of the system[15], resulting in temperature-dependence of the vibrational frequencies[16].
Carbonyl Stretching Frequencies of Mo(CO)4(PCl3)2 Isomers
Carbonyl stretching frequencies are computed for both cis- and trans- isomers of Mo(CO)4(PCl3)2. As PCl3 is a π-acceptor ligand[17] , the position of the PCl3 groups relative to the CO ligands will strongly affect the CO bond strength and hence their stretching frequencies. In addition, the number of peaks in the IR spectrum is also determined by the position of the PCl3 ligands since this alters the symmetry of the molecule. The calculated and literature[18] carbonyl stretching frequencies are shown in the tables below
| Calculated Frequency / cm-1 | Calculated Intensity | Experimental Frequency[18] / cm-1 | Point Group (C2v Symmetry)[18] |
|---|---|---|---|
| 1945 | 763 | 1986 | B2 |
| 1949 | 1948 | 1994 | B1 |
| 1958 | 633 | 2004 | A1 |
| 2023 | 598 | 2072 | A1 |
Comparing the computed frequencies with literature IR data[18], the same number of vibrational modes are observed. For the cis-isomer, there is no symmetric CO stretch in the molecule since the CO groups are not symmetrically arranged about the Mo centre, and thus all CO stretches are IR active.
However, the computed frequencies are a relatively poor match to experimental IR data[18], which can be explained by the fact that Gaussian[1] does not treat the π-backbonding onto the CO ligand well, and also there is a lack of anharmonicity terms in the vibrations calculated by Gaussian[1].
| Calculated Frequency / cm-1 | Calculated Intensity | Experimental Frequency[18] / cm-1 | Point Group (D4h Symmetry)[18] |
|---|---|---|---|
| 1950 | 1475 | 1896 | Eu |
| 1951 | 1467 | 1896 | Eu |
| 1977 | 1 | - | B1g |
| 2031 | 4 | - | A1g |
The computed frequencies show 2 more CO stretchesthan reported by experimental IR data[18]. On closer inspection, the CO stretches at 1977 and 2031 cm-1 have very small intensities, and hence cannot be observed in the IR spectra. This can be attributed to symmetric CO stretches in the trans-isomer, resulting in no change in net dipole moment, and thus non- IR active vibrational modes[7].
However, the computed frequencies are a relatively poor match to experimental IR data[18], which can be explained by the fact that Gaussian[1] does not treat the π-backbonding onto the CO ligand well, and also there is a lack of anharmonicity terms in the vibrations calculated by Gaussian[1].
Mini-Project
This mini-project is on tetrasulphur tetranitride S4N4. S4N4 has an unusual structure and bonding, which was only determined by Sharma et al[19] using X-ray crystallography in 1962.
The aim of this project is to determine the most stable conformation of S4N4, followed by an investigation into its reacitivity with Lewis acids and organic molecules. Energies, molecular orbitals, infrared spectra and charge distribution of the molecules are computed to discuss the structure and reactivity of these molecules.
The molecules were optimised using Pople's Gaussian[1] density functional theory (DFT)[2] method with high accuracy basis sets[3] and pseudo-potentials, such as 6-311G(d,p) for molecules only with elements with atomic number less than Zn, and LANL2DZ for molecules containing elements with atomic number greater than Zn. Gaussian[1] was programmed to run both optimisation and frequency calculations on the molecules simultaneously to determine if the "optimised" structure is indeed the ground state structure. In addition, Mulliken Population Analysis[5] and natural bond order (NBO)[20] analysis were also conducted.
Structure of Tetrasulphur Tetranitride S4N4
Before the advent of diffracton and X-ray crystallography, many structures of tetrasulphur tetranitride S4N4 were proposed. In 1962, Sharma et al[19] used X-ray crystallography to determine the crystal structure as a D2d "cradle" which matches other experimental data obtained for S4N4.
Energies of S4N4 Conformers
This section aims to calculate the energies of some S4N4 conformers to verify that the D2d "cradle" is indeed the one of lowest energy. The 3 conformers of S4N4 chosen are the D2d-S4N4 which has a "cradle" form, the cyclooctane-S4N4 which has a cyclooctane-like structure, and the D4h-S4N4 which is square planar.
Upon optimisation, both the D2d-S4N4 and the cyclooctane-S4N4 retained their conformation, while the D4h-S4N4 was lowered in symmetry to the D2h structure due to the inability to find a minimum point with the D4h structure. The results of optimisation are shown in the table below.
| Property | D2d-S4N4 | cyclooctane-S4N4 | D2h-S4N4 | |||||||||
|---|---|---|---|---|---|---|---|---|---|---|---|---|
| File Type | .log | .log | .log | |||||||||
| Calculation Type | FREQ | FREQ | FREQ | |||||||||
| Calculation Method | RB3LYP | RB3LYP | RB3LYP | |||||||||
| Basis Set | 6-311G(d,p) | 6-311G(d,p) | 6-311G(d,p) | |||||||||
| Final Energy / a.u. | -1811.7148 | -1811.7042 | -1811.6309 | |||||||||
| Final Energy / kJ mol-1 | -4756657 | -4756629 | -4756437 | |||||||||
| RMS Gradient Norm / a.u. | 0.00005966 | 0.00001053 | 0.00000655 | |||||||||
| Imaginary Freq | 0 | 0 | 3 | |||||||||
| Dipole Moment / Debye | 0.0023 | 0.0118 | 0.0000 | |||||||||
| Point Group | C1 | C1 | D2h | |||||||||
| Job Time | 6 min 32.6 s | 6 min 31.1 s | 2 min 39.4 s | |||||||||
| Molecule |
|
|
|
The optimised structure for the D2h-S4N4 has 3 imaginary frequencies, and hence is not a stable conformer as it does not represent a minimum point on the potential energy surface. Comparing the other two conformers, it is evident that the D2d-S4N4 is the most stable structure since it has the lowest energy.
Structure of D2d-S4N4
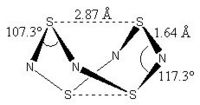
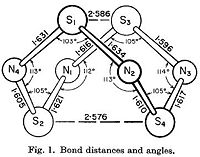
To verify that the computed D2d-S4N4 conformer is indeed the same as that elucidated by Sharma et al[19], a comparison of the computed and X-ray crystal structure[19] is made.
In both structures, the S-N bond length is significantly shorter than a single S-N bond length, and along with the similarity of length for all S-N bonds, indicates delocalisation in the S4N4 structure[19]. Also, the intramolecular S-S distance is longer than a S-S single bond, but shorter than the van der waals' distance between two S atoms, indicating the presence of transannular interaction between the S atoms[19].
| Gaussian[1] Optimised Structure | X-ray Crystal Structure[19] |
|---|---|
|
|
In the Gaussian[1] optimised structure, all S-N bond lengths are 1.64 Å, while both S-S bond lengths are 2.87 Å. Also, N-S-N bond angles alternate between 107.3° and 117.3° as shown in the diagram above. This is a relatively close approximation to the X-ray structure elucidated by Sharma et al[19], in which the S-N bond lengths are between 1.60 Å and 1.63 Å,, and the N-S-N bond angles alternate between 105° and 113°. However, the S-S bond lengths in the crystal structure are shorter at 2.58 Å and 2.59 Å.
One major difference between the computed structure and the X-ray crystal structure[19] is experimental data indicates that all the bonds in S4N4 have different bond lengths and angles, while the calculated structure has the same bond lengths and bond angles for similar bonds because the RB3LYP method produces data for resonance forms of molecules, in which all bonds are the same. The other difference is that the S-S bond lengths is much shorter in the structure elucidated by Sharma et al[19], which can be attributed to a slight difference in molecular structure in the solid phase, as measured by X-ray crystallography, and the gas phase, as computed by Gaussian[1].
Molecular Orbitals of S4N4
Reactive Orbitals of S4N4
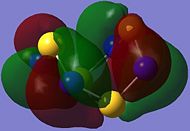
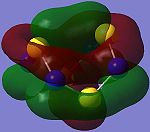
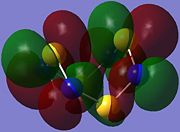
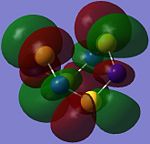
As orbitals with energies close to HOMO (highest occupied MO) and LUMO (lowest unoccupied MO) control molecular reactivity, an analysis of these orbitals is undertaken here.
| HOMO-2 (Orbital 44) | HOMO-1 (Orbital 45) | HOMO (Orbital 46) | LUMO (Orbital 47) | LUMO+1 (Orbital 48) | LUMO+2 (Orbital 49) |
|---|---|---|---|---|---|

|
|
|
|

|
|
HOMO consists of π-type overlaps of p-type atomic orbitals (AOs), with higher electron density surrounding the N atoms in the square plane compared to the tetrahedrally arranged S atoms, indicating greater reactivity towards electrophiles at the N centres.
LUMO consists of σ*-type antibonding overlaps of p-type AOs, and the larger orbital coefficients on the S AOs indicate that attack on the LUMO should occur there[21].
Orbital Overlap and Delocalisation in S4N4
As discussed above, S4N4 has a delocalised structure. In MO theory, this requires that S4N4 has a delocalised system built from π-type overlap of p-type AOs to form π-type MOs[22].
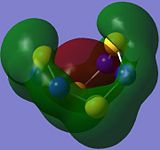
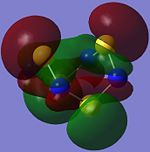
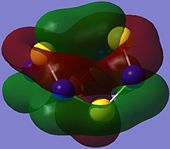
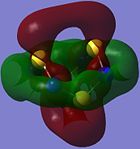
The following orbitals show the π-type MOs in which overlap across the S4N4 molecule, indicating the possibility for electron delocalisation in the molecule.
| Orbital 34 | Orbital 35 | Orbital 42 | Orbital 44 | Orbital 46 | Orbital 50 |
|---|---|---|---|---|---|

|
|
|

|
|
|
Orbitals 34 to 46 represent π bonding orbitals and are occupied, while orbital 50 is an empty п* anti-bonding orbital.
The overlap of the individual p-type AOs results in the formation of a п-type MO which has one phase on the top face on the molecule, and the opposite phase on the bottom as observed in orbital 34. This looks similar to the orbitals contributing to the aromaticity of benzene but that is not to say that S4N4 is aromatic.
Other п-type MOs shown above also overlap across the entire molecule, and the presence of these filled orbitals enables the build-up of electron density in the system, and thus delocalisation of electrons can occur. This is supported by Whitehead et al[23] who showed that electron delocalisation occurs by http://en.wikipedia.org/wiki/Delocalisation delocalisation] of the p-electrons in a N lone pair to the p-orbitals on the S atoms to which the N is bonded.
Delocalisation gives rise to the similar bond S-N bond lengths throughout the molecule[19] and diamagnetic ring current in the ring[23].
Also, as observed in orbitals 34, 44 and 46, there is orbital overlap between the S atoms at the top of the cradle, and also between the S atoms at the bottom of the cradle. This accounts for the transannular S-S interaction, which make the intramolecular S-S distance shorter than the van der waals' distance between two S atoms[19].
IR Spectrum of S4N4
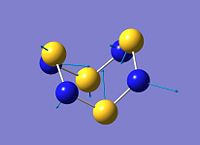
Frequency analysis of S4N4 was conducted for comparison with literature and with adducts modelled later. Non-zero intensity vibrational frequences of S4N4 are reported below.
| No. | Calculated Frequency / cm-1 | Intensity | Vibrational Animation |
|---|---|---|---|
| 4,5 | 293 | 34 | doubly degenerate wag |
| 7,8 | 503 [lit.[24] 526 s, 514] | 10 | doubly degenerate wag |
| 9 | 555 [lit.[24] 548] | 87 | scissor |
| 11,12 | 660 [lit.[24] 620, 698 s] | 109 | doubly degenerate twist |
| 16,17 | 710 [lit.[24] 727 s, 765] | 5 | doubly degenerate stretch |
| 18 | 952 [lit.[24] 926 s] | 67 | stretch |
The peaks observed are concur very well with those recorded in literature IR by Irsen et al[24] both experimentally and computationally.
Charge Distribution of S4N4
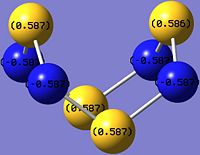
The charge distribution of S4N4 determines its reactive sites, especially in reactions with Lewis acids which will be discussed later.
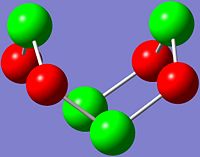
 |
|
As shown in the images above, the N atom has negative charge density (-0.587), making it more nucleophilic and thus susceptible to electrophilic attack. In contrast, the S atom has positive charge density (+0.587), and hence is more electrophilic and vulnerable to nucleophilic attack.
This is expected since N is slightly more electronegative than S, and thus more electrons are drawn towards the N atom, which results in higher electron and negative charge density at the N atoms as compared to the S atoms in S4N4.
Thus, in reactions with Lewis acids, which are electron pair acceptors, coordination will occur at the more nucleophilic N atoms.
Lewis Acid Adducts to S4N4
S4N4 forms many adducts with various Lewis acids, including BF3.S4N4[25], SbCl5.S4N4[26] and TeCl4.S4N4[27]. In these adducts, the electropositive central atom of the Lewis acid coordinates to an electronegative N atom of S4N4, causing the transannular S-S bonds to be broken, and the molecule to attain an open, monocyclic ring in a boat conformation[27].
In this section, the structure of TeCl4.S4N4 is studied, and comparisons with the structure of S4N4 are drawn.
Conformers of TeCl4.S4N4
As with S4N4, energies of TeCl4.S4N4 conformers are compared to determine the most thermodynamically favourable conformation of the molecule.
The two conformers compared here are boat-TeCl4.S4N4, in which the transannular S-S bonds in S4N4 are broken and S4N4 has an open, monocyclic boat conformation; and cradle-TeCl4.S4N4, in which S4N4 maintains its cradle conformation.
| Property | Boat-TeCl4.S4N4 | Cradle-TeCl4.S4N4 | ||||||
|---|---|---|---|---|---|---|---|---|
| File Type | .log | .log | ||||||
| Calculation Type | FOPT | FOPT | ||||||
| Calculation Method | RB3LYP | RB3LYP | ||||||
| Basis Set | LANL2DZ | LANL2DZ | ||||||
| Final Energy / a.u. | -326.9308 | -326.8887 | ||||||
| Final Energy / kJ mol-1 | -858357 | -858246 | ||||||
| RMS Gradient Norm / a.u. | 0.00005001 | 0.00003277 | ||||||
| Imaginary Freq | 0 | 0 | ||||||
| Dipole Moment / Debye | 6.96 | 6.53 | ||||||
| Point Group | C1 | C1 | ||||||
| Job Time | 3 min 51.3 s | 3 min 44.4 s | ||||||
| Molecule |
|
|
The energy of the boat-TeCl4.S4N4 is 111 kJ mol-1 lower than the cradle-TeCl4.S4N4, and hence boat-TeCl4.S4N4 is the more stable conformer of the adduct.
Structure of Boat-TeCl4.S4N4
Comparison with Literature
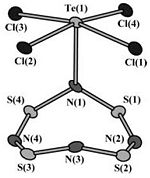
To verify that the computed Boat-TeCl4.S4N4 conformer is indeed the same as that elucidated by Konu et al[27], a comparison of the computed and X-ray crystal structure[27], shown on the right, is made.
In both structures, the Te-N bond length is 2.16 Å, which is significantly longer than the Te-N single bond length[27], highlighting the dative covalent coordination between the two atoms.
However, the correlation between computed and experimental data is less in the S4N4 ring. While, bond angles calculated by Gaussian[1] are similar to those observed by Konu et al[27]; there is some deviation in the bond lengths observed..Gaussian[1] reports the S-N bond lengths between 1.67 and 1.79 Å, while those observed in X-ray crystal structure[27] are shorter at 1.55 to 1.67 Å, though Gaussian[1] does predict the relative lengths of the bonds in the correct order: N(1)-S(1) and N(1)-S(4) are the longest, and N(2)-S(2) and N(4)-S(3) are the shortest.
The different bond lengths measured can be attributed to varying structures of the molecule in different phases - gas phase for Gaussian[1] calculation, and solid phase for X-ray crystallography[27].
Comparison with S4N4
The structure of the S4N4 ring in TeCl4.S4N4 is drastically different from that of S4N4. The D2d-cradle conformation opens to form a monocyclic ring in boat conformation[27], with the transannular S-S bonds broken.
In addition, the S-N bond length increased from 1.64 Å in S4N4 to 1.67-1.79 Å in TeCl4.S4N4, indicating a decrease in bond strength, supported by infrared spectroscopy below.
Molecular Orbitals of TeCl4.S4N4
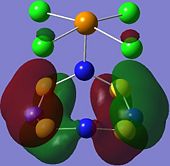
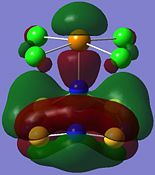
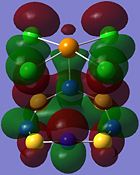
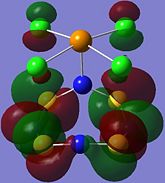
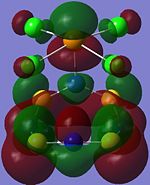
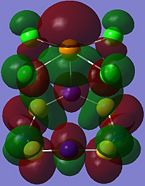
As highlighted by Konu et al[27], the monocyclic S4N4 ring in TeCl4.S4N4 also has a delocalised structure. These orbitals show the π-type MOs in the molecule.
| Orbital 23 | Orbital 28 | Orbital 41 (HOMO-2) | Orbital 44 (LUMO) | Orbital 45 (LUMO+1) | Orbital 46 (LUMO+2) |
|---|---|---|---|---|---|
|
|
|
|
|
|
From orbitals 23, 28 and 44, it can be seen that the overlap of orbitals does not include the N atom which is bonded to Te. This observation could explain the especially long S-N bond length for bonds N(1)-S(1) and N(1)-S(4) observed in the structure as compared to the other S-N bond lengths in the ring.
IR of TeCl4.S4N4
Comparison with Literature
Frequency analysis of TeCl4.S4N4 was conducted for comparison with literature. Non-zero intensity vibrational frequences of TeCl4.S4N4 are reported below.
| No. | Calculated Frequency / cm-1 | Intensity | Comments |
|---|---|---|---|
| 10 | 139 | 68 | - |
| 13 | 179 | 35 | - |
| 18 | 261 [lit.[28] 225 (w)] | 18 | Te-Cl stretch |
| 20 | 276 [lit.[28] 251 s(br)] | 57 | Te-Cl stretch |
| 21 | 305 | 72 | - |
| 22 | 309 | 21 | - |
| 23 | 377 [lit.[28] 360 vs(br)] | 46 | Te-N stretch |
| 26 | 480 [lit.[28] 500 s(br)] | 13 | S-N stretch |
| 28 | 563 [lit.[28] 549 w, 563 w] | 4 | S-N stretch |
| 29 | 659 [lit.[28] 636 m, 671 m] | 24 | S-N stretch |
| 30 | 700 [lit.[28] 727 w] | 1 | S-N stretch |
| 31 | 820 [lit.[28] 807 s] | 98 | S-N stretch |
The peaks observed are generally in agreement with those recorded in literature IR by Banister et al[28]. Most of the characteristic absorptions of Lewis acid-S4N4 adducts: 1030-1075 cm-1, 920-1000 cm-1, 743-845 cm-1, 720-730 cm-1, 670-685 cm-1, 610-640 cm-1, 550-570 cm-1, 500-525 cm-1 and 350-370 cm-1 can be found here.
Other peaks observed experimentally[28] are: 1156 vw, 1048 v, 996, vs, 760 vs. These peaks could not be observed in the vibrational frequencies computed by Gaussian[1] mainly because frequenceis above 900 cm-1 are not reported.
Comparison with S4N4
From the IR vibrations computed, the S-N stretching frequencies in TeCl4.S4N4 range from 377 to 820 cm-1, while those for S4N4 are between 681 and 952 cm-1. Since bond energy is directly proportional to the stretching frequency, this indicates that the S-N bonds in S4N4 are generally stronger than those in TeCl4.S4N4.
This is supported by the increase in S-N bond length from 1.64 Å in S4N4 to 1.67-1.79 Å in TeCl4.S4N4, since bond strength is inversely proportional to bond length.
Charge Distribution of TeCl4.S4N4
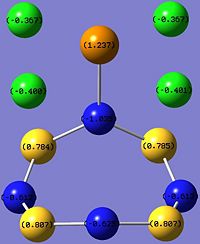
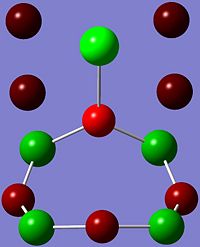
The charge distribution of TeCl4.S4N4 indicates bond polarity and reactivity in the molecule, and also explains the net dipole moment of 6.96 Debye.
 |
|
The Lewis acid TeCl4 is coordinated to the Lewis base S4N4 via the most electropositive Te atom, with the greatest positive charge density (+1.237), to an electronegative N atom. The coordination results in the N atom bonded to the Te atom to have a more negative charge density (-1.035) as compared to the other N atoms in the S4N4 ring. Charge density elsewhere ranges from -0.612 at the N atoms nearest to coordination site, to -0.625 at the furthest N atom, since the build-up of negative charge density repels electrons. Also, the positive charge density of the S atoms nearer to the coordination site (+0.785) are lower than those further from the Te atom (+0.807), due to high positive charge density on the Te atom repelling "positive charge".
Another interesting point to note is that the Cl atoms above the S4N4 ring have higher negative charge density (-0.401) compared to those pointing away from the ring (-0.367), which can be explained by the accumulation of positive charge density about the S4N4 ring. This is supported by addition of the charge distribution around the entire S4N4 ring to get a net +0.298 for the ring.
The charge distribution of TeCl4.S4N4 is also useful for studying the effect of coordination on S4N4. A polarisation effect of TeCl4 coordination is the accumulation of positive charge density (+0.298) in the S4N4 ring, which was neutral overall in uncoordinated S4N4. In addition, the distribution of charge is no longer uniform, unlike uncoordinated S4N4.
Reactions with Norbornadiene
The reaction of S4N4 with strained olefins have been analysed by several groups such as Allen et al[29] and Griffin et al[30]. The reactions were classified as cycloadditions, but the various groups proposed different structures for the products, with different regions of attack on the S4N4 unit.
In particular, the reaction between S4N4 and 2 equivalents of norbornadiene to form tetrasulphur tetranitride-(bis)norbornadiene has been studied separately by Allen et al[29] and Griffin et al[30] to give different structures, as shown below.
Using nuclear magnetic resonance spectroscopy (NMR), IR and mass spectroscopy (MS) of the product, Allen et al[29] proposed cycloaddition across the N-S-N unit, resulting in C-N bond formation in 1972. Later, Griffin et al[30] used X-ray crystallography on the adduct to determine the exact structure of tetrasulphur tetranitride-(bis)norbornadiene, which indicates cycloaddition across the S-N-S unit with C-S formation in 1975.
This section aims to investigate the reaction between S4N4 and norbornadiene, through a comparison of the tetrasulphur tetranitride-(bis)norbornadiene structures proposed by Allen et al[29] and Griffin et al[30].
Energies of Isomers
Optimisation of the S4N4.(C7H8)2 isomers proposed by Griffin et al[30], henceforth termed Griffin-isomer, and Allen et al[30], henceforth termed Allen-isomer, were undertaken to determine their lowest energy conformation.
| Property | Griffin-isomer | Allen-isomer | ||||||
|---|---|---|---|---|---|---|---|---|
| File Type | .log | .log | ||||||
| Calculation Type | FOPT | FOPT | ||||||
| Calculation Method | RB3LYP | RB3LYP | ||||||
| Basis Set | 6-311G(d,p) | 6-311G(d,p) | ||||||
| Final Energy / a.u. | -2354.8386 | -2354.9553 | ||||||
| Final Energy / kJ mol-1 | -6182629 | -6182935 | ||||||
| RMS Gradient Norm / a.u. | 0.00002795 | 0.00002572 | ||||||
| Imaginary Freq | 0 | 0 | ||||||
| Dipole Moment / Debye | 0.00 | 4.27 | ||||||
| Point Group | C1 | C1 | ||||||
| Job Time | 6 h 33 min 46.2 s | 7 h 22 min 3.0 s | ||||||
| Molecule |
|
|
The optimisation shows that Allen-isomer is energetically more stable than Griffin-isomer by 306 kJ mol-1. This is in contrast with the X-ray crystal structure elucidated by Griffin et al[30], and indicates that should the Allen-isomer be formed in the reaction, it would be the dominant isomer.
Hence, the rationale for the formation of the Griffin- rather than the Allen- isomer lies in the the reactivity of S4N4 and norbornadiene, and the mode of the cycloaddition reaction, which will be discussed below. My suggestion is that the Griffin-isomer is the kinetic product of the reaction, and the Allen-isomer is the expected thermodynamic product, but forms so slowly that it is not observed at all.
Structure of Griffin-S4N4.(C7H8)2
Comparison with Literature
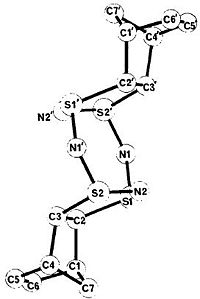
To verify that the computed Griffin-S4N4.(C7H8)2 isomer is indeed the same as that elucidated by Griffin et al[30], a comparison of the computed and X-ray crystal structure[30], shown on the right, is made.
For the S4N4 ring, the S-N bond lengths calculated by Gaussian[1] are all about 1.66 Å, while those measured by Griffin et al[30] range from 1.59 to 1.65 Å. The S-C bonds in Gaussian[1], at 1.90 Å, are also longer than those measured experimentally[30], from 1.83 to 1.85 Å.
The length of the C-C bond where addition occured, C2-C3 and C2'-C3', is 1.53 Å in Gaussian[1], similar to that measured by Griffin et al[30]. The bond lengths of all other C-C bonds in the molecule are also similar to those in the X-ray crystal structure, except for the C=C bond,C5-C6 and C5'-C6', which is shorter in Gaussian[1], at 1.34 Å, compared to the X-ray crystallography measured 1.27 Å.
The different bond lengths measured can be attributed to varying structures of the molecule in different phases - gas phase for Gaussian[1] calculation, and solid phase for X-ray crystallography[30]. Also, the B3LYP calculates resonance sructures for the molecule, and hence all similar bond lengths are the same, while in the X-ray crystal structure[30] they are not.
Comparison with S4N4
The structure of the S4N4 ring in S4N4.(C7H8)2 is drastically different from that of S4N4. The D2d-cradle conformation transforms into a more open ring with 6 atoms almost lying in a plane, and two N atoms opposite to each other, pointing out of the plane in opposite directions. As with TeCl4.S4N4, the transannular S-S bonds broken.
While the S-N bond length changed only slightly from 1.64 Å in S4N4 to 1.66 Å in S4N4.(C7H8)2, indicating some multiple-bond character, the bond angles are larger at 117.4° for the non-planar S-N-S bond and 128.2° for the planar S-N-S bond respectively as compared to the 107.3° and 117.3° in S4N4.
Charge Distribution Analysis
Charge distribution in both S4N4 and norbornadiene control the regioselectivity of the cycloaddition reaction.
As well, charge distribution on the product should reflect a similar picture of charge density as the reactants, since the electronegativity of the atoms remain the same.
Discussion of Charge Distribution of Reagents
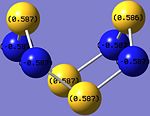
In norbornadiene, as with all alkenes, the C=C bond is a region of high electron density, and thus is highly nucleophilc and susceptible to electrophilic attack. This indicates that it should react with electrophilc sites of low electron density on S4N4.
Looking at the charge distribution of S4N4 again on the right, the S atom has positive charge density (+0.587), and hence is more electrophilic and vulnerable to nucleophilic attack.
Hence, the expected region of norbornadiene attack on S4N4 is at the S atom.
Discussion of Charge Distribution of S4N4.(C7H8)2 Isomers
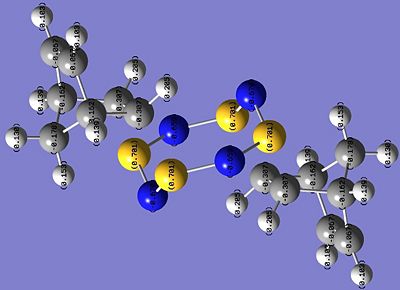
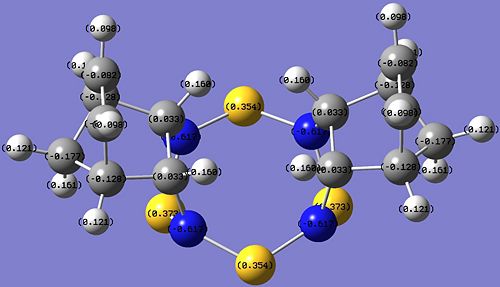
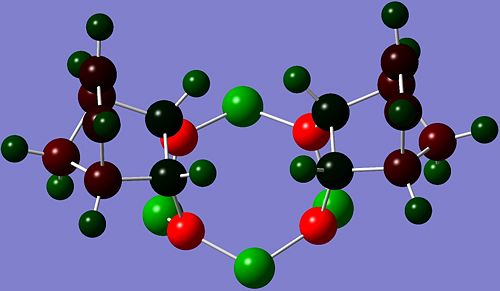
The results of the NBO[20] analysis for both isomers are shown in the images below.
| Griffin-isomer | Allen-isomer |
|---|---|
|
|

|
|
The most obvious difference between the charge distribution of the Griffin- and the Allen- isomers are the charge densities on the C atoms where addition took place. In Griffin-isomer, there is negative charge density (-0.307) on the C atoms, while for the Allen-isomer the charge density on the C atoms is slightly positive (+0.033). In both isomers, all the other C atoms have negative charge density.
Since the C=C bond in norbornadiene has high electron density, and all other C atoms in the hydrocarbon unit of the products have negative charge density, the expected charge density of the reacted C atoms is expected to be negative, indicating that Griffin-isomer is the predicted product by charge distribution analysis.
Further Reactivity Studies for S4N4 with Norbornadiene
Fukui et al[21] studied the orbital interaction between S4N4 and alkenes in cycloadditions. They concluded that electron-rich HOMO of the alkene interacts with the low-lying electron-deficient LUMO of S-S pσ* type on S4N4. Hence, using MO theory to explain the cycloaddition of the alkene across the S-N-S unit. This can be applied to the reaction of S4N4 with norbornadiene. Further studies of the interactions and orientations of the C=C MO in norbornadiene with respect to the S-N-S unit during the reaction can be conducted to better explain the structure of S4N4.(C7H8)2 obtained.
In addition, for further theoretical studies into the selectivity for the Griffin-isomer, the transition states (TS) for both isomers can be modelled using TS(Berny) optimisation in Gaussian. Comparing the energies of the TS, the product with the lower energy TS would be the kinetic product of the reaction. In addition, if the activation energy of the other reaction pathway is high, then the kinetic product would be the only product observed under reaction conditions. It is expected that the Griffin-isomer is the kinetic product of the reaction, and that the TS for the Allen-isomer has a very high energy such that it is not formed at all.
Conclusion
This computational study of S4N4 using Gaussian[1] has proven to be a good means of supporting experimental observations with theoretical methods. The optimisation and subsequent analysis of S4N4 and its adducts with both inorganic and organic compounds afforded structures which corroborate well with literature data.
Howver, further computations of the solid state structures would provide a better approximation to the structures obtained by X-ray crystallography.
References
- ↑ 1.00 1.01 1.02 1.03 1.04 1.05 1.06 1.07 1.08 1.09 1.10 1.11 1.12 1.13 1.14 1.15 1.16 1.17 1.18 1.19 1.20 1.21 1.22 1.23 1.24 1.25 1.26 Gaussian 09, Revision A.1, M. J. Frisch, G. W. Trucks, H. B. Schlegel, G. E. Scuseria, M. A. Robb, J. R. Cheeseman, G. Scalmani, V. Barone, B. Mennucci, G. A. Petersson, H. Nakatsuji, M. Caricato, X. Li, H. P. Hratchian, A. F. Izmaylov, J. Bloino, G. Zheng, J. L. Sonnenberg, M. Hada, M. Ehara, K. Toyota, R. Fukuda, J. Hasegawa, M. Ishida, T. Nakajima, Y. Honda, O. Kitao, H. Nakai, T. Vreven, J. A. Montgomery, Jr., J. E. Peralta, F. Ogliaro, M. Bearpark, J. J. Heyd, E. Brothers, K. N. Kudin, V. N. Staroverov, R. Kobayashi, J. Normand, K. Raghavachari, A. Rendell, J. C. Burant, S. S. Iyengar, J. Tomasi, M. Cossi, N. Rega, J. M. Millam, M. Klene, J. E. Knox, J. B. Cross, V. Bakken, C. Adamo, J. Jaramillo, R. Gomperts, R. E. Stratmann, O. Yazyev, A. J. Austin, R. Cammi, C. Pomelli, J. W. Ochterski, R. L. Martin, K. Morokuma, V. G. Zakrzewski, G. A. Voth, P. Salvador, J. J. Dannenberg, S. Dapprich, A. D. Daniels, O. Farkas, J. B. Foresman, J. V. Ortiz, J. Cioslowski, and D. J. Fox, Gaussian, Inc., Wallingford CT, 2009: web
- ↑ 2.0 2.1 2.2 JP. Hohenberg, W. Kohn, Phys. Rev., 1964, 136, B864: DOI:10.1103/PhysRev.136.B864
- ↑ 3.0 3.1 3.2 3.3 E. Davidson, D. Feller, Chem. Rev., 1986, 86, 4: DOI:10.1021/cr00074a002
- ↑ 4.0 4.1 4.2 M.S. Schuurman, W.D. Allen, H.F. Schaefer III, J. Comput. Chem., 2005, 26, 1106: DOI:10.1002/jcc.20238
- ↑ 5.0 5.1 5.2 5.3 R.S. Mulliken, J. Chem. Phys., 1955, 23, 1833: DOI:10.1063/1.1740588
- ↑ 6.0 6.1 6.2 6.3 6.4 J E. Lennard-Jones, Trans. Faraday Soc., 1929, 25, 668: DOI:10.1039/TF9292500668 10.1039/TF9292500668
- ↑ 7.0 7.1 S.F.A. Kettle, Symmetry and structure: readable group theory for chemists, 3rd ed., John Wiley and Sons, 2007, pp.105.
- ↑ 8.0 8.1 8.2 K.K. Baeck, R.J. Bartlett, J. Chem. Phys, 1997, 106, 4604: DOI:10.1063/1.473986
- ↑ L. Pauling, The Nature of the Chemical Bond, 3rd Ed, Cornell University Press, New York, 1960, p. 6
- ↑ 10.0 10.1 G.N. Lewis, J. Am. Chem. Soc., 1916, 38, 762: DOI:10.1021/ja02261a002
- ↑ I. Langmuir, J. Am. Chem. Soc., 1919, 41, 868: DOI:10.1021/ja02227a002
- ↑ K.M. Anderson, A.G. Orpen, Chem. Commum., 2001, 2682: DOI:10.1039/b108517b
- ↑ 13.0 13.1 F.A. Cotton, D.J. Darensbourg, S. Klein, B.W.S. Kolthammer, Inorg. Chem., 1981, 21, 294: DOI:10.1021/ic00131a055
- ↑ D.J. Darensbourg, R.L. Kump, Inorg. Chem., 1978, 17, 2680-2682: DOI:10.1021/ic50187a062
- ↑ 15.0 15.1 N. Gö, T. Noguti, T. Nishikawa, Appl. Phys. Lett., 2003, 82, 3696: DOI:10.1073/pnas.80.12.3696
- ↑ 16.0 16.1 Y.C. Shen, P.C. Upadhya, E.H. Linfield, A.G. Davies, Proc. Natl. Acad. Sci. USA, 1983, 80, 2350: DOI:10.1063/1.1565680
- ↑ E.C. Alyea, S. Song, Inorg. Chem., 1995, 34, 3864: DOI:10.1021/ic00119a006
- ↑ 18.0 18.1 18.2 18.3 18.4 18.5 18.6 18.7 18.8 F.A. Cotton, Inorg. Chem., 1964, 3, 702: DOI:10.1021/ic50015a024
- ↑ 19.00 19.01 19.02 19.03 19.04 19.05 19.06 19.07 19.08 19.09 19.10 19.11 B.D. Sharma, J. Donohue, Acta Cryst., 1963, 16, 891: DOI:10.1107/S0365110X63002401
- ↑ 20.0 20.1 E.D. Glendening, F. Weinhold, J. Comput. Chem., 1998, 19, 610: DOI:<610::AID-JCC4>3.0.CO;2-U 10.1002/(SICI)1096-987X(19980430)19:6<610::AID-JCC4>3.0.CO;2-U
- ↑ 21.0 21.1 T. Yamabe, K. Tanaka A. Tachibana, K. Fukui, H. Kato, J. Phys. Chem., 1979, 83, 767:DOI:10.1021/j100469a027
- ↑ K.C. Molloy, Group Theory for Chemists, Horwood Publishing, Chichester, 2004, pp.105-111
- ↑ 23.0 23.1 M.S. Gopinathan, M.A. Whitehead, Can. J. Chem, 1975, 53, 1343: DOI:10.1139/v75-185
- ↑ 24.0 24.1 24.2 24.3 24.4 24.5 S.H. Irsen, P. Kroll, R. Dronskowski. T.E. Weirich, M. Epple, Z. Org. Allg. Chem., 2003, 629, 1751: {[DOI|10.1002/zaac.200300123}}
- ↑ M.G.B. Drew, D.H. Templeton, A. Zalkin, Inorg. Chem., 1967, 6, 1906: DOI:10.1021/ic50056a032
- ↑ R.J. Gillespie, J.F. Sawyer, D.R. Slim, J.D. Tyrer, Inorg. Chem., 1982, 21, 1296: DOI:10.1021/ic00134a003
- ↑ 27.00 27.01 27.02 27.03 27.04 27.05 27.06 27.07 27.08 27.09 J. Konu, T. Bajorek, R.S. Laitinen, T. Chivers, R.J. Suontamo, M. Ahlgrén, Eur. J. Inorg. Chem., 2006, , 2951: DOI:10.1002/ejic.200600138
- ↑ 28.00 28.01 28.02 28.03 28.04 28.05 28.06 28.07 28.08 28.09 G.G. Alange, A.J. Banister, J. Inorg. Nucl. Chem., 1978, 40, 203: {[DOI|10.1016/0022-1902(78)80111-0}}
- ↑ 29.0 29.1 29.2 29.3 C.W. Allen, M.R. Brinkman, J. Am. Chem. Soc., 1972, 94, 1550:DOI:10.1021/ja00760a019
- ↑ 30.00 30.01 30.02 30.03 30.04 30.05 30.06 30.07 30.08 30.09 30.10 30.11 30.12 30.13 A.M. Griffin, G.M. Sheldrick, Acta. Cryst., 1975, B31, 895:DOI:10.1107/S0567740875004025

