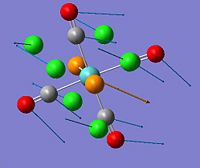
Rep:Mod2:shl108
Part 1: Learning new things
MO analysis of BH3
| BH3 |
| |||
| File Type | .log | |||
| Calculation Type | FOPT | |||
| Calculation Method | RB3LYP | |||
| Basis Set | 3-21G | |||
| Final Energy / a.u. | -26.46226438 | |||
| RMS Gradient Norm / a.u. | 0.00000285 | |||
| Dipole Moment / Debye | 0.00 | |||
| Point Group | D3h | |||
| Job Time / s | 17.0 | |||
| Final B-H Bond Length / Å | 1.19 | |||
| Final B-H Bond Angle / o | 120.0 |
The optimised BH3 structure matches well with the data from Schuurman et al[1]: bond length = 1.19 Å, molecular geometry = trigonal planar, bond angle = 120.0o and point group = D3h. For small molecule like BH3, RB3LYP/3-21G is a sufficient method/basis set to give result with high accuracy.
   Item                  Value        Threshold  Converged?
Maximum Force            0.000006     0.000450     YES
RMS     Force            0.000004     0.000300     YES
Maximum Displacement     0.000022     0.001800     YES
RMS     Displacement     0.000015     0.001200     YES
Predicted change in Energy=-1.886451D-10
Optimization completed.
   -- Stationary point found.
                          ----------------------------
                          !   Optimized Parameters   !
                          ! (Angstroms and Degrees)  !
--------------------------                            --------------------------
! Name  Definition              Value          Derivative Info.                !
--------------------------------------------------------------------------------
! R1    R(1,2)                  1.1944         -DE/DX =    0.0                 !
! R2    R(1,3)                  1.1944         -DE/DX =    0.0                 !
! R3    R(1,4)                  1.1944         -DE/DX =    0.0                 !
! A1    A(2,1,3)              120.0            -DE/DX =    0.0                 !
! A2    A(2,1,4)              120.0            -DE/DX =    0.0                 !
! A3    A(3,1,4)              120.0            -DE/DX =    0.0                 !
! A4    L(2,1,3,4,-2)         180.0            -DE/DX =    0.0                 !
--------------------------------------------------------------------------------
The energy difference between the unoptimised and optimised BH3 structure is 1.886451D-10 kJmol-1. The optimised structure is the energetically stable which has reached the minima.
BH3 MO analysis Log file:File:Bh3 MO log.out
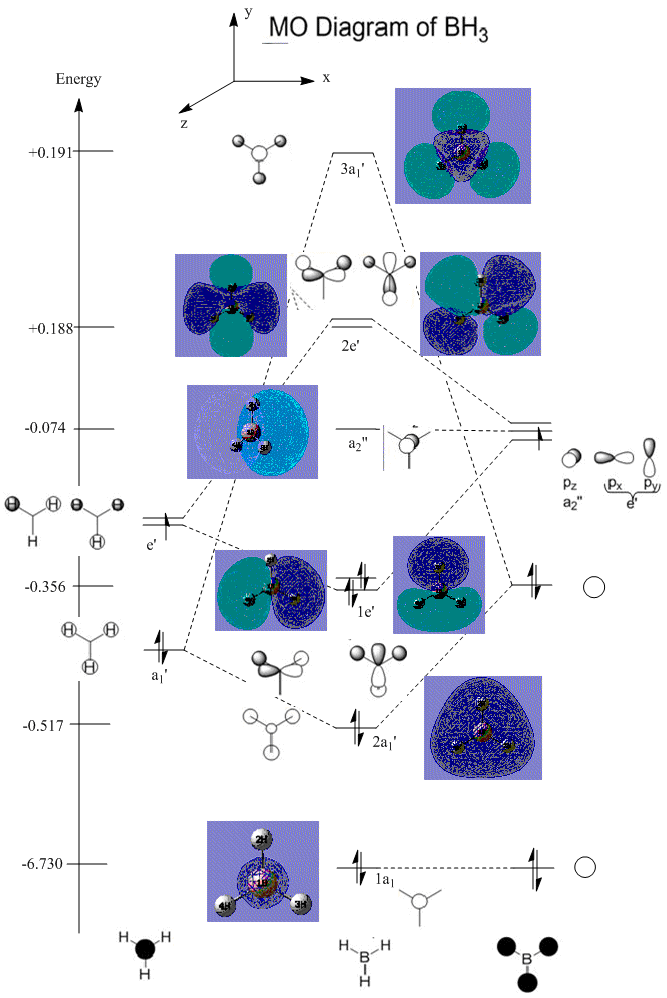
The MO diagram of BH3 produced by Linear Combination of Atomic Orbitals (LCAO) is copied from Dr Patricia Hunt's 2nd year lecture course. A population analysis of BH3 with Gaussian was performed to generate MOs. The MOs of BH3 generated by these two different methods are compared. In qualitative view, the shape and size of the MOs generated from these methods are highly matched. Therefore, both methods have shown a good prediction of the image of the MOs of BH3.
However, in quantitative view, these methods cannot give a very accurate prediction for the energies of the MOs. In order to calculate a more accurate result, more terms need to take into account to solve the Schrödinger equation. In addition, Schrödinger equation uses hydrogen which is a 1 electron atom as a reference to simulate the many electron system. However, the orbitals of higher energies will be very different to the 1s orbital and the orbitals mixes to form more complex MOs. Therefore, by solving the Schrödinger equation, a very close value to the experimental can be obtained but is rare to get the exact match with the experimental. Moreover, the accuracy of Gaussian method is still a reasonable value for understanding the chemistry behind a range of molecules for this project.
Vibrational Analysis of BH3
| No | form of the vibration | diagram | Frequency | Intensity | Symmetry of D3h group | Literature Frequency[1]/ cm-1 |
| 1 | Out-of-Plane Wagging |  |
1146 | 94 | A2" | 1159 |
| 2 | In-Plane Scissoring |  |
1205 | 12 | E' | 1202 |
| 3 | In-Plane Rocking |  |
1205 | 12 | E' | 1202 |
| 4 | Symmetric Stretching |  |
2592 | 0 | A1' | - |
| 5 | Asymmetric Stretching |  |
2730 | 104 | E' | 104 |
| 6 | Asymmetric Stretching |  |
2730 | 104 | E' | 2616 |
BH3 frequency analysis:File:BH3FREQ.LOG
Structural analysis of TlBr3
The D3h ground state structure of TlBr3 was optimised and the result table was shown below:
| TlBr3 |
| |||
| File Type | .log | |||
| Calculation Type | FOPT | |||
| Calculation Method | RB3LYP | |||
| Basis Set | LANL2DZ | |||
| Final Energy / a.u. | -91.21812851 | |||
| RMS Gradient Norm / a.u. | 0.00000090 | |||
| Dipole Moment / Debye | 0.00 | |||
| Point Group | D3h | |||
| Job Time / s | 16.0 | |||
| Final B-H Bond Length / Å | 1.19↓ | |||
| Final B-H Bond Angle / o | 120.0 | |||
| log file of optimisation | File:TLBR3 OPTIMISATION.LOG |
         Item               Value     Threshold  Converged?
Maximum Force            0.000002     0.000450     YES
RMS     Force            0.000001     0.000300     YES
Maximum Displacement     0.000022     0.001800     YES
RMS     Displacement     0.000014     0.001200     YES
Predicted change in Energy=-6.102959D-11
Optimization completed.
   -- Stationary point found.
                          ----------------------------
                          !   Optimized Parameters   !
                          ! (Angstroms and Degrees)  !
--------------------------                            --------------------------
! Name  Definition              Value          Derivative Info.                !
--------------------------------------------------------------------------------
! R1    R(1,2)                  2.651          -DE/DX =    0.0                 !
! R2    R(1,3)                  2.651          -DE/DX =    0.0                 !
! R3    R(1,4)                  2.651          -DE/DX =    0.0                 !
! A1    A(2,1,3)              120.0            -DE/DX =    0.0                 !
! A2    A(2,1,4)              120.0            -DE/DX =    0.0                 !
! A3    A(3,1,4)              120.0            -DE/DX =    0.0                 !
! A4    L(3,1,4,2,-2)         180.0            -DE/DX =    0.0                 !
--------------------------------------------------------------------------------
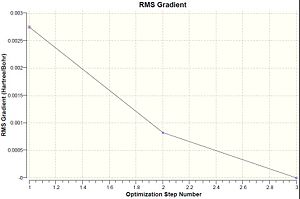
 The calculated bond length and bond angle are 2.65 Å and 120.0o respectively. According to the reference[2], the experimental bond length for Tl-Br is 2.52 Å with bond angle 120.0o. Although there is a difference between calculated and experimental value, it is still a reasonable guess which shows the powerful prediction made from computational chemistry.
The low frequencies are shown below:
Low frequencies ---   -3.4213   -0.0026   -0.0004    0.0015    3.9362    3.9362
Low frequencies ---   46.4289   46.4292   52.1449
Diagonal vibrational polarizability:
      61.4729382      61.4706185      57.8641562
Harmonic frequencies (cm**-1), IR intensities (KM/Mole), Raman scattering
activities (A**4/AMU), depolarization ratios for plane and unpolarized
incident light, reduced masses (AMU), force constants (mDyne/A),
and normal coordinates:
                    1                      2                      3
                   E'                     E'                     A2"
Frequencies --    46.4289                46.4292                52.1449
Red. masses --    88.4613                88.4613               117.7209
Frc consts  --     0.1124                 0.1124                 0.1886
IR Inten    --     3.6867                 3.6867                 5.8466
Atom AN      X      Y      Z        X      Y      Z        X      Y      Z
  1  81     0.00   0.28   0.00    -0.28   0.00   0.00     0.00   0.00   0.55
  2  35     0.00   0.26   0.00     0.74   0.00   0.00     0.00   0.00  -0.48
  3  35    -0.43  -0.49   0.00    -0.01   0.43   0.00     0.00   0.00  -0.48
  4  35     0.43  -0.49   0.00    -0.01  -0.43   0.00     0.00   0.00  -0.48
                    4                      5                      6
                   A1'                    E'                     E'
Frequencies --   165.2685               210.6948               210.6948
Red. masses --    78.9183               101.4032               101.4032
Frc consts  --     1.2700                 2.6522                 2.6522
IR Inten    --     0.0000                25.4830                25.4797
Atom AN      X      Y      Z        X      Y      Z        X      Y      Z
  1  81     0.00   0.00   0.00     0.42   0.00   0.00     0.00   0.42   0.00
  2  35     0.00   0.58   0.00     0.01   0.00   0.00     0.00  -0.74   0.00
  3  35     0.50  -0.29   0.00    -0.55   0.32   0.00     0.32  -0.18   0.00
  4  35    -0.50  -0.29   0.00    -0.55  -0.32   0.00    -0.32  -0.18   0.00
The optimised TlBr3 was analysed further by frequency analysis. The result table remained the same as optimised structure. In order to perform the frequency analysis, the same method and basis set must be used as the optimisation. It is because basis set is a tool to describe the MOs of the components of the analysed molecule. If different basis set is being used, the frequency analysis cannot be performed due to the compatibility of the basis set. Only the same basis set can be compared.
For symmetrical molecule, the vibrational modes are 3N-6, where N is the number of atom in the molecule. For non-symmetrical molecule, the vibrational modes are 3N-5. Therefore, for both BH3 and TlBr3, 6 vibrational modes should be observed.
By performing frequency analysis, the optimised structure can be confirmed as one of the minimum potential energy of the ground state and may find the existence of transition state. It also confirmed the point group of the molecule by matching up the symmetry of the vibrational modes. Only when there is a dipole moment change, a Infra red peak will be observed. Therefore, for symmetrical stretching, there will have zero intensity which is IR in-active.
When the molecule undergoes optimisation, bond may disappear. This is because of the programming restraints. When the bond length exceeds the data recorded in the Gaussianview database, the program does not recognise that as a bond. Hence, the bond disappears. This often occurs in inorganic compound, since the bond length in the database is mostly based on organic molecule.
Bonding is the attraction between two atoms. This attraction is based on the electrostatics interaction,the positive charged ions and nucleus, and the negative charged electron. This attraction can be considered as ionic, covalent and metallic bonding. In addition, intermolecular force, sometimes, can be considered as a very weak bonding. It is formed by the interaction of the dipoles. There are Van der Waals, dipole-dipole, ions-dipole and hydrogen bonding. An atomic orbital shows the distribution of the electron charge in a 3D space. When two atomic orbitals interact, a new molecular orbital is formed which has a different shape to the AOs. In MO theory, all AOs in a molecule can mix together to form a series of complex MOs. In addition, orbital just tells the space that has a high probability of finding electrons. According to uncertainty principle, momentum and position can not be determined at the same time. Therefore, the location of the electrons in the bonding area cannot be determined as well. Particle-wave duality allows electron to be visualise as wave. Therefore, the orbital can be viewed as space with high electron density which provide more information about the bonding of the molecule. By looking at the shape of the MOs, the electron rich and electron poor region can be fairly determined that help to understanding the chemical properties of the molecule.
Part 2: An organometallic complex
Cis and Trans isomerism
| trans-[Mo(CO)4(PCl3)2] | cis-[Mo(CO)4(PCl3)2] | |||||||
|
| |||||||
| File Type | .log | .log | ||||||
| Calculation Type | FOPT | FOPT | ||||||
| Calculation Method | RB3LYP | RB3LYP | ||||||
| Basis Set | LANL2MB | LANL2MB | ||||||
| Final Energy / a.u. | -617.52204366 | -617.52510207 | ||||||
| RMS Gradient Norm / a.u. | 0.00005111 | 0.00001464 | ||||||
| Dipole Moment / Debye | 0.23 | 8.63 | ||||||
| Point Group | C1 | C1 | ||||||
| Job Time | 5 min 12.3 s | 16 min 8.5 s | ||||||
| Log File | File:TransMo.out | File:CisMo.out |
| trans-[Mo(CO)4(PCl3)2] | cis-[Mo(CO)4(PCl3)2] | |
| File Type | .log | .log |
| Calculation Type | FOPT | FOPT |
| Calculation Method | RB3LYP | RB3LYP |
| Basis Set | LANL2DZ | LANL2DZ |
| Final Energy / a.u. | -623.57602489 | -623.57707176 |
| RMS Gradient Norm / a.u. | 0.00000086 | 0.00004620 |
| Dipole Moment / Debye | 0.30 | 1.30 |
| Point Group | C1 | C1 |
| Job Time | 1 h 28 min 50.3 s | 32 min 12.4 s |
| Log File of the optimised molecule | File:TransMo2.out | File:CisMo2.out |
| Log File of vibrational analysis | File:TransMo2freq.out | File:CisMo2freq.out |
| IR spectrum of vibrational analysis |  |
|
The energy difference between these two isomers calculated by RB3LYP/LANL2MB is 8.03 kJmol-1. The energy difference between these two isomers calculated by RB3LYP/LANL2DZ is 2.75 kJmol-1. Although the energies of isomers calculated from different basis set cannot be compared, the energy difference of the isomers can be compared. From both calculation, it is suggested that cis-isomer is the more stable by energy difference respectively. The energy difference is sufficient large to allow these isomers to be determined experimentally. Both isomer have the C1 symmetry. It is worth to notify that cis isomer has a significant larger dipole moment than trans-isomer. It means the trans isomer is more likely to cancel out dipole moment due to the same polar ligands are placed oppositely on the geometry.In fact, this trans effect also affects the result of the vibrational analysis. It is because the IR spectroscopy records a peak when the vibrational mode has a change in dipole moment of a bond.
Vibrational analysis of Mo(CO)4(PCl3)2 Isomers
The low frequencies observed from both isomers are close to zero. Therefore, these rocking vibrational modes require a low amount of energy to be activated. At room temperature, the energy available is equal to kBT. For 298 K, there is 4.11x10⁻²¹ J. Therefore, at room temperature, all these vibrations will be activated. These vibrations show the anharmonicity and the entropic contribution of the system. Hence, the vibrating frequencies is temperature dependence.
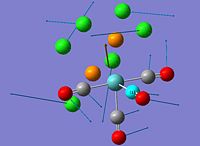
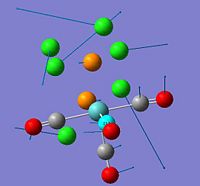
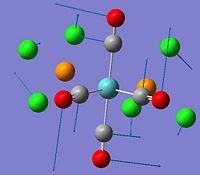
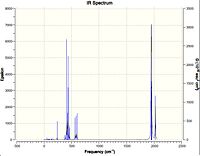
PCl3 and CO are π-acceptor ligands. Therefore, the back-bonding of the metal-ligand bond is shown by the strong ligand bond vibration. The position of the PCl3 affects the geometry of the structure. Hence, the CO ligands are replaced either all trans or trans-cis in trans isomer and cis isomer respectively. Trans isomer have 3(2)-5 = 1 vibration mode and will have symmetric stretches which does not have net dipole moment change. Therefore, only one peak was observed. Whereas cis isomer, it loses the symmetry and allows asymmetric stretches, and, as a result, 4 peaks were observed. Literature[3] for this cis-trans isomers frequency analysis.
This phenomonen of more stable cis isomer can be explained by considing the electronic and steric factors. Electronically, trans effect in the metal complex favours the cis-isomer. This is due to the strong π-acceptors CO ligands which have a very strong trans effect and , the preferred orientation of the ligands would be the case when there are less CO ligands opposite each other. In the cis-isomer, there is only 1 pair of CO ligands which are trans to each other, whereas in the trans-complex there are 2 pairs of CO ligands which are trans to each other.
| Calculated Frequency / cm-1 | Calculated Intensity | Experimental Frequency[3] / cm-1 | Point Group (C2v Symmetry)[3] |
|---|---|---|---|
| 1945 | 762 | 1986 | B2 |
| 1949 | 1500 | 1994 | B1 |
| 1959 | 634 | 2004 | A1 |
| 2024 | 597 | 2072 | A1 |
| Calculated Frequency / cm-1 | Calculated Intensity | Experimental Frequency[3] / cm-1 | Point Group (D4h Symmetry)[3] |
|---|---|---|---|
| 1951 | 1473 | 1896 | Eu |
| 1951 | 1469 | 1896 | Eu |
| 1977 | 1 | - | B1g |
| 2031 | 4 | - | A1g |
Vibrational analysis of Mo(CO)4(PPh3)2 Isomers
| Property | cis-Mo(CO)4(PPh3)2 | Trans-Mo(CO)4(PPh3)2 |
|---|---|---|
| File Type | .log | .log |
| Calculation Type | FOPT | FOPT |
| Calculation Method | RB3LYP | RB3LYP |
| Basis Set | LANL2DZ | LANL2DZ |
| Final Energy / a.u. | -1923.54334238 | -1923.54039869 |
| RMS Gradient Norm / a.u. | 0.00061072 | 0.00000235 |
| Dipole Moment / Debye | 6.2783 | 0.0004 |
| Point Group | C1 | C1 |
| Job Time | 1 day 18 h 22 min 17.3 s | 1 day 18 h 6 min 16.9 s |
From the literature for Mo(CO)4(PPh3)2 Isomers[4], the trans isomer is more stable than cis determined experimentally. This is due to the steric hinderance of the bulky PPh3 ligands. However, the optimisation which was done by RB3LYP/LANL2DZ calculation showed that the cis isomer is the more stable somer, by 7.73 kJmol-1.
What the literature has mentioned is that isomerisation from the cis- to the trans- isomer occurs when the cis- isomer is refluxed in dry toluene[5]. Isomerisation occurs in solution via the initial cleavage of the Mo-P bond and dissociation of PPh3, since the phosphine size and cone angle are large. However, the optimisation in Guassian was run in gas phase for these complexes but not in solution.
Part 3: Mini project
Structure Analysis of geometric isomerism of PF2Cl3 and PF3Cl2
Optimisation
| Property | trans-PF2Cl3 | cis-PF2Cl3 | trans-PF3Cl2 | cis-PF3Cl2 | ||||||||||||
|---|---|---|---|---|---|---|---|---|---|---|---|---|---|---|---|---|
| File Type | .log | .log | .log | .log | ||||||||||||
| Calculation Type | FOPT | FOPT | FOPT | FOPT | ||||||||||||
| Calculation Method | RMP2-FC | RMP2-FC | RMP2-FC | RMP2-FC | ||||||||||||
| Basis Set | 6-311G(d,p) | 6-311G(d,p) | 6-311G(d,p) | 6-311G(d,p) | ||||||||||||
| Final Energy / a.u. | -1919.18242001 | -1919.16844922 | -1559.21734381 | -1559.23074691 | ||||||||||||
| RMS Gradient Norm / a.u. | 0.00002130 | 0.00018081 | 0.00000276 | 0.00006520 | ||||||||||||
| Dipole Moment / Debye | 0.00 | 1.16 | 0.00 | 0.87 | ||||||||||||
| Point Group | D3h | C2v | D3h | C2v | ||||||||||||
| Job Time | 4 min 1.0 s | 13 min 52.0 s | 6 min 16.0 s | 7 min 48.0 s | ||||||||||||
| Log file | File:TransPF2Cl3opt.out | File:CisPF2Cl3opt.out | File:TransPF3Cl2opt.out | File:CisPF3Cl2opt.out | ||||||||||||
| Molecule |
|
|
|
|
For PF2Cl3, trans isomer is more stable that cis isomer by 36.68 kJmol-1. For PF3Cl2, the cis isomer is more stable than trans isomer by 35.19 kJmol-1. An electron diffraction investigation[6] supports a trigonal bipyrimidal for PF3Cl2 in which F atoms in the equatorial positions and Cl atoms in the axial sites at room temperature. However, a trigonal bipyrimidal for PF3Cl2 in which Cl atoms in the equatorial positions and F atoms in the axial sites occurs at low temperature.[7] From the vibrational analysis, the cis-PF3Cl2 is more stable than its trans isomer which is confirmed by both calculation and experimental. In addition, the trans-PF2Cl3 is more stable than its cis isomer which is also confirmed by the vibrational analysis done by calculation and experimental.
MO analysis
| Isomer (s) | HOMO-2 | HOMO-1 | HOMO | LUMO | LUMO+1 | LUMO+2 | MO fchk file |
|---|---|---|---|---|---|---|---|
| trans-PF2Cl3 |  |
 |
 |
 |
 |
 |
File:TransPF2Cl3MO.fchk |
| cis-PF2Cl3 | 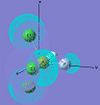 |
 |
 |
 |
 |
 |
File:CisPF2Cl3MO.fchk |
| trans-PF3Cl2 |  |
 |
 |
 |
 |
 |
File:TransPF3Cl2MO.fchk |
| cis-PF3Cl2 |  |
 |
 |
 |
 |
 |
File:CisPF3Cl2MO.fchk |
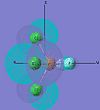
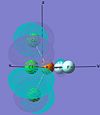
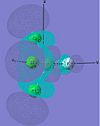
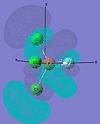
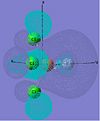
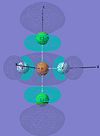
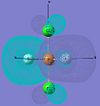
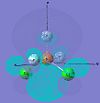
The MOs of cis-PF3Cl2 are dicussed here. For HOMO-2, the electron density concentrates in the axial site. In addition, Cl has a greater electron content than F in this MO. For HOMO-1, electron density concentrates on the Cl ligands again but in different orientation. It repeats the trend in HOMO. This show the HOMO-2, HOMO-1 and HOMO were generated with a large degree of p orbitals of Cl.
For LUMO, LUMO+1 and LUMO+2, the electron density spreads throughout the molecule. This is because the Gaussian only make accurate calculation for occupied orbitals. Therefore, the simulation for these orbitals is less accurate. However, they still give out a reasonable assumption of the sahpe of MOs.
In conclusion, nucleophile and elctrophile can approach the complex to the anti-bonding region of these MOs. These anti-bonding regions concentrate on the interspace between metal-flouride and metal-chloride bond, and around the Cl ligand. LUMO+2 is a special case where the flouride at the axial site has a very large antibonding region.
NBO analysis
| Isomer (s) | Charge Number | Colour Atom by Charge | NBO log file |
|---|---|---|---|
| trans-PF2Cl3 |  |
 |
File:TransPF2Cl3MO.out |
| cis-PF2Cl3 | 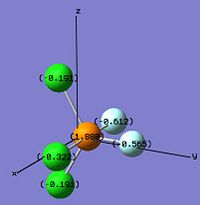 |
 |
File:CisPF2Cl3NBO.out |
| trans-PF3Cl2 |  |
 |
File:TransPF3Cl2NBO.out |
| cis-PF3Cl2 |  |
 |
File:CisPF3Cl2NBO.out |
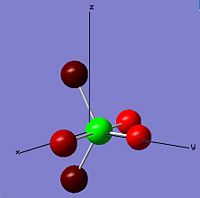
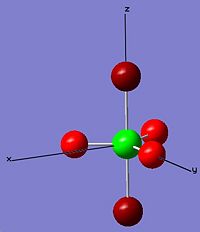
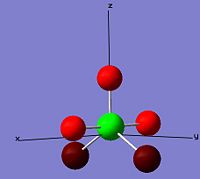
From the diagrams above, phosphorus has the change number in the range between 1.8190 to 2.307 in these molecules and isomers which is elctrophilic and likely to perform nucleophilic attack. Flouride is always more nucleophilic than chloride because of its high electronegativity. In cis-PF2Cl3, one flouride and one chloride are placed in the axial position which fluroide has the highest charge number, -0.612, among the others.
trans-PF2Cl3
    Atom  No          Natural Electron Configuration
----------------------------------------------------------------------------
     P    1      [core]3S( 0.99)3p( 2.02)3d( 0.15)5p( 0.02)
     F    2      [core]2S( 1.90)2p( 5.70)
     F    3      [core]2S( 1.90)2p( 5.70)
    Cl    4      [core]3S( 1.90)3p( 5.29)3d( 0.01)
    Cl    5      [core]3S( 1.90)3p( 5.29)3d( 0.01)
    Cl    6      [core]3S( 1.90)3p( 5.29)3d( 0.01)
      (Occupancy)   Bond orbital/ Coefficients/ Hybrids
---------------------------------------------------------------------------------
    1. (1.93762) BD ( 1) P   1 - F   2
               ( 15.11%)   0.3887* P   1 s( 19.08%)p 2.62( 50.00%)d 1.62( 30.92%)
               ( 84.89%)   0.9214* F   2 s( 26.38%)p 2.79( 73.55%)d 0.00(  0.08%)
    2. (1.93762) BD ( 1) P   1 - F   3
               ( 15.11%)   0.3887* P   1 s( 19.08%)p 2.62( 50.00%)d 1.62( 30.92%)
               ( 84.89%)   0.9214* F   3 s( 26.38%)p 2.79( 73.55%)d 0.00(  0.08%)
    3. (1.93148) BD ( 1) P   1 -Cl   4
               ( 35.32%)   0.5943* P   1 s( 20.67%)p 3.13( 64.70%)d 0.71( 14.63%)
               (64.68%)     0.8042*Cl  4 s( 13.69%)p 6.25( 85.61%)d 0.05(  0.70%)
    4. (1.93148) BD ( 1) P   1 -Cl   5
               ( 35.32%)   0.5943* P   1 s( 20.67%)p 3.13( 64.70%)d 0.71( 14.63%)
               ( 64.68%)   0.8042*Cl   5 s( 13.69%)p 6.25( 85.61%)d 0.05(  0.70%)
    5. (1.93148) BD ( 1) P   1 -Cl   6
               ( 35.32%)   0.5943* P   1 s( 20.67%)p 3.13( 64.70%)d 0.71( 14.63%)
               ( 64.68%)   0.8042*Cl   6 s( 13.69%)p 6.25( 85.61%)d 0.05(  0.70%)
    6. (2.00000) CR ( 1) P   1           s(100.00%)
cis-PF2Cl3
    Atom  No          Natural Electron Configuration
----------------------------------------------------------------------------
     P    1      [core]3S( 0.97)3p( 1.98)3d( 0.14)5p( 0.02)
     F    2      [core]2S( 1.90)2p( 5.70)
     F    3      [core]2S( 1.89)2p( 5.67)
    Cl    4      [core]3S( 1.90)3p( 5.27)3d( 0.01)
    Cl    5      [core]3S( 1.90)3p( 5.27)3d( 0.01)
    Cl    6      [core]3S( 1.93)3p( 5.38)3d( 0.01)
       (Occupancy)   Bond orbital/ Coefficients/ Hybrids
---------------------------------------------------------------------------------
    1. (1.94064) BD ( 1) P   1 - F   2
               ( 15.21%)   0.3900* P   1 s( 18.13%)p 2.87( 52.00%)d 1.65( 29.87%)
               ( 84.79%)   0.9208* F   2 s( 27.23%)p 2.67( 72.69%)d 0.00(  0.08%)
    2. (1.96718) BD ( 1) P   1 - F   3
               ( 17.40%)   0.4171* P   1 s( 20.29%)p 3.21( 65.13%)d 0.72( 14.58%)
               ( 82.60%)   0.9089* F   3 s( 29.18%)p 2.42( 70.73%)d 0.00(  0.09%)
    3. (1.92984) BD ( 1) P   1 -Cl   4
               ( 35.68%)   0.5973* P   1 s( 21.61%)p 2.98( 64.46%)d 0.64( 13.92%)
               ( 64.32%)   0.8020*Cl   4 s( 12.64%)p 6.85( 86.64%)d 0.06(  0.72%)
    4. (1.92984) BD ( 1) P   1 -Cl   5
               ( 35.68%)   0.5973* P   1 s( 21.61%)p 2.98( 64.46%)d 0.64( 13.92%)
               ( 64.32%)   0.8020*Cl   5 s( 12.64%)p 6.85( 86.64%)d 0.06(  0.72%)
    5. (1.86252) BD ( 1) P   1 -Cl   6
               ( 28.64%)   0.5352* P   1 s( 18.38%)p 2.64( 48.44%)d 1.80( 33.17%)
               ( 71.36%)   0.8447*Cl   6 s( 10.73%)p 8.26( 88.67%)d 0.06(  0.60%)
    6. (2.00000) CR ( 1) P   1           s(100.00%)
trans-PF3Cl2
   Atom  No          Natural Electron Configuration
----------------------------------------------------------------------------
     P    1      [core]3S( 0.83)3p( 1.70)3d( 0.14)5p( 0.02)
    Cl    2      [core]3S( 1.92)3p( 5.38)3d( 0.01)
    Cl    3      [core]3S( 1.92)3p( 5.38)3d( 0.01)
     F    4      [core]2S( 1.90)2p( 5.66)
     F    5      [core]2S( 1.90)2p( 5.66)
     F    6      [core]2S( 1.90)2p( 5.66)
    (Occupancy)   Bond orbital/ Coefficients/ Hybrids
---------------------------------------------------------------------------------
    1. (1.87592) BD ( 1) P   1 -Cl   2
               ( 28.98%)   0.5383* P   1 s( 17.10%)p 2.92( 50.00%)d 1.92( 32.90%)
               ( 71.02%)   0.8427*Cl   2 s( 12.09%)p 7.21( 87.25%)d 0.05(  0.66%)
    2. (1.87592) BD ( 1) P   1 -Cl   3
               ( 28.98%)   0.5383* P   1 s( 17.10%)p 2.92( 50.00%)d 1.92( 32.90%)
               ( 71.02%)   0.8427*Cl   3 s( 12.09%)p 7.21( 87.25%)d 0.05(  0.66%)
    3. (1.96837) BD ( 1) P   1 - F   4
               ( 17.42%)   0.4174* P   1 s( 21.96%)p 2.94( 64.65%)d 0.61( 13.39%)
               ( 82.58%)   0.9087* F   4 s( 26.75%)p 2.73( 73.15%)d 0.00(  0.09%)
    4. (1.96837) BD ( 1) P   1 - F   5
               ( 17.42%)   0.4174* P   1 s( 21.96%)p 2.94( 64.65%)d 0.61( 13.39%)
               ( 82.58%)   0.9087* F   5 s( 26.75%)p 2.73( 73.15%)d 0.00(  0.09%)
    5. (1.96837) BD ( 1) P   1 - F   6
               ( 17.42%)   0.4174* P   1 s( 21.96%)p 2.94( 64.65%)d 0.61( 13.39%)
               ( 82.58%)   0.9087* F   6 s( 26.75%)p 2.73( 73.15%)d 0.00(  0.09%)
    6. (2.00000) CR ( 1) P   1           s(100.00%)
Cis-PF3Cl2
   Atom  No          Natural Electron Configuration
----------------------------------------------------------------------------
     P    1      [core]3S( 0.87)3p( 1.78)3d( 0.14)5p( 0.02)
    Cl    2      [core]3S( 1.91)3p( 5.29)3d( 0.01)
    Cl    3      [core]3S( 1.91)3p( 5.29)3d( 0.01)
     F    4      [core]2S( 1.90)2p( 5.69)
     F    5      [core]2S( 1.90)2p( 5.69)
     F    6      [core]2S( 1.89)2p( 5.67)
  (Occupancy)   Bond orbital/ Coefficients/ Hybrids
---------------------------------------------------------------------------------
    1. (1.93289) BD ( 1) P   1 -Cl   2
               ( 34.72%)   0.5893* P   1 s( 21.31%)p 3.00( 63.93%)d 0.69( 14.76%)
               ( 65.28%)   0.8079*Cl   2 s( 12.90%)p 6.70( 86.38%)d 0.06(  0.72%)
    2. (1.93289) BD ( 1) P   1 -Cl   3
               ( 34.72%)   0.5893* P   1 s( 21.31%)p 3.00( 63.93%)d 0.69( 14.76%)
               ( 65.28%)   0.8079*Cl   3 s( 12.90%)p 6.70( 86.38%)d 0.06(  0.72%)
    3. (1.93790) BD ( 1) P   1 - F   4
               ( 15.19%)   0.3897* P   1 s( 18.74%)p 2.67( 50.01%)d 1.67( 31.25%)
               ( 84.81%)   0.9209* F   4 s( 26.40%)p 2.79( 73.52%)d 0.00(  0.08%)
    4. (1.93790) BD ( 1) P   1 - F   5
               ( 15.19%)   0.3897* P   1 s( 18.74%)p 2.67( 50.01%)d 1.67( 31.25%)
               ( 84.81%)   0.9209* F   5 s( 26.40%)p 2.79( 73.52%)d 0.00(  0.08%)
    5. (1.96851) BD ( 1) P   1 - F   6
               ( 17.46%)   0.4178* P   1 s( 20.08%)p 3.27( 65.73%)d 0.71( 14.19%)
               ( 82.54%)   0.9085* F   6 s( 29.60%)p 2.37( 70.31%)d 0.00(  0.09%)
    6. (2.00000) CR ( 1) P   1           s(100.00%)
The NBO analysis shows the degree of s, p and d orbitals in mixing in order to generate corresponding MO. For these four molecules, orbital 6 has 100% s charactered which is the core AO of phosphrous(CR).
Vibration Analysis
| No | Form of the vibration | trans-PF3Cl2 Frequency | Intensity | Symmetry of D3h group| No | cis-PF3Cl2 Frequency | Intensity | Symmetry of C2v group | Literature frequency[8] | Symmetry | Activity |
|---|---|---|---|---|---|---|---|---|---|---|
| 1 | PF2 axial bend | 121 | 0 | E' | 116 | 0 | A' | 122 | E' | Ramen (dp), IR |
| 2 | PF2 axial bend | 121 | 46 | E' | 128 | 0 | A" | 122 | E' | Ramen (dp), IR |
| 3 | Out of plane PCl3 bend | 334 | 6 | A2" | 278 | 1 | A" | 328 | A2" | IR |
| 4 | Rocking | 356 | 0 | E" | 291 | 2 | A' | 357 | E" | Ramen (dp) |
| 5 | Rocking | 356 | 0 | E' | 346 | 8 | A' | 357 | E" | Ramen (dp) |
| 6 | Symmetric PCl3 stretch | 390 | 25 | A1' | 399 | 84 | A' | 387 | A1' | Ramen (p) |
| 7 | PCl3 in-plane bend | 411 | 17 | E' | 401 | 10 | A" | 404 | E' | Ramen (dp), IR |
| 8 | PCl3 in-plane bend | 411 | 17 | E' | 445 | 7 | A' | 404 | E' | Ramen (dp), IR |
| 9 | Symmetric PF2 stretch | 630 | 0 | A1' | 522 | 62 | A' | 633 | A1' | Ramen (p) |
| 10 | Antisymmetric PCl3 stretch | 635 | 336 | E' | 636 | 332 | A" | 625 | E' | Ramen (dp), IR |
| 11 | Antisymmetric PCl3 stretch | 635 | 336 | E' | 792 | 305 | A' | 625 | E' | Ramen (dp), IR |
| 12 | Antisymmetric PF2 stretch | 879 | 295 | A2" | 896 | 210 | A' | 867 | A2" | IR |
| No | Form of the vibration | trans-PF2Cl3 Frequency | Intensity | Symmetry of D3h group| No | cis-PF2Cl3 Frequency | Intensity | Symmetry of C2v group | Literature frequency[8] | Symmetry |
|---|---|---|---|---|---|---|---|---|---|
| 1 | PCl2 bending | 115 | 0 | E' | 125 | 0 | A1 | 124 | A1 |
| 2 | PF2 rocking | 115 | 0 | E' | 157 | 0 | B2 | 124 | B2 |
| 3 | PF'2 wagging bend | 360 | 16 | E' | 345 | 5 | B1 | 338 | B1 |
| 4 | Cl2PF'2 twist | 360 | 16 | E' | 361 | 0 | A2 | 368 | A2 |
| 5 | PCl2 stretching | 363 | 0 | A1' | 412 | 1 | A1 | 407 | A1 |
| 6 | PF bending (yz) | 390 | 0 | E" | 430 | 16 | B2 | 500 | B2 |
| 7 | PF'2 bending | 390 | 0 | E" | 496 | 56 | A1 | 488 | A1 |
| 8 | PF bending (xz) | 473 | 3 | A2" | 515 | 17 | B1 | 368 | B1 |
| 9 | PF'2 stretching | 592 | 780 | A2" | 656 | 1 | A1 | 665 | A1 |
| 10 | PF'2 stretching | 707 | 0 | A1' | 673 | 431 | B2 | 925 | B2 |
| 11 | PCl2 stretching | 971 | 226 | E' | 913 | 342 | B1 | 427 | B1 |
| 12 | PF stretching stretch | 971 | 226 | E' | 921 | 240 | A1 | 902 | A1 |
| trans-PF2Cl3 | cis-PF2Cl3 | trans-PF3Cl2 | cis-PF3Cl2 |
|---|---|---|---|
| File:TransPF2Cl3freq.out | File:CisPF2Cl3freq.out | File:TransPF3Cl2freq.out | File:CisPF3Cl2freq.out |
From the frequency analysis run by Gaussian, a list of vibrational frequencies of every compounds was shown. By comparing with the literature value, calculated values show a fairly accurate prediction of the IR spectrum. For PF2Cl3, result agrees with the symmetry of D3h which is the trans isomer. For PF3Cl2, the spectrum agrees with the symmetry of C2v which is the cis isomer. Therefore, Gaussian is a very powerful technique for predicting molecule's vibrational spectrum.
Reference
- ↑ 1.0 1.1 M.S. Schuurman, W.D. Allen, H.F. Schaefer III, J. Comput. Chem., 2005, 26, 1106: DOI:10.1002/jcc.20238
- ↑ J. Glaser, Acta Chem. Scand. A, 1979, 33, 789
- ↑ 3.0 3.1 3.2 3.3 3.4 F.A. Cotton, Inorg. Chem., 1964, 3, 702: DOI:10.1021/ic50015a024
- ↑ F.A. Cotton, D.J. Darensbourg, S. Klein, B.W.S. Kolthammer, Inorg. Chem., 1981, 21, 294: DOI:10.1021/ic00131a055
- ↑ D.J. Darensbourg, R.L. Kump, Inorg. Chem., 1978, 17, 2680-2682: DOI:10.1021/ic50187a062
- ↑ L. O. Brockway and J. Y. Beach, J. Am. Chern. Soc. 60, 1836 (1938)
- ↑ E. L. Muetterties, W. Mahler, and R. Schmutzler, Inorg. Chern. 2, 613 (1963)
- ↑ 8.0 8.1 James E. Griffiths, Richard P. Carter, and Robert R. Holmes, J. Chem. Phys., 1964, 41, 1964, 863: DOI:10.1063/1.1725974

