Rep:Mod2:p.thakrar
Module 2 - Inorganic Computational Techniques
Modelling using computational chemistry provides an insight into the complex structure and bonding found within inorganic complexes. Computational techniques can differentiate between the energy of stable conformers and can help determine the location of the transition state or activated complex that may not be possible via experimental methods.
Borane
Optimization
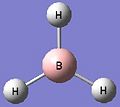
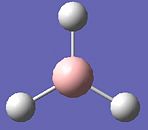
Borane was drawn out on Gaussview and the bond lengths set to 1.5 Å before the molecule was optimised to its lowest energy using Gaussian. The method used was DFT-B3LYP which determines the type of approximations that are made in solving the Schrödinger equation. The basis set determines the accuracy and was 3-21G in this case has a low accuracy but allows the calculations to be quick. The optimised BH3 structure can be seen in Figure 1.
During the optimisation process, Gaussview scans the potential energy surface of borane to find the lowest energy geometry and the root mean squared gradient as can be seen in Figure 2. The RMS graph shows the average deviation from the ideal bond length with each optimisation and terminates at the optimum; in this case zero.

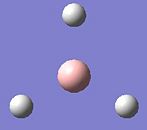
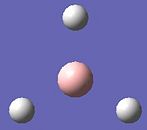
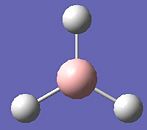
Graphically, the calculation simulates the molecule via the 3-21G basis set. The initial structure is altered to counteract any imbalance in attractive or repulsive forces resulting in a more stable geometry. Each successive optimisation reduces the energy of the molecule and the gradient approaches zero, as can be seen in the final optimization step in the RMS graph. The B-H bond lengths post-optimisation were found to be 1.19 Å and the bond angles were 120o. The energies and geometries of each optimisation can be seen in Figure 3.
 |
 |
 |
 |
 |
Molecular Orbital Analysis
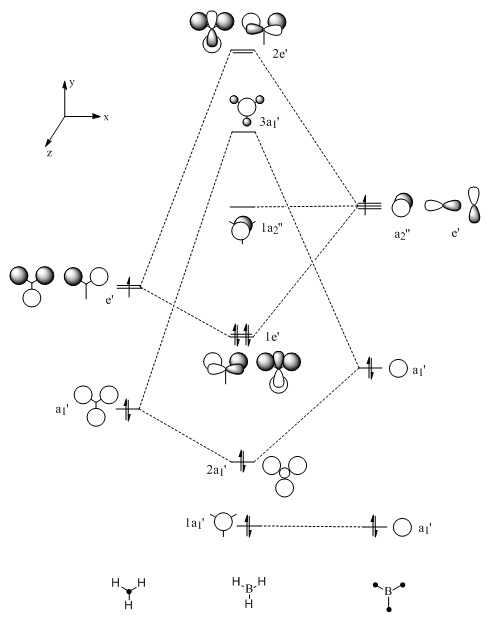
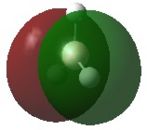
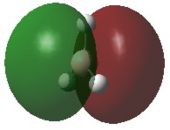
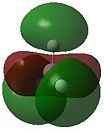
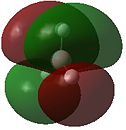
The optimised structure of borane can be used to calculate the MO's[1] using Gaussian as seen in Figures 4 and 5 below:
 |
 |
 |
 |
 |
 |
 |
 |
| Molecular Orbital | Energy/Hartrees |
|---|---|
| HOMO-3 | -6.766 |
| HOMO-2 | -0.515 |
| HOMO-1 | -0.352 |
| HOMO | -0.352 |
| LUMO | -0.068 |
| LUMO+1 | 0.165 |
| LUMO+2 | 0.179 |
| LUMO+3 | 0.179 |
Comparison of the above molecular orbitals shows a good correlation between those obtained via computational methods and the qualitative LCAO molecular orbitals. Overall, the 2s and 2p orbitals of boron interact well with the 1s orbitals of hydrogen giving rise to the expected shape of the orbitals. Blending occurs across the molecule in the computerised MOs making it easier to imagine how the molecular orbital would look compared to the LCAO depiction.
This method shows some limitations in that the two highest anti-bonding orbitals are interchangeable. This can be explained by considering the energies of the individual molecular orbitals as shown in Table 1. As expected, the degenerate orbitals have exactly the same energies. It can also be noted that the energies of the orbitals increase as suggested by the MO diagram with a fairly significant energy gap between each of the orbitals. However, this is not the case with the two highest anti-bonding orbitals where the difference is only 0.014 Hartrees. Therefore, the ability of the orbitals to interchange can be attributed to the small energy difference.
One final method that can be used to determine the order of the two highest anti-bonding orbitals is consideration of the interactions between the various s and p orbitals. The s-s interactions shown in 3a1' will be more stable than the degenerate s-p interactions shown in 2e' due to the overlap of the various orbitals. This means the 3a1' anti-bonding orbitals will be lower in energy than the 2e' anti-bonding orbitals as drawn in Figure 4 above.
Natural Bond Orbital Analysis

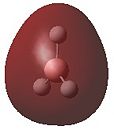
A natural bond orbital analysis was carried out to determine the contribution from each atom to the bond. The analysis was carried out using Gaussview and the charge distribution over the molecule was assigned as shown by the coloured distributions in Figure 6 where green indicates highly positive charge and red highly negative charge. The colours make it difficult to see the numerical charge distribution on the boron and hydrogen atoms which were found to be 0.331 and -0.110 respectively. As expected, Figure 6 shows the Lewis deficient boron to be highly positively charged.
Gaussview only provides a graphical interface on which the atomic charges can be viewed but does not give any specific information regarding the NBO analysis. In this situation, the log file can be viewed to give a further insight into the analysis.The information of interest in the log file can be seen in Figure 7 and shows the type of bonding found in the compound.
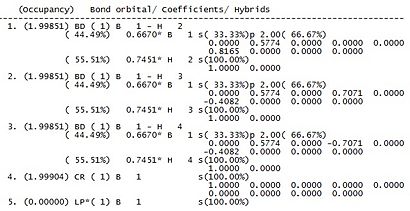
It can be seen that for each boron hydrogen bond, the boron contributes 44.49% of the electron density and the hydrogen contributes 55.51%. The boron contribution is split into contributions of one third from the 2s orbital and two thirds from the 2p orbital, whereas the contribution to hydrogen is 100% s. The splitting of electron density of boron indicates sp3 hybridization. The last orbital on the list corresponds to the formally occupied boron lone pair which could explain the Lewis acidic properties of boron.
Any secondary orbital interactions could also be found within the log file under the section 'Second Order Perturbation Theory Analysis of Fock Matrix in NBO Basis'. These would show interactions from bonding NBOs into non-bonding or anti-bonding orbitals. For the case of borane, no such interactions are present.
Vibrational Analysis
The fully optimised structure was used to carry out a frequency analysis to ensure that the optimisation had indeed resulted in the lowest energy conformation possible. This involves taking the second derivative of the potential energy surface. The results obtained are indicative of the structure of the product; all positive values indicate a minimum point, a negative value for one frequency shows the formation of a transition state and more than one negative frequency signifies an incorrect outcome as the critical point has not been found and so the optimisation has not been successful. The resulting vibrations can be seen in Table 1 below.
| Vibration | Description | Frequency/cm-1 | Intensity | Symmetry D3h Point Group | |||
|---|---|---|---|---|---|---|---|
|
Wag - Simultaneous movement of hydrogens perpendicular to the σh plane | 1146 | 93 | A2' | |||
|
Scissor - motion of two hydrogen atoms towards each other in the σh plane | 1205 | 12 | E' | |||
|
Rock - a scissoring motion of two hydrogen atoms and a rocking of the third | 1205 | 12 | E' | |||
|
Symmetric Stretch | 2593 | 0 | A1' | |||
|
Asymmetric Stretch | 2731 | 104 | E' | |||
|
Asymmetric Stretch | 2731 | 104 | E' |
All values in Table 1 have been rounded to the closest whole number to account for any inaccuracies involved in modelling anharmonic vibrations with a harmonic approximation. It is also noteworthy that all the frequency values are positive indicating a successful optimisation has taken place. The IR spectrum for borane was calculated using the vibrations option found on Gaussview and can be seen in Figure 8 below.
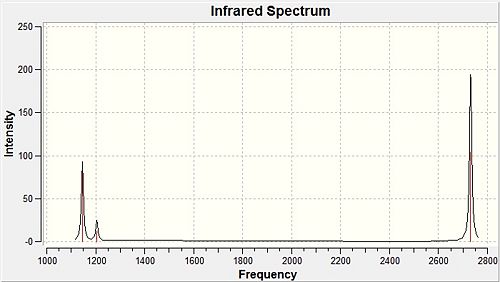
The molecule was found to have six vibrations as expected from the 3n-6 rule for non-linear molecules but only three peaks are found on the spectrum. These occur at frequencies of 1146, 1205 and 2731 cm-1 (to the closest whole number). The difference in the observed vibrations present in the spectrum and those shown in Table 1 can be explained by looking at the vibrations present in the molecule. The totally symmetric A'1 vibration has no overall change in dipole moment and is therefore invisible in the spectrum, hence the assigned intensity of 0 cm-1. The remainder of the peaks can be condensed to the three peaks observed by considering the degeneracy of the two E' orbitals and the singularly degenerate A2' vibration. The highest frequency vibrations will require the most energy for the vibration to occur, namely the asymmetric stretches which can be seen at 2731.31 cm-1. The lowest intensity peak results from the wagging motion and is present at 1145.71 cm-1 leaving the final peak as the degenerate rock and scissor motions.
Thallium Bromide
Optimization
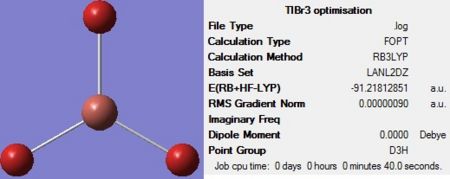
Thallium bromide was drawn in Gaussview and its symmetry was set, and tightly confined,to the D3h point group to prevent the from straying from this symmetry. Similar calculations were carried out on the thallium bromide as those performed on borane, however a pseudo potential basis set was required to account for the significantly larger thallium and bromine atoms relative to the boron and hydrogen atoms.
The 321-G basis set used for BH3 is not suitable for this calculation as it considers each of the electrons in the molecule. This is fine for smaller molecules but would be too lengthy and expensive for the larger molecule TlBr3. The pseudo potential used in this calculation doesn't explicitly calculate the core potential and only considers the electrons that would take part in bonding, namely the valence electrons. This decreases the amount of time required for the simulation and as a result decreases the cost, but still yields an accurate enough optimisation. The geometry was optimised using the DFT-B3LYP method and the LanL2DZ basis set(a medium level basis set which uses D95V on first row atoms and Los Alamos ECP on heavier atoms)and can be seen along with the summary in Figure 9 below:
Vibrational Analysis
Thallium Bromide Vibrational Analysis
To ensure a minimum optimisation had been reached, a vibrational analysis was carried out using the same method and basis set, allowing the two to be compared. The segment of the output file shown in Figure 10 shows two lines labelled 'Low frequencies'. The first of these corresponds to the six degrees of freedom accessible to the molecule; three in the x, y and z planes and the other three resulting from rotation about these planes. In the ideal case, these six values would be zero but due to noise and inaccuracies in the calculations, the values found are not exactly zero. The second line, also labelled 'Low frequencies', is indicative of the 'real frequencies' shown by the molecule. All these values are positive indicating that a minimisation has taken place.

The optimised structure has a Tl-Br bond distance of 2.65 Å and a Br-Tl-Br bond angle of 120o which compares well to the literature value[2] of 2.52 Å and 120o. A better result could have been obtained if a more accurate basis set were used.
During optimisation, the structure of a molecule will be significantly altered. Gaussview contains an internal list of bond distances, mainly signifying those present in organic complexes. Bonds between atoms in inorganic complexes are generally longer than those present in organic complexes and if the bond falls outside those identified by Gaussview, the program will not insert a bond (as seen in Figure 3). This implies that Gaussview considers bonds differently to what a bond would usually be defined as. The most simple definition of a bond is an attraction of opposing charges between two or more atoms with a significant enough attraction which results in the formation of a compound.
Stereoisomers of [Mo(CO)4(PPh3)2]
Introduction
This part of the investigation looks into the thermal stability and spectral characteristics of the stereoisomers of [Mo(CO)4(PPh3)2]. However, the triphenyl phosphine ligands are large and it would be too expensive in terms of computational resources to run the molecule as it is. As a result, the phenyl rings were replaced with chlorine atoms as they are also quite bulky and have been shown to have a similar contribution to the bonding but are less expensive to run. The altered cis and trans molybdenum isomers were initially optimised in order to determine which of the isomers is more stable. This was followed by a frequency analysis to confirm that the optimised structures were indeed the most stable conformers possible. The frequency analysis was also used to determine the number of carbonyl vibrational bands found within each complex. Different numbers of bands are expected for each complex, four for the cis and one for the trans, so this expectation was explored using computational methods.
Optimization
The optimisation of both complexes was performed in two stages to ensure the most accurate results were obtained. The first optimisation was carried out using the B3LYP method and a low level basis set of LANL2MB in order to obtain a rough optimisation. In the additional keywords section, ‘opt=loose’ was inserted, to prevent the convergence criteria being more accurate than the method. The structure of each molecule, along with the summary, can be seen in Figure 11 and Figure 12 below:
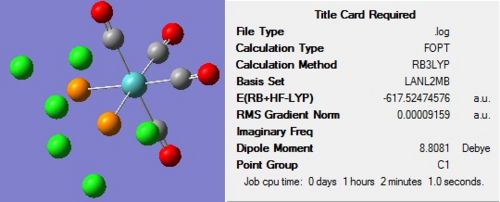
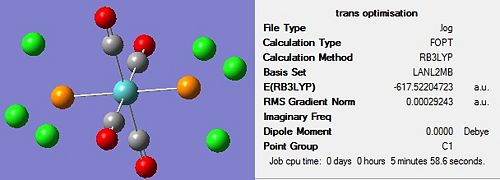
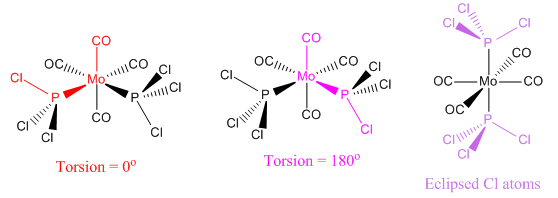
On completion of the initial optimization for both isomers, it was noticed that the bonds between the phosphorous and chlorine atoms had disappeared. This was attributed to the factors discussed earlier, namely that the bond distance was outside that recognised by Gaussview, hence the bonds were ignored. These bonds were redrawn and other changes were made to each of the isomers before the second optimization was carried out. For the cis conformer, one phosphorous-chlorine bond was placed axial to the molybdenum-carbonyl bond while another phosphorous-chlorine bond on a different phosphorous group was made to point down. This gave a torsion angle of 0o for the synperiplanar bond and 180o for the antiperiplanar bond. In the trans conformer, the PCl3 groups were orientated to be eclipsed and it was ensured that one chlorine of each group lay parallel to a molybdenum-carbon bond. The altered structures can be seen in Figure 13 below:
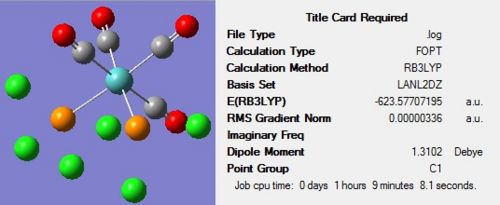
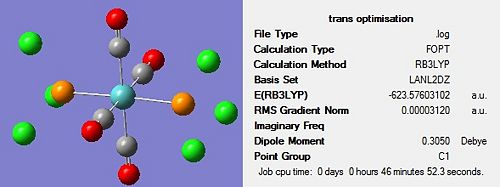
The second optimization was then conducted on these adjusted structures using the B3LYP method and the more accurate LANL2DZ pseudo-potential and basis set. In addition to this, ‘int=ultrafine scf=conver=9’ was inserted into the additional keywords section in order to impose tighter convergence criteria. The resulting isomers can be seen in Figure 14 and Figure 15 below:
| Isomer | Optimisation 1 Energy/a.u. | Optimisation 2 Energy/a.u. |
|---|---|---|
| cis | - 617.525 | -623.577 |
| trans | - 617.522 | -623.576 |
Comparison of the optimised energies shown in the summaries for each of the molecules above has been reproduced in Table 3 for easy comparison. It can be seen that after the initial optimisation the cis isomer has a slightly lower energy compared to the trans isomer. This remains the case after the second optimisation and the difference in energy between the two isomers was calculated to be 2.73 kJ mol-1. The calculated value is significantly smaller than that quoted in literature of 72.98 kJ mol-1 but it must be noted that the literature value corresponds to triphenyl phosphine ligands whereas the calculated value is for PCl3 ligands. Therefore, the difference between the reported and calculated values can be attributed to the difference in size between the two different ligands.
Within Gaussview, various geometric parameters can be calculated. Here, the molybdenum-phosphorous bond length and the P-Mo-P bond angles have been calculated. It was found that the molybdenum-phosphorous bond was shorter in the trans isomer compared to the cis; 2.44 Å (literature [3]: 2.50 Å) compared to 2.51 Å (literature [3]: 2.58 Å). The difference between the literature value and computed value can be accounted for by the fact that the literature values refer to the [Mo(CO)4(PPh3)2] complex whereas the computed values are for [Mo(CO)4(PCl3)2]. The difference between the cis and trans bond lengths could result from possible reorientation to remove repulsive interactions between the two adjacent PCl3 groups in the cis isomer.
The P-Mo-P angle for the trans complex was calculated to be 177.4o (literature[3]: 180o) and for the cis complex was 84.2o (literature[3]: 104.6o). Again, the difference between the literature values and calculated values can be attributed to the fact that two different compounds are being compared. The bulkier triphenylphosphine ligands will have a greater repulsion between the groups in the cis isomer and will therefore want a larger angle to obtain a lower energy for the geometry. The fact that less hindered chlorine atoms have been used could be the reason for the difference observed in this case. The difference observed for the trans isomers is smaller but could also occur for this same reason.
Frequency Analysis
Before any further analysis was carried out on the structures, a frequency analysis was conducted to ensure both optimised geometries obtained were in fact minima. All the calculated frequencies were positive allowing analysis on the obtained structures as they were found to be minima. Table 4 shows some of the calculated frequencies, namely those corresponding to any low frequencies.
| Cis Isomer Log File | Trans Isomer Log File | ||||||||||
|---|---|---|---|---|---|---|---|---|---|---|---|
| Vibration | Frequency/cm-1 | Intensity | Vibration | Frequency/cm-1 | Intensity | ||||||
|
11 | 0.03 |
|
5 | 0.10 | ||||||
|
18 | 0.01 |
|
6 | 0.00 | ||||||
The data contained within Table 4 shows that the low frequency vibrations are rotations of the chlorine atoms around the phosphorous atoms. Thermal energy at room temperature is approximately equal to the Boltzmann constant multiplied by room temperature which gives an approximate energy of 2.5 kJ mol-1. This corresponds to a frequency of 207 cm-1 indicating that the vibrations above could easily occur at room temperature as implied by the low intensities.
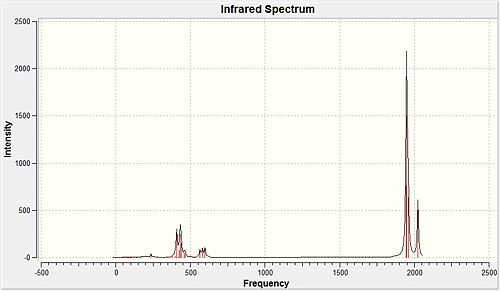
Table 5 below shows stretching frequencies relating to the carbonyl compounds followed by the IR spectra for the cis and trans molybdenum complexes.
| Cis isomer | Trans isomer | ||||||||
|---|---|---|---|---|---|---|---|---|---|
| Frequency cm-1 | Intensity | Literature Frequency - Mo(CO)4PCl3[4] | Literature Frequency - Mo(CO)4PPh3[5] | Symmetry | Frequency cm-1 | Intensity | Literature Frequency - Mo(CO)4PCl3[4] | Literature Frequency - Mo(CO)4PPh3[5] | Symmetry |
| 1945 | 736.0 | 1986 | 1897 | B2 | 1950 | 1475.4 | 1896 | 1902 | EU |
| 1949 | 1498.2 | 1994 | 1908 | B1 | 1951 | 1466.8 | 1896 | 1908 | EU |
| 1958 | 632.7 | 2004 | 1927 | A1 | 1977 | 0.6 | - | - | B1g |
| 2023 | 598.0 | 2072 | 2023 | A1 | 2031 | 3.8 | - | - | A1g |
 |
 |
Looking at Table 5, it can be seen that the calculated values and the literature values show a relatively significant difference of approximately 50 cm-1. This is an error associated with the calculation carried out in Gaussview and can be attributed to the fact that the vibrations are treated harmonically when in fact they are anharmonic functions. It is assumed that this error is approximately 10%.
The literature shows the cis isomer to have four stretches relating to the carbonyl bonds and the trans isomer to have only two. This results from the difference in symmetry between the two different geometries where the cis is C2v and the trans is D4h. In the calculated spectra, four peaks are seen for the cis isomer as expected but four frequencies are also observed for the trans complex. It is worth noting that the symmetry of the trans isomer means two of the carbonyl stretches will be degenerate as shown for the frequencies centred at approximately 1950 cm-1 but in the cis isomer, these two stretches are not chemically equivalent so will result in two individual frequencies.
The difference between the expected number of frequencies and the calculated frequencies found in the trans isomer can be explained by once again considering the symmetry of the molecule. The relaxed symmetry in the optimised geometry could be the result of the additional bands, albeit with low intensity, which would not be expected in the IR spectrum.
Mini Project
Introduction
This mini project is an investigation into the structures and properties of benzene and three of its substituted derivatives. The substituents of choice were Cl, F and BH2. Although BH2 is not a common addition to a benzene ring, it was interesting to see the results of the various simulations and how an electropositive atom affects the benzene ring in contrast to the two electronegative halogen atoms.
Initially the benzene molecule had all six hydrogen atoms replaced by the substituent but this was found to be too time-consuming a calculation. It was then thought that having one hydrogen replaced would be a better option but this would make the molecule antisymmetric and would therefore make the computational simulations more complicated. As a result, the molecules investigated had alternating hydrogen atoms replaced with the substituent in order to maintain the symmetry yet reduce the time required to run the calculations.
The investigation aims to use some of the methods discussed above in order to initially optimize the geometry of the molecule and confirm this is the correct orientation. The optimized molecules will then be used to look at the frequency of some stretching modes, molecular orbitals and how charges are spread throughout the molecule.
Optimization
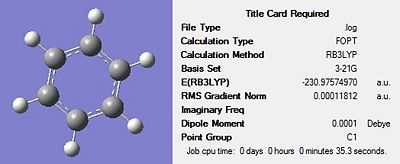
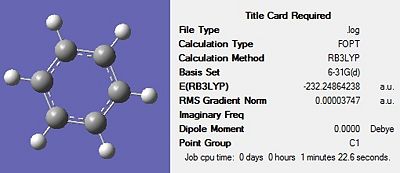
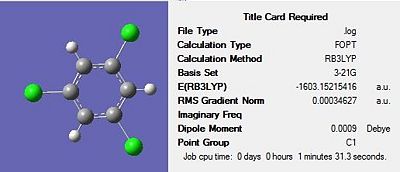
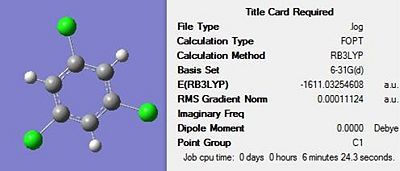
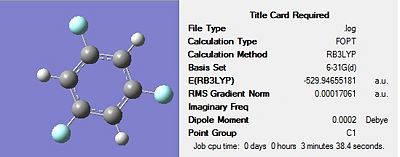
Firstly, all four molecules were drawn in Gaussview and optimised using the DFT-B3LYP method and the 3-21G basis set in order to get a rough optimization of each of the molecules. In the additional keywords box, ‘opt=loose’ was inserted to reduce the accuracy of the convergence criteria to match that of the method. The use of a rough optimization is useful in reducing the computational time needed for further optimizations, therefore reducing cost. A second optimization was then carried out on the product of the initial optimisation. This second optimisation used a more accurate basis set in order to yield a better optimized geometry. The method used was once again DFT-B3LYP and the basis set used was 6-31G(d) were the d allows for diffuse orbitals or electronic states yielding a better representation of the molecule. The results of each optimisation for the four structures can be seen in Figures 17-20 below. The summary for the final optimisation step has also been included.
 |
 |
 |
 |
 |
 |
 |
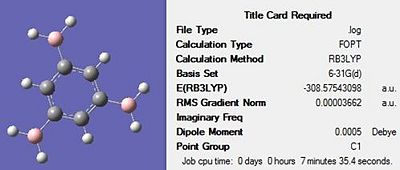 |
The summary shows that the second optimization further reduces the energy of the molecule, with the largest stabilisation occurring for 1,3,5-trichloro benzene. The output files were checked to ensure the forces had fully converged, before a frequency analysis was carried out.
Frequency Analysis
A frequency analysis was carried out in order to ensure that all the optimisations had been successful in yielding a minimum. This was found to be the case as all the frequencies were positive values. When comparing the frequencies for all four molecules, it was thought that those relating to either carbon-carbon bonds, or the benzene rings would be most useful in showing how substituting the hydrogen atoms affects the molecule. However, in practise it was found that this was not feasible as more and different modes appeared for each of the different atoms making comparison difficult. It was found that the ring breathing mode only had one frequency which changed depending on the substituent added so this frequency has been investigated further. Table 6 below shows the different ring breathing modes for each of the molecules.
| Molecule | Vibration | Frequency/cm-1 | Intensity | |||
|---|---|---|---|---|---|---|
| C6H6 Log File |
|
1021 | 0.00 | |||
| C6H3Cl3 Log File |
|
1011 | 0.00 | |||
| C6H3F3 Log File |
|
1026 | 0.05 | |||
| C6H3(BH2)3 Log File |
|
1012 | 0.00 |
The first point to note on comparison of the four different ring breathing modes is how the addition of a substituent inhibits the motion of the ring. In each of the three substituted rings only three of the carbons are now 'breathing', compared to all six in benzene. This can be explained by considering the link between the frequency, reduced mass and rate constant as shown in the equation:
Where is the frequency, k is the force constant and m is the reduced mass. Consideration of the reduced mass can help explain the difference in the frequencies and why three of the carbon atoms remain 'stationary'. Benzene has the smallest reduced mass and the largest force constant which means it will have the largest frequency as observed.
A second key point is that the intensities are all 0 or very close to 0. This confirms that the molecule is symmetric and implies there is no overall change in dipole moment during the vibration. As a result, the peak would not show up on the IR spectrum.
Bond Lengths
| Bond Length/Å | |||||||
|---|---|---|---|---|---|---|---|
| Bond | C6H6 | Literature - C6H6 | C6H3Cl3 | Literature[6] - C6H3Cl3 | C6H3F3 | Literature[6] - C6H3F3 | C6H3(BH2)3 |
| C-X | - | - | 1.75 | 1.73 | 1.35 | 1.34 | 1.54 |
| C-H | 1.09 | 1.08 | 1.08 | 1.09 | 1.08 | 1.07 | 1.09 |
| C-C | 1.39 | 1.39 | 1.39 | 1.39 | 1.39 | 1.39 | 1.41 |
To ensure the calculated optimised molecules were reasonable, the bond lengths were investigated as shown in Table 7. Literature values were found for the comparison of the calculated values of benzene, the substituted chloro derivative and the substituted fluoro derivative. However, the BH2 substituted derivative is not a common molecule and as such, literature data could not be found.
All the calculated values correspond well to those in literature indicating the most stable structure has been produced. Starting with the carbon-carbon bond, it can be seen that changing the hydrogen atom to a more electronegative substituent has no impact on the length. However, when hydrogen is replaced with the more electropositive boron based group, the length of the carbon-carbon bonds within the ring increases. This can be explained by considering the interactions between the electrons on the boron and the π* orbitals of the benzene ring. Donation of electrons into the π* orbital decreases the energy of the π bond which causes a lengthening of the bond. Another factor that could result in the lengthening of the bond is the size of the bulky BH2 group. Larger, bulkier groups will not be able to get as close to the ring compared to a smaller group due to steric interactions. This means the carbon-boron bond will naturally be longer but the carbon-carbon bonds within the ring could also increase in length in order to minimise the steric repulsion between the three bulky groups.
It is also interesting to note that when the hydrogen atoms are changed to the more electronegative chlorine of fluorine atoms, there is no change in the carbon-carbon bond length. This contradicts prior expectations, that electronegative atoms will withdraw electron density from the ring thereby weakening the bonds and increasing the bond length. However, fluorine is also a very good π donor, so the decrease in bond length relative to hydrogen could be explained by taking this into account. This is one of the many advantages of computational chemistry; molecular simulations are far superior to the simpler models that may be taught making them very useful for synthetic chemists.
The calculated values for the carbon-hydrogen bonds in the chloro and fluoro substituted complexes were calculated to be identical. However, in literature there is a slight difference. This could be explained by again considering the electronegativity of the substituents. Fluorine is more electronegative than chlorine so will extract more electron density from the ring. This in turn will result in a contraction of the hydrogen atoms around the ring resulting in a decrease in bond length relative to both hydrogen and chlorine. The same phenomenon will occur for chlorine but to a lesser effect.
MO Analysis
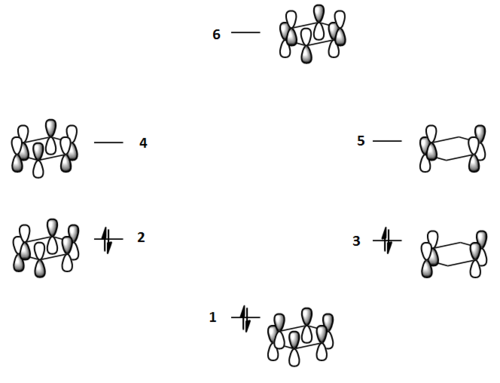
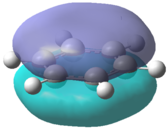
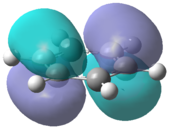
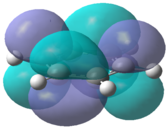
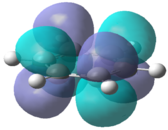
The molecular orbitals for each of the four molecules were calculated using the same method and basis set as the final optimisation. Full NBO was selected under the NBO tab and the additional keywords 'pop=full' were also inserted. Figure 21 below shows the MO diagram for benzene followed by the computed MO's for comparison.
 |
 |
 |
 |
 |
 |
| Molecular Orbital | C6H6/a.u. | C6H3Cl3/a.u. | C6H3F3/a.u. | C6H3(BH2)3/a.u. |
|---|---|---|---|---|
| HOMO-2 | -0.359 | -0.318 | -0.353 | -0.387 |
| HOMO-1 | -0.246 | -0.266 | -0.260 | -0.284 |
| HOMO | -0.246 | -0.266 | -0.260 | -0.284 |
| LUMO | -0.003 | -0.038 | -0.013 | 0.043 |
| LUMO+1 | -0.003 | -0.038 | -0.013 | 0.043 |
| LUMO+2 | 0.163 | 0.114 | 0.149 | 0.154 |
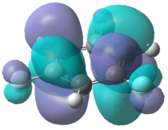
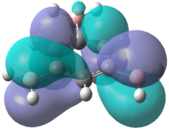
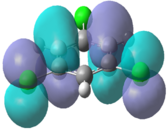
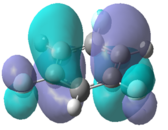
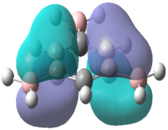
The computed benzene molecular orbitals correspond well to the qualitative LCAO picture. Blending can be observed between in-phase orbitals which is significantly noticed in the HOMO-2 where there are no nodes present. Table 8 shows the energies for the corresponding orbitals for the three other benzene derivatives. It was found that the orbitals contained within the benzene ring in each of the molecules corresponded well to the unsubstituted benzene ring. Looking at the information contained within the table, it can be seen that benzene itself has the largest spread in energy between the HOMO-2 and the LUMO+2. The tri-chloro derivative has the highest energy HOMO-2 whereas the BH2 derivative has the lowest energy HOMO-2. It is also important to note that the BH2 substituted ring has the highest energy LUMO and also the largest HOMO-LUMO gap whereas the tri-chloro substituted ring has the smallest HOMO-LUMO gap.
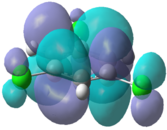
Table 9 below contains the computed molecular orbitals for each of the molecules alongside benzene for comparison.
| C6H6[7] | C6H3Cl3[8] | C6H3F3[9] | C6H3(BH2)3[10] | |
|---|---|---|---|---|
| LUMO |  |
 |
 |
|
| HOMO |  |
 |
 |
|
In the chloro and fluoro substituted rings, there is an additional node present in both the HOMO and LUMO resulting from additional electron density found on the electronegative atom. This is not the case for the BH2 group where the interaction is in-phase so blending of the molecular orbitals occurs.
NBO Analysis
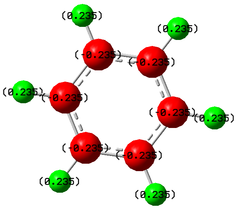
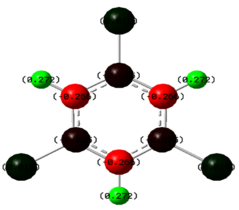
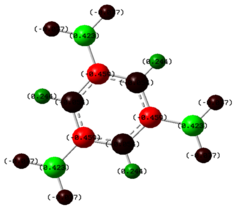
An NBO analysis was also carried out to see how altering the substituents affects the charge density throughout the molecule. As mentioned before, green indicates high positive charge and red indicates high negative charge.
| C6H6 | C6H3Cl3 | C6H3F3 | C6H3(BH2)3 |
|---|---|---|---|
 |
 |
 |
|
| Bond | C6H3Cl3 | C6H3(BH2)3 |
|---|---|---|
| C-Cl Carbon | -0.025 | - |
| C-Cl Chlorine | 0.019 | - |
| C-H Carbon | - | -0.054 |
| B-H Hydrogen | - | -0.077 |
As can be seen, some of the atoms within the C6H3Cl3 and C6H3(BH2)3 molecules only have a small charge, making it difficult to see the charge numbers. As such, the charge numbers for the highly charged atoms within these two rings have been reproduced in Table 11. As expected for benzene, the carbon ring is negatively charged due to the delocalised electrons present resulting in the hydrogen atoms being positively charged. As the substituents are changed, the charges throughout the molecule also change but not necessarily in the way that would be expected. For the chlorine substituted derivative, the three carbon atoms attached to the chlorine are very dark red, almost black indicating a low negative charge. The chlorine atoms are very dark green, again almost black in colour indicating a small positive charge. This agrees with expectation in terms of the carbon, in that the chlorine atom is electronegative and so electron density will be attracted towards the chlorine leaving the carbon atom more positively charged. However, for the chlorine, it would be expected that it would be more negatively charged due to the increased electron density but this is not the case.
The fluorine substituted derivative does follow what would be expected. The carbon atoms around the ring that are not attached to fluorine atoms maintain their negative charge, while those attached to electronegative atoms become positively charged due to withdrawal of electron density by fluorine. The fluorine atoms, in turn, are more negatively charged due to the increase in electron density.
Finally, for the BH2 substituted derivative there is no clear indication of what to expect. As mentioned before, boron is Lewis deficient so should come out bright green as observed. The hydrogen atoms attached to the boron along with the carbon atoms in the ring attached to hydrogen atoms all have a small negative charge. This can be explained by considering the electropositive effects of boron which will contribute electron density among these atoms resulting in the charge observed.
Conclusion
Overall this investigation has been useful in showing how computational chemistry can be used in a synthetic sense to predict the structures and properties of various molecules. Even though there have been some discrepancies with the expected outcome and what was actually obtained, the general concensus shows that electronegative and electropositive atoms have quite a significant impact on the properties of a benzene ring.
Further investigations could be carried out to test the impact of a well known substituent that exhibits some electropositive character, for example the methyl group. This could be useful to compare to the BH2 derivative as it is not as well known but due to time constraints this was not carried out for this particular task.
References
- ↑ Computed MO Data for Borane [1]
- ↑ J. Blixt, J. Glaser, J. Mink, I. Persson, P. Persson and M. Sandtroem, J. Am. Chem. Soc., 1995, 117 (18), pp 5089-5104
- ↑ 3.0 3.1 3.2 3.3 G. Hogarth, T. Norman, Inorganica Chimica Acta, 1997, 254, 167-171
- ↑ 4.0 4.1 ELmer C. Alyea and Shuquan Song, Inorg. Chem., 1995, 34, 3864-3873
- ↑ 5.0 5.1 D. J. Darensbourg and R. L. Kemp, Inorg. Chem, 1978, 17, 2680.
- ↑ 6.0 6.1 A. Almenningen, I. Hargittai, J. Brunvoll, A. Domenicano, S. Samidal, Journal of Molecular Structure, 1984, 116, 199-206
- ↑ Computed MO Data for C6H6 [2]
- ↑ Computed MO Data for C6H3Cl3 [3]
- ↑ Computed MO Data for C6H3F3 [4]
- ↑ Computed MO Data for C6H3(BH2)3 [5]
