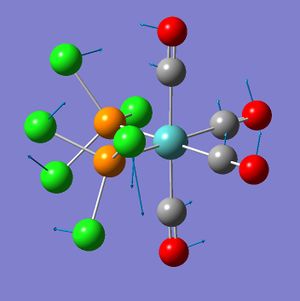
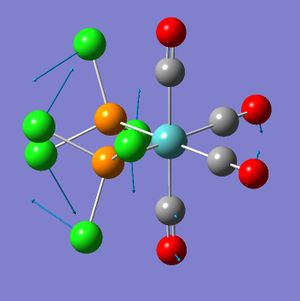
Rep:Mod2:nathanmarch
The following is a summary of work carried out using ChemBio3D Ultra 12.0, Gaussian 09W and GaussView 5.0.8c, Imperial College Chemistry Department - 3rd Year Computational Labs.
Conventions:
- Parentheses enclosing the final digits of a number indicate that the calculated figure has expressed digits that are beyond the accuracy of the method to ascertain i.e. an output bond length of 1.23456 Å will only be accurate to 0.01 Å and the figure will be written as 1.23(456)Å.
- 1 Hartree unit (Eh) = 2625.5 kJ mol-1
Module 2
Analysis of a Molecule of BH3
Optimization of the Geometry
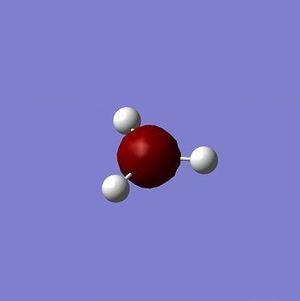
A BH3 molecule was drawn in GaussView and the B-H bonds were modified to measure 1.5 Å. The following geometry optimization was executed, a DFT-B3LYP/3-21G calculation:
# opt b3lyp/3-21g geom=connectivity

BH3 optimization

0 1
- Log file: NM607_BH3_OPT.LOG
- Results summary: Nm607_BH3_opt_results_summary.txt
The B-H bond lengths, post-optimization, were all 1.19(349) Å and all H-B-H bond angles were 120.0°. Analysis of the optimization results yields the following graphs:
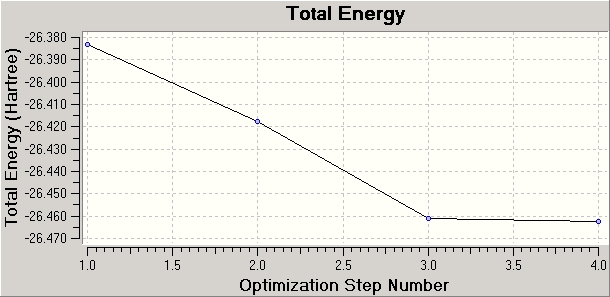
Nm607_BH3_opt_energy_plot_data.txt
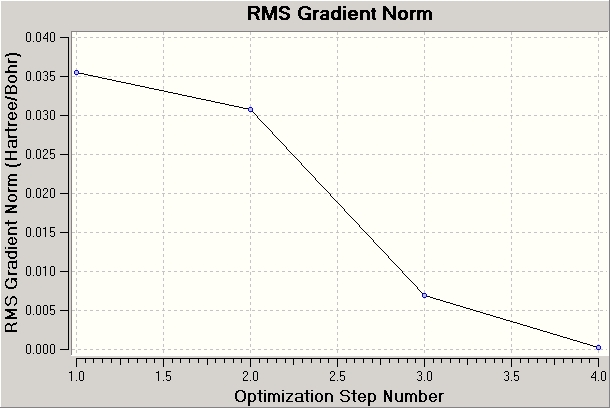
Nm607_BH3_opt_RMS_plot_data.txt
The calculation aims to best simulate the molecule via the assigned basis set. The starting structure is analysed to determine any imbalance between attractive and repulsive forces, and the structure is modified accordingly. As each geometry is optimized the energy gap between successive optimizations reduces, and the gradient (the rate or change of energy with respect to the number of iterations) approaches 0. Once the RMS gradient is within a specific tolerance of 0 (say less than 0.001) the calculation terminates. The calculation could continue, but would be subject to the law of diminishing returns. A smaller tolerance is preferable when the analysis is particularly sensitive to small differences in energy.
Calculation of the Molecular and Natural Bond Orbitals
Via the .chk file from the optimization, a further calculation was run on the optimized BH3 molecule: a full NBO analysis (additional keywords: pop=full), this time with the 6-31G basis set to improve the accuracy [THIS WAS A MISTAKE: it was later realised that mixing basis sets produces invalid results. This was noticed when the NBO analysis produced a radically low-energy s-orbital than would be expected and altered the occupancy - this section was repeated up to the NBO analysis using the 3-21G basis set].
# b3lyp/3-21g pop=(nbo,full) geom=connectivity

BH3 MO analysis

0 1
- Log file: NM607_BH3_POP.LOG
- Results summary: Nm607_BH3_pop_results_summary.txt
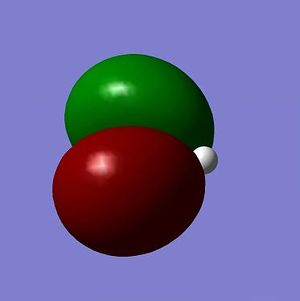
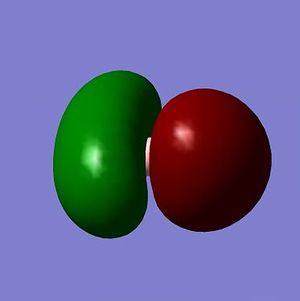
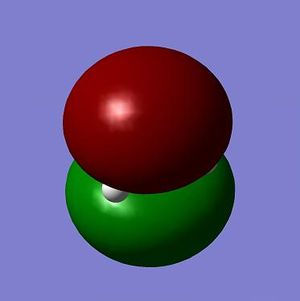
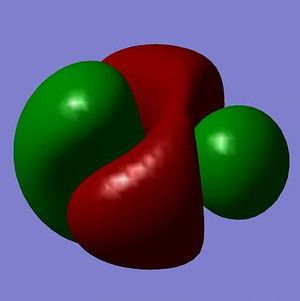
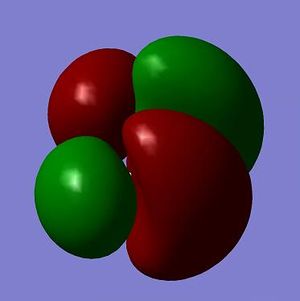
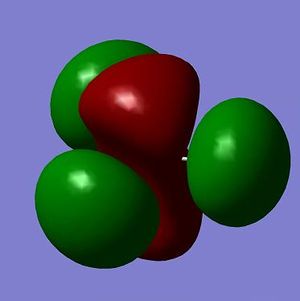
The MOs from the calculation above are displayed below, up to MO 8.
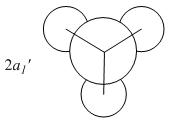
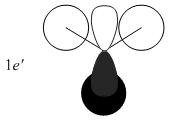
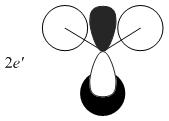
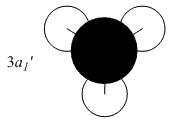
The MOs compare well with the LCAO approach:
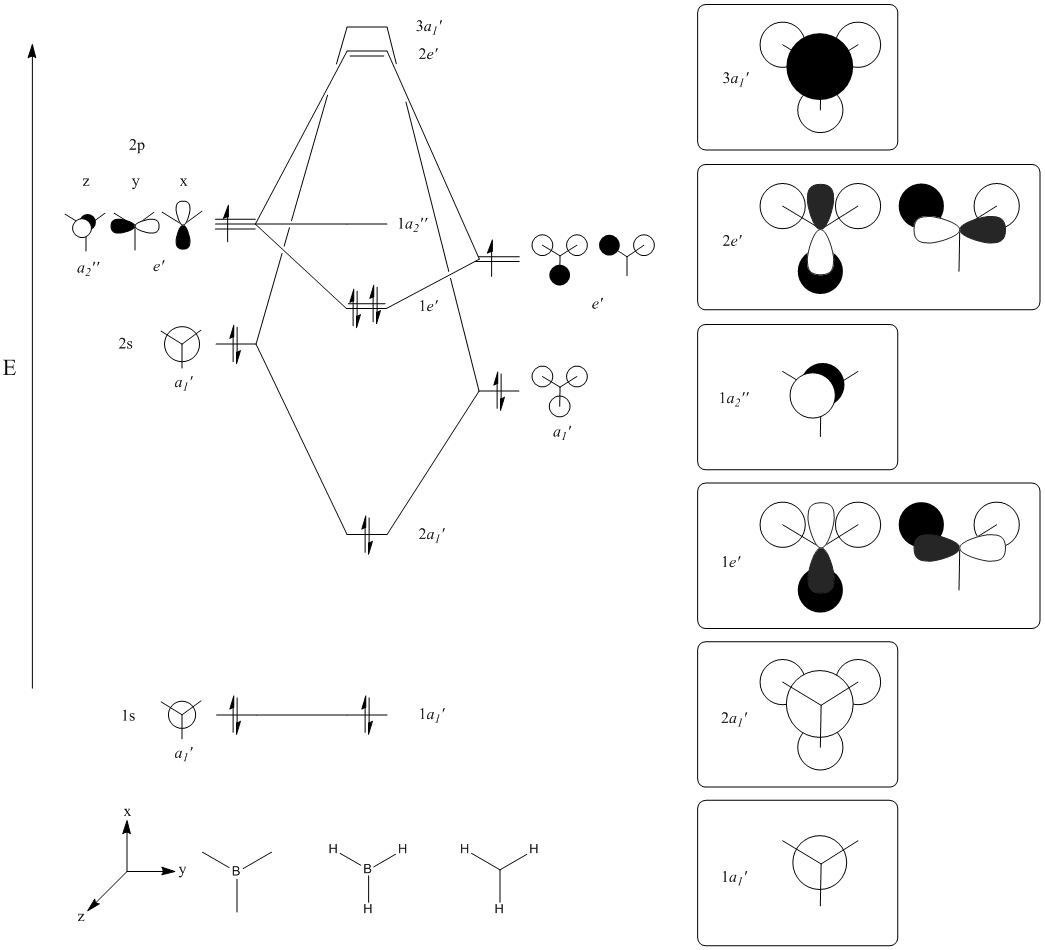
Each computed MO, up to MO 8, corresponds directly to an LCAO MO:
What can be seen from the above is that the 3-21G basis set can yield molecular orbitals that not only square with the LCAO model, but provide more detailed information as to the orbitals' 3D character. While the LCAO approach is valid up until the LUMO+3 the computational method yields MOs up to M0 15 (LUMO+10). In detailed analysis of the excited states of BH3 one would be forced to abandon the LCAO approach in its current form. Computational methods for MO calculation are far more useful when examining the electronic distribution more carefully: trajectories can be rationalized via orbital overlap arguments and MO analysis can provide the precise optimum approach angle (this would be useful in the case of a sterically controlled approach - one would be able to modify ligands etc. to control how a species approaches).
The 2e' and 3a1' energy levels are drawn the way they are in the MO diagram due to the computed MO energies - the ordering of these orbitals is disputable due to the very small energy difference (~0.004 eV). Alternate basis sets might yield the opposite arrangement.
Examining the charge distribution across the molecule of BH3 can be done visually (through assignment of a spectrum of colours coordinated to the degree of positive or negative charge) or numerically (which is less fun, but more definitive):
| Table 2.1.1 - Charge of atoms in a molecule of BH3 | |
|---|---|
| Atom | Charge |
| B | 0.332 |
| H | -0.111 |
The natural bond order calculations can assess the contribution each atom makes to each bond, and which orbitals of that atom are involved.
The log file yields this information, showing that for each B-H bond the boron contributes 44.48% of the electron density and hydrogen 55.52%. For boron's contribution, one-third originates from an s-orbital (2s) and two-thirds from a p-orbital - this is indicative of sp2 hybridization.
There are no significant second order interactions (e.g. σ-conjugative processes) predicted in BH3, but with the same analysis with BCl3 (NM607_BCL3_POP.LOG) is it interesting to note that there are several significant donations from the chlorine lone pairs into the B-Cl bonds. This is actually expressed as a bond between the chlorines and the p-orbital of the boron (see log file) where boron provides only ~. This was done using the same LanL2MB basis set as is used in the next section (and in fact used the output files from that optimization).
Calculation of the Vibrations
To calculate the vibrations of the BH3 molecule the log file from the geometry optimization section was subjected to the following frequency calculation (DFT-B3LYP/3-21G):
# freq b3lyp/3-21g geom=connectivity pop=(full,nbo)

BH3 frequency analysis

0 1
- Log file: NM607_BH3_FREQ.LOG
- Results summary: Nm607_BH3_freq_results_summary.txt
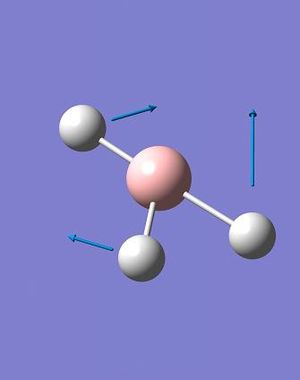
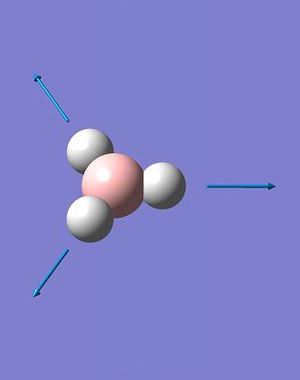
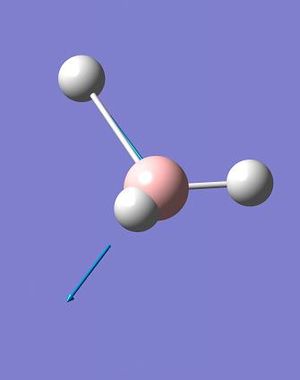
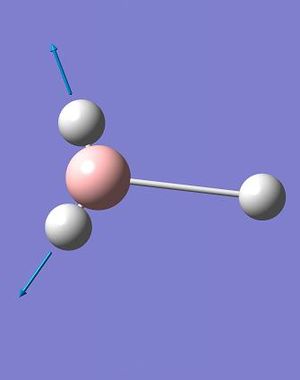
A total of 6 vibrations were determined, and each has a symmetry related to the D3h point group of the BH3 molecule.
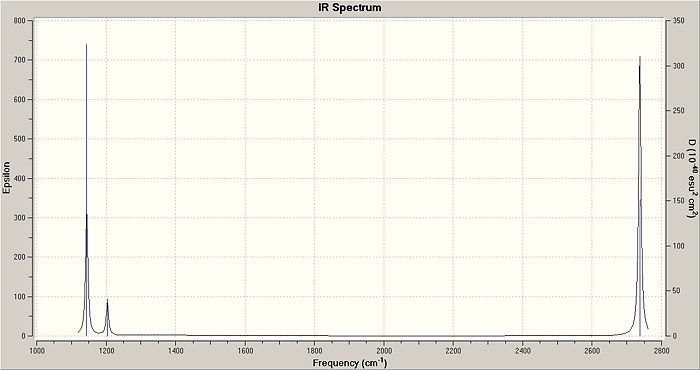
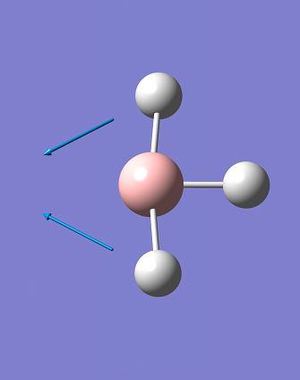
The IR spectrum of BH3 (Fig. 2.1.4) shows only three peaks, at 1144.15, 1203.64 and 2737.44 cm-1. The A1' vibration is completely symmetric, has no change in dipole moment and is invisible on the spectrum; thus the assigned IR intensity of 0.0000. The remaining 5, IR-allowed, vibrations condense to three peaks due to the existence of two doubly-degenerate sets (1203A&B and 2737A&B) and a singularly degenerate vibration (2598). While technically the degenerate pairs are not identical in energy the difference is so small that it can be ignored - it would take an extraordinarily high resolution spectrometer to resolve down to one one-thousandth of a wavenumber.
Analysis of a Molecule of BCl3
Optimization of the Geometry
A molecule of BCl3 was drawn in GaussView, with the B-Cl bond distance defaulting to 1.87 Å. The symmetry of the molecule was constrained, with very tight tolerance (0.0001), to the D3h point group to prevent later problems with the vibrational and MO calculations. The following geometry optimization was executed (DFT-B3LYP/LanL2MB):
# opt b3lyp/lanl2mb geom=connectivity

BCl3 optimization

0 1
- Log file: NM607_BCL3_OPT.LOG
- Results summary:Nm607_BCl3_opt_results_summary.txt
The B-Cl bond lengths, post-optimization, were all 1.86(592) Å, and all H-B-H bond angles were 120.0° as would be expected from the restricted symmetry.
Calculation of the Vibrations
Using the output file from the above, the structure of BCl3 was subjected to frequency analysis, in order to determine whether or not the structure has been fully optimized to a minimum - if this is so the output file should show only positive vibrational frequencies; thus the rationale for using this method. No extra keywords were necessary as MO analysis was not being done. The calculation executed was a frequency analysis via DFT-B3LYP/LanL2MB:
# freq b3lyp/lanl2mb geom=connectivity

BCl3 frequency analysis

0 1
- Log file: NM607_BCL3_FREQ.LOG
- Results summary: Nm607_BCl3_freq_results_summary.txt
The 6 vibrations (214, 214, 377, 417, 939 and 939 cm-1) have the same character and symmetry as those of BH3. They are all positive and therefore the structure is a minimum[1].
Discussion
The ground state of BCl3 is trigonal planar, and has D3h symmetry. This can be gathered from the frequency analysis log file "Framework group D3H[O(B),3C2(Cl)]" - Nm607_BCl3_freq_results_summary.txt. Gaussian identifies the symmetry from the geometric arrangement and is able thereby to assign the symmetry labels.
The basis set used for both the geometry optimization and the frequency analysis was LanL2MB, a basis set that uses two different pseudo-potentials for lighter and heavier atoms - this pseudo-potential models the core electrons as a whole so that the complexity of the computation is kept to a minimum. Using the same basis set for serial calculations is essential if the results are to be sensible; basis sets are not compatible as they rely on a consistent approach. One basis set will approach modelling the problem in one way, while another will differ and mixing the approaches will force one basis set to continue with a problem that, according to its protocols, is incomplete.
GaussView will occasionally not display certain bonds, that is that GaussView will not draw a line between atoms that an operator would assume exist, given the geometry. This is not because a bond does not exist, instead GaussView only inputs a bond when the strength of an atom-atom interaction is within a set range, specific to the atom-atom pair. One example of this is the optimization of BH3 which, in the early stages (say 1 of 4) has no bond between the boron and any of the hydrogen atoms. Even at 1.5 Å there would still be three B-H 'bonds', but Gaussian does not show them because they are too weak.
A bond can be defined pragmatically as an attractive association between atoms or ions that is stable under the conditions of examination. Stable here means that the bond will be permanent; though it may fluctuate in strength, it will always be attractive - this distinguishes bonds from Van der Waals interactions which are transient and not always attractive on an atomic time scale.
Both geometry and frequency determinations took 8 seconds of run time. This is an insignificant amount of time, given that weeks is the more reasonable time scale for some published calculations.
Cis-/trans-isomerism of Tetracarbonylbis(trichlorophosphine)molybdenum(0)
Introduction
Metal complexes of the form ML14L22 display cis-/trans-isomerism, with the nature of the ligands, the identity of the metal and the temperature all affecting which isomer is more stable. Sterics has a large effect and therefore large L2 ligands are going to favour the trans-isomer.
One of the means of assessing which isomer is present (or indeed the rough proportions of a mixture) is to use IR spectroscopy. The symmetry of cis- and trans-isomers is different and one would therefore expect that the IR-visible vibrations of each would differ in frequency and number. The cis-isomer has C2v{E,C2,2σv} symmetry, while the trans has D4h{E,2C4(z),C2(z),2C2(x,y)',2C2(xy)'',i,2S4(z),σh,2σv,2σd} symmetry. The centre of the inversion for the trans-isomer makes it more probable that certain molecular vibrations will be IR inactive; thus one should expect the cis-isomer to show more vibrations on an IR spectrum.
When analyzing cis-/trans-isomerism it is useful to choose ligands with characteristic vibrational frequencies, that are isolated in the spectral range. Carbonyl ligands are common used, for many metals, because they are usually stable and absorb, at medium strength, in the 1700-2100 cm-1 range.
Tetracarbonylbis(triphenylphosphine)tungsten(0), [W(CO)4(PPh3)2] is a compound reported in the literature to be trans-stable[2], and displays one carbonyl vibration at 1886 cm-1 (prepared in DCM). Likewise cis-[W(CO)4(P(2-Py)Ph2)2, in the same paper, showed four carbonyl vibrations at 2018, 1911, 1898, 1872 cm-1 (prepared in DCM).
Two mechanisms exist for the cis-/trans-conversion, namely dissociation and the Bailar twist[3], but these will not be discussed or examined.
The molecule chosen here is [Mo(CO)4(PCl3)2] because it resembles the molecule [Mo(CO)4(PPh3)2], for which crystal data is available[2] (for the cis-isomer). The triphenylphosphine ligand is well-used, but the number of atoms is too high for time-efficient calculation of the structure under these conditions so trichlorophosphine is used instead. Triphenylphosphine has a cone angle of 145°</ref name="ic00131a055">, making it a large ligand; PCl3 has an estimated cone angle of 72° (twice the Cl-Mo-P angle provided by GaussView using the unoptimized structure, i.e. default bond lengths) - this estimate is poor, but is the best that can be offered without a reference. Cone angle is not a fully accurate indication of sterics, on the whole the chlorine atoms emulate phenyl groups well electronically, which is a vital consideration.
Analysis
Both cis- and trans-[Mo(CO)4(PCl3)2] were drawn in GaussView, and we left unmodified prior to analysis. Both were subjected to a DFT-B3LYP/LanL2MB geometry optimization (additional keywords: opt=loose (to allow the weak method to converge at a less critically defined minimum)) with the additional phosphorous-based functions abutted to the file (below), and 'extrabasis' added to the top line, to allow the d-orbitals to be modelled (this would not be the default approach of the method) - this code was added for all calculations in this section:
[blank line]
P 0
D  1  1.0
0.55  0.100D+01
****
[blank line]
The code for the trans-optimization:
# opt=loose b3lyp/lanl2mb geom=connectivity extrabasis

trans 1st optimization

0 1
- D-space reference: [1]
- Results summary: Nm607_trans_post1opt_results_summary.txt
- Note: the results summary records approximately twice the computing time recorded by the SCAN interface - likely a result of multithreading
The code for the cis-optimization:
# opt=loose b3lyp/lanl2mb geom=connectivity extrabasis

cis 1st optimization

0 1
- D-space reference: [2]
- Results summary: Nm607_cis_post1opt_results_summary.txt
It is interesting to note that the optimization of the cis-isomer took approximately four times longer than for the trans-isomer (taking the SCAN times). The cis structure will be further from the optimal structure than for the trans-isomer if the crystal structure data from this reference[2] is any indication.
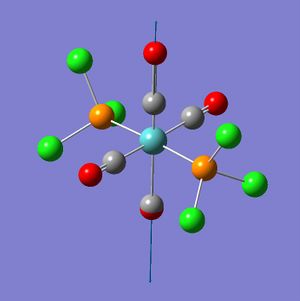
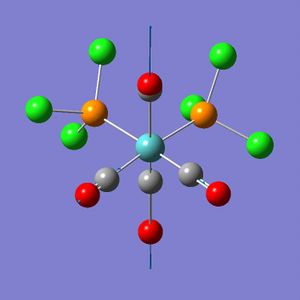
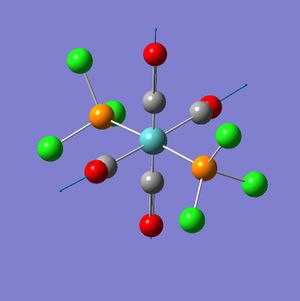
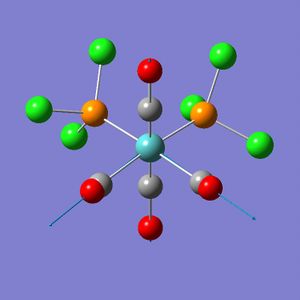
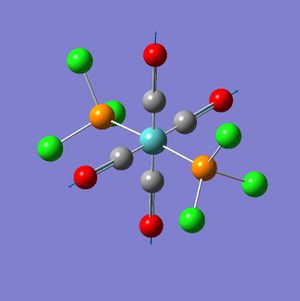
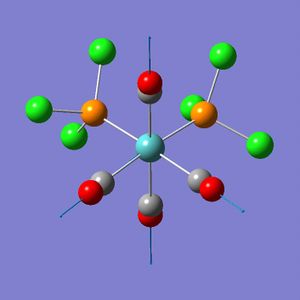
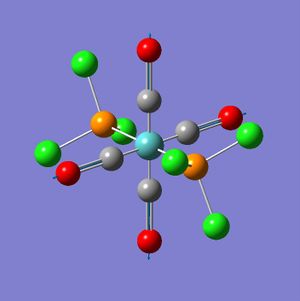
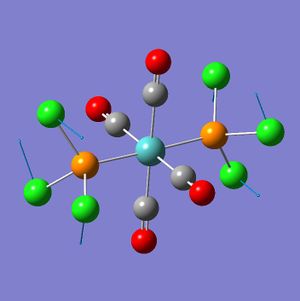
The trans-isomer had the two PCl3 groups in a staggered conformation, while the two groups on the cis-isomer did not have any particular symmetry to them.
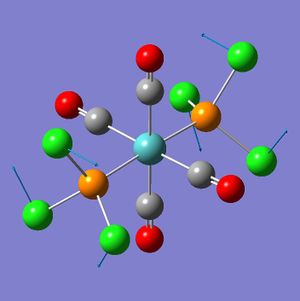
For the next, more accurate, optimization the .out files of the cis- and trans-isomers were edited via GaussView: for the cis-isomer the PCl3 groups were rotated such that one chlorine was synperiplanar to one of the co-cis-carbonyls, and one chlorine on the other PCl3 group was antiperiplanar to the same carbonyl. This was done by adding in bonds between the chlorines and the respective phosphoruses (which GaussView was not displaying), and modifying the dihedral angles to 0° and 180° respectively. There was no need to adjust the dihedral angles of all six chlorine atoms as the PCl3 groups rotated as one.
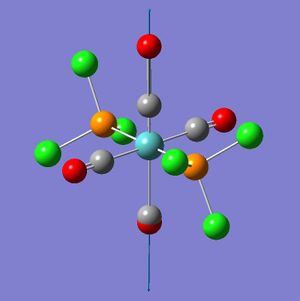
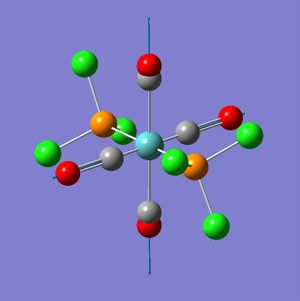
The trans-isomer structure was modified such that, rather than a staggered conformation, the PCl3 groups eclipsed each other. Additionally one chlorine atom on each was made to have a dihedral angle of 0° with one of the carbonyl groups. This was done by independently setting the dihedral angle of a chlorine on each of the PCl3 groups with the same carbonyl at 0°. The same bond-making process as was required for the cis-isomer was repeated with the trans-isomer.
Both modified structures were subjected to a DFT-B3LYP/LanL2DZ geometry optimization (additional keywords: int=ultrafine scf=conver=9). This is a stronger method and further optimizes the structure.
The code for the trans-optimization:
# opt b3lyp/lanl2dz geom=connectivity extrabasis int=ultrafine scf=conver=9

trans 2nd optimization

0 1
- D-space reference: [3]
- Results summary: Nm607_trans_post2opt_results_summary.txt
The code for the cis-optimization:
# opt b3lyp/lanl2dz geom=connectivity extrabasis int=ultrafine scf=conver=9

cis 2nd optimization

0 1
- D-space reference: [4]
- Results summary: Nm607_cis_post2opt_results_summary.txt
Again, the cis-isomer took longer to optimize than the trans-isomer, however the difference between run times was less extreme (about 1.5 times).
The next stage in the analysis was calculating the vibrational frequencies (this has the added advantage of checking the effectiveness of the optimization - negative vibration frequencies indicate an incomplete optimization).
The code for the trans-frequency analysis:
# freq b3lyp/lanl2dz geom=connectivity extrabasis int=ultrafine scf=conver=9

trans frequency analysis

0 1
- D-space reference: [5]
- Results summary: Nm607_trans_postfreq_results_summary.txt
The code for the cis-frequency analysis:
# freq b3lyp/lanl2dz geom=connectivity extrabasis int=ultrafine scf=conver=9

cis frequency analysis

0 1
- D-space reference: [6]
- Results summary: Nm607_cis_postfreq_results_summary.txt
While the cis-frequency analysis converges, the trans-frequency analysis did not. Though the trans-isomer optimization did not converge all the vibrations were positive, and the final displacement values were not too far off the convergence limits. Thus the calculation was not repeated:
Convergence data from the trans-frequency analysis:
| Item | Value | Threshold | Converged? | |
| Maximum | Force | 0.000044 | 0.000450 | YES |
| RMS | Force | 0.000017 | 0.000300 | YES |
| Maximum | Displacement | 0.023087 | 0.001800 | NO |
| RMS | Displacement | 0.005778 | 0.001200 | NO |
Convergence data from the cis-frequency analysis:
| Item | Value | Threshold | Converged? | |
| Maximum | Force | 0.000015 | 0.000450 | YES |
| RMS | Force | 0.000005 | 0.000300 | YES |
| Maximum | Displacement | 0.000676 | 0.001800 | YES |
| RMS | Displacement | 0.000220 | 0.001200 | YES |
From the geometry of the trans-isomer is can be seen that it lacks an inversion centre; the P-Mo-P bond angle is 176.7(27)°, while it should be 180°. One of the problems that the frequency analysis might have had was with the distorted geometry (which was no longer D4h - the log file shows no symmetry labels, but this is also true for the cis-isomer). Thus a further geometry optimization was run with the trans-isomer. This time the PCl3 groups were staggered, and had one chlorine atom with a dihedral angle of 0° or 180° to the same carbonyl.
The code for the trans-optimization:
# opt b3lyp/lanl2dz geom=connectivity extrabasis int=ultrafine scf=conver=9

trans 3rd optimization

0 1
- D-space reference: [7]
- Results summary: Nm607_trans_post3opt_results_summary.txt
Then a frequency analysis was performed:
# freq b3lyp/lanl2dz geom=connectivity extrabasis int=ultrafine scf=conver=9

trans 2nd frequency analysis

0 1
- D-space reference: [8]
- Results summary: Nm607_trans_post2freq_results_summary.txt
Convergence data from the trans-frequency analysis:
| Item | Value | Threshold | Converged? | |
| Maximum | Force | 0.000061 | 0.000450 | YES |
| RMS | Force | 0.000019 | 0.000300 | YES |
| Maximum | Displacement | 0.143246 | 0.001800 | NO |
| RMS | Displacement | 0.035658 | 0.001200 | NO |
The frequency for the third geometry optimization yielded some negative vibrations, one of which was negative by more than -5 cm-1. The analysis did not converge completely. This stage was not repeated because the purpose of optimizing this conformation was to demonstrate how improving the symmetry affected the IR intensities of the vibrations (see next section).
Results
Vibrations
Carbonyl Vibrations

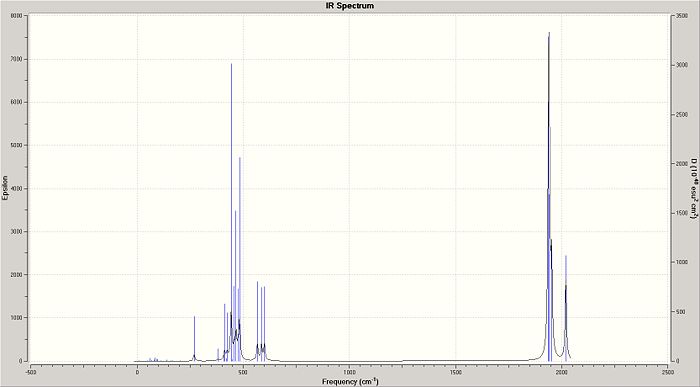

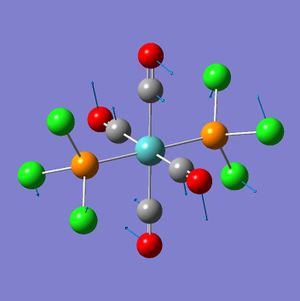
While the difference between the two trans-isomer conformations may seen small, the greater symmetry of the gauche PCl3 groups on that trans-isomer (hence called the AP-trans-isomer) reduced the intensity of the centrosymmetric vibrations to the point where they vanish entirely from the IR spectrum. The P-Mo-P angle in the AP-trans-isomer was 179.8(12) (c.f 176.7° for the other, hence called the SP-trans-isomer). The region of interest if 1700-2100 cm-1, and, what one would expect, there are three peaks for the cis-isomer and one for the trans-isomer: all four cis-isomer carbonyl vibrations are IR active, but two are so close that they would be difficult to resolve (1938 and 1941); the single peak for the trans-isomer is a result of the same type of overlap - two near-identical energy vibrations.
The literature[4] lists, for [Mo(CO)4(PPh3)2], carbonyl stretching frequencies of 1897, 1908, 1927 and 2023 cm-1 for the cis-isomer and 1901 for the trans-isomer. This compares poorly with the computed vibrations of [Mo(CO)4(PCl3)2] at 1939, 1942, 1953 and 2020 cm-1 for cis-isomer (though the highest of these is close to the literature value), and 1939/1940 cm-1 for the trans-isomer. There are two reasons for the discrepancy: firstly, the methods used were not intensive, compared with higher level calculations; and secondly, the chlorine group does not adequately model the sterics of the phenyl group, particularly when it comes to examining the geometry (see next section).
Low Energy Vibrations
The low energy vibrations of the cis- and trans-isomers are not highly localized. One would expect that these vibrations would be typical at room temperature.
Geometry
The trans-isomer of [Mo(CO)4(PCl3)2] has two possible configurations, that where the PCl3 groups are eclipsed or staggered. The staggered conformation is less stable, but has higher symmetry. trans-[Cr(CO)4(PPh3)2] was chosen from the literature because a crystal structure of trans-[Mo(CO)4(PPh3)2] could not be found. Chromium should approximate molybdenum well enough as they are in the same group.
| Table 2.2.5 - Geometric parameters of trans-[Cr(CO)4(PPh3)2] (lit.[5]) and trans-[Mo(CO)4(PCl3)2] (calc.) | |||
|---|---|---|---|
| Parameter | trans-[Cr(CO)4(PPh3)2] | SP-trans-[Mo(CO)4(PCl3)2] | AP-trans-[Mo(CO)4(PCl3)2] |
| P-M (avg.) / Å | 2.3656(16) | 2.42(216) | 2.42(3395) |
| M-C (avg.) / Å | 1.8716 | 2.05(68475) | 2.05(6755) |
| P-M-P / ° | 176.69(6) | 176.7(27) | 179.812 |
| P(1)-M-C(1) / ° | 89.54(15) | 89.9(95) | 91.6(18) |
| P(1)-M-C(2) / ° | 91.85(15) | 90.039 | 88.3(82) |
| P(2)-M-C(1) / ° | 87.99(15) | 91.6(37) | 89.8(46) |
| P(2)-M-C(2) / ° | 88.96(15) | 91.6(37) | 89.9(66) |
While the computed data does not conform precisely with the literature data, the differences can be explained. The bond lengths are longer for molybdenum because of its longer covalent radius relative to chromium (1.54 Å vs. 1.39 Å[6]). As the bond lengths are smaller in the chromium complex there is a greater steric strain, inducing a larger distortion i.e. a smaller P-M-P angle.
The cis-isomer of [Mo(CO)4(PPh3)2] has a significantly different geometry to the cis-isomer of [Mo(CO)4(PCl3)2]:
| Table 2.2.6 - Geometric parameters of cis-[Mo(CO)4(PPh3)2] (lit.[4]) and cis-[Mo(CO)4(PCl3)2] (calc.) | ||
|---|---|---|
| Parameter | cis-[Mo(CO)4(PPh3)2] | cis-[Mo(CO)4(PCl3)2] |
| P-Mo (avg.) / Å | 2.577(2) | 2.47(609) |
| Mo-C (avg.) / Å | 2.041(4) | 2.03(768) |
| P-Mo-P / ° | 104.62(7) | 94.2(81) |
| P-Mo-C (trans) / ° | 163.7(2) | 175.84(1) |
| P-Mo-C (cis) / ° | 80.6(2) | 89.36(3) |
The large differences between the literature values for the triphenylphosphine-based complex and the computed values for the chlorine-based complex are easily explained: firstly, a longer bond length is to be expected between the metal and a large ligand (thus Mo-PPh3 is longer than Mo-PCl3 because PCl3 is smaller than PPh3) and secondly, a large ligand cis- to a large ligand will distort the structure more than two identically-placed small ligands (hence the larger P-Mo-P bond angle with [Mo(CO)4(PPh3)2], and more cramped carbonyls - see small P-Mo-C angles).
The PCl3 ligands repel one another far less than PPh3 ligands do, creating a structure that is closer to octahedral. The Mo-C bond lengths are similar, but without a reference for the variation in Mo-C bonds lengths with the substituents on the phosphine ligands it is poor proof that chlorines at least model phenyl groups electronically.
Energy
The cis- and trans-isomers have different energies, but the variation is small.
| Table 2.2.7 - Energies of isomers of [Mo(CO)4(PCl3)2] | |||
|---|---|---|---|
| Isomer | Energy / Eh | Energy / kJ mol-1 | Relative Energy / kJ mol-1 |
| cis | -623.69291233 | -1637505.741 | 0.00000000 |
| SP-trans | -623.69415602 | -1637509.007 | -3.26567759 |
| AP-trans | -623.69397170 | -1637508.523 | -2.78167759 |
The trans-isomer is the most stable[4], and this is shown in the calculated relative energies of the cis- and trans-isomers. The difference is only a few kJ mol-1. This very small difference can be taken advantage of: if one were to try and take advantage of the chemistry of one or other of the isomers the substituents on the phosphorus could be altered; more sterically hindering substituents will favour the trans-isomer, while smaller substituents favour the cis-isomer due to electronic reasons.
Mini Project
The web browser was having problems displaying all my work as a single page. The mini project can be found here.
References
- ↑ http://www.ch.ic.ac.uk/hunt/teaching/teaching_comp_lab_year3/6_freq_analysis.html
- ↑ 2.0 2.1 2.2 L. Hirsivaara, M. Haukka, J. Pursiainen, Inorg. Chem. Comm. 3, 2000, 21, 508-510. DOI:10.1021/ic00131a055 Cite error: Invalid
<ref>tag; name "ic00131a055" defined multiple times with different content - ↑ D. J. Darensbourg, Inorg. Chem., 1979, 18, 14-17. DOI:10.1021/ic50191a003
- ↑ 4.0 4.1 4.2 D. J. Darensbourg, R. L. Kump, Inorg. Chem., 1978, 17, 2680-2682. DOI:10.1021/ic50187a062
- ↑ D. W. Bennett, T. A. Siddiquee, D. T. Haworth, S. E. Kabir, F. K. Camellia, J. Chem. Crys., 2004, 34, 353-359.DOI:10.1023/B:JOCC.0000028667.12964.28
- ↑ B. Cordero, V. Gómez, A. E. Platero-Prats, M. Revés, J. Echeverría, E. Cremades, F. Barragán, S. Alvarez, Dalton Trans., 2008, 2832 - 2838. DOI:10.1039/b801115j

