
Rep:Mod2:md308
Mark Driver
Module 2
Introduction
Structure and bonding of inorganic compounds is typically far more complex than that seen in organic chemistry. Computational techniques can be applied to inorganic chemistry in order to give us insights into the structures and bonding of inorganic molecules. Computational methods can determine the energy of various conformations and can also be used to probe short lived transition states which are difficult to study experimentally or spectroscopically. From these calculations it is possible to derive thermodynamic and kinetic data which give us greater understanding of these systems. A number of physical and spectroscopic properties can also be estimated computationally, for example IR and Raman spectra, NMR spectra and dipole moments. Molecular orbitals can also be described computationally which allows us to study how the electron density is spread across the molecule; this provides a useful method for investigating bonding in inorganic compounds.
Small Molecules
BH3
Optimisation
BH3 was drawn out using Gaussview 5. All BH bond lengths were set to 1.5 Å and then the geometry was optimised using the B3LYP method and a 3-21G basis set. This calculation is not very accurate due to the basis set used but gives reasonable results with little computational time.

The optimised geometry of borane is shown above. This suggests that BH3 has D3h symmetry. The optimised geometry has a planar arrangement with all BH bond lengths of 1.19 Å, bond angles of 120° and a total energy of -26.462 au. The optimisation procedure works by simulating the molecule and solving the Schrödinger equation for the electrons using the B3LYP/3-21G approximation. The nuclear coordinates are then adjusted until the energy reaches a minima. This is determined by the RMS gradient which is zero at the minimum energy. The success of the optimisation was confirmed by checking the RMS gradient reported in the output file. Any gradient less than 0.01 au corresponds to a fully optimised geometry. The RMS gradient resulting from this calculation is 0.0002 au, therefore the geometry has been optimised correctly. This was further verified by checking the output file to verify that the force and displacement converged.

|

| ||
| Step 1 | Step 2 | Step 3 | Step 4 |

|

|

|

|
| -26.383 au | -26.418 au | -26.461 au | -26.462 au |
The table above summarises the steps taken during the optimisation procedure. After each step the nuclei are moved and the energy is determined. This is repeated until the structure arrives at an energy minimum.
Molecular Orbitals

The molecular orbitals of BH3 were calculated using the B3LYP method with a 6-31G basis set. Below is the predicted molecualr orbital diagram produced using the LCAO approach. This is a simple approximation which adds atomic orbitals together to produce molecular orbitals. Only orbitals with the same symmetry and similar energies can mix. There are 8 MO's produced from various combinations between the 8 AO's of the constituent atoms. Comparison between this qualitative approach and the quantum mechanical results allows us to determine the accuracy and usefulness of the LCAO method.
| Orbital | Calculated Molecular Orbital | Energy / Hartree |
|---|---|---|
| 2e' | LUMO +2 | 0.179 |
| LUMO +2 | ||
| 3a'1 | LUMO +1 | 0.166 |
| 1a"2 | LUMO | -0.068 |
| 1e' | HOMO | -0.353 |
| HOMO | ||
| 2a'1 | HOMO -1 | -0.515 |
| 1a'1 | HOMO -2 | -6.766 |
The MO's predicted in the molecular orbital diagram of BH3 are very good approximations to those produced from quantum mechanical calculations. They correlate well both in shape and in relative energies. The shapes of the calculated MO's are more well defined than the LCAO method, but with a little chemical intuition they can be invisaged based on the representations produced in this way. The 1a'1 molecular orbital (HOMO -2) is essentially the 1s orbital of the boron atom, as this is far too low in energy to interact significantly with the hydrogen atomic orbitals. The 1e' (HOMO) and 2a'1 (HOMO-1) molecular orbitals provide are bonding orbitals; providing a total of 6 bonding electrons. The Pz atomic orbital does not have the correct symmetry to interact with the hydrogen atomic orbitals. The 1a"2 (LUMO) has an energy very close to 0 hartree, This correlates well with the prediction of non-bonding character. The shape of this orbital suggests that it has essentially Pz character. The relative energies and shapes of the higher energy orbitals are in excellent agreement with those predicted by the LCAO approach.
The LCAO approach to molecular orbital theory allows for surprisingly accurate estimations of the shapes of molecular orbitals. This is a very useful first step in understanding the bonding and structure of molecules. However, the relative energy of the orbitals is somewhat arbitrary. For example, the ordering of the 2e' and 3a'1 MO's is a little ambiguous based solely on LCAO approximations. Quantum mechanical calculations or experimental/spectroscopic data are required to definitively determine this order. Qualitative MO theory is a very useful first step due to the speed with which the orbitals can be predicted and the accuracy of the results. Where a more quantitative model is needed the computational methods are better.
Natural Bond Orbital Analysis

Inspection of the .log file allows us to analyse the electron distribution in borane. As expected there is no total charge on the molecule but the electron distribution is distorted towards the hydrogen nuclei. This places a large positive charge on boron a negative negative charge on each hydrogen. The charges on each hydrogen are equal (-0.093) which is to be expected considering the symmetry of the molecule. All three hydrogens are equivalent due to a C3 rotational axis, so have identical charge distributions. The positive charge at the boron centre (+0.278) explains the lewis acidic nature of this molecule. The boron atom is highly electron deficient so readily accepts electrons to compensate for this. All three B-H bonding orbitals have a 33.3% contribution from the s orbital and 66.6% from the p orbitals indicating that boron is sp2 hybridised. The hybridised boron orbitals contribute 45.4% to each B-H bond with the hydrogen s orbital contributing the remaining 54.6%. This reiterates the point that the B-H bonds are skewed towards the hydrogen atoms.
Vibrational Frequency Analysis
Calculating the vibrational frequencies of a molecule allows us to verify that the optimised structure is a minimum rather than a transition state (a maximum). The frequency analysis is the second derivative of the potential energy surface so if any of the vibrational frequencies are negative then the structure is that of a transition state and the potential energy is at a maximum. The frequncy analysis was carried out on a preoptimised structure using the b3lyp/3-21g method.
| Vibration | Frequency / cm-1 | Intensity | Symmetry Label |
|---|---|---|---|
|
|
1144 | 92.9 | A2' |
|
|
1204 | 12.3 | E' |
|
|
1204 | 12.3 | E' |
|
|
2598 | 0.0 | A1' |
|
|
2737 | 103.7 | E' |
|
|
2737 | 103.7 | E' |

All of the vibrational modes have positive frequencies this confirms that we are dealing with an energy minima and the the structure was optimised successfully. Theoretically, there should be 6 vibrational modes for this molecule (3N-6, N=4). This has been confirmed by these calculations. However, only three vibrations are observed in the IR spectrum. The symmetric stretching mode has no change in dipole moment and therefore is not IR active. This leaves 5 IR active vibrational modes, the scissoring and rocking modes are degenerate as are the asymmetric stretches therefore only three peaks are observed in the IR spectrum.
TlBr3
Optimisation
| File Name | TlBr3 Optimisation |
| File Type | .log |
| Calculation Type | FOPT |
| Calculation Method | RB3LYP |
| Basis Set | LANL2DZ |
| Charge | 0 |
| Spin | Singlet |
| E(RB3LYP) | -91.218 au |
| RMS Gradient Norm | 0.0000009 au |
| Dipole Moment | 0 Debye |
| Point Group | D3h |
The geometry of TlBr3 was optimised in a similar manner to borane. The symmetry of this molecule was constrained to the D3h point group to prevent distortions from this geometry during the optimisation procedure. The basis set used in the borane calculation is inappropriate for this calculation; Tl and Br are much larger so have many more electrons. Calculating the contribution of each electron explicitly would be extremely time consuming, whereas ignoring core electrons would not take into account the relativistic effects produced in these heavier atoms. The LANL2DZ basis set used in this calculation is a medium level basis set which approximates the core electrons as a pseudo-potential.
The optimised structure of TlBr3 has D3h symmetry with all TlBr bond lengths of 2.65 Å and Br-Tl-Br angles of 120°. This is in good agreement with the values reported in the literature [1] of a trigonal planar molecule with bond lengths of 2.515 Å. The similarity between these values demonstrates the power of computational chemistry to predict structure and geometry. The small difference between the experimental and calculated bond lengths is most likely due to the errors associated with the approximations involved. More accurate results could have been achieved by using a larger basis set and giving the molecule a full quantum mechanical treatment.
Vibratrional Frequency Analysis
Vibrational frequency analysis (using B3LYP/LANL2DZ) was carried out to ensure that the geometry was optimised correctly. The same calculation method and basis set were used in both calculations to allow the results to be compared. As for BH3 there are six vibrational modes, all have positive frequencies indicating that a minimum was found.
| Vibration | Frequency / cm-1 | Intensity | Symmetry Label |
|---|---|---|---|
|
|
46 | 3.7 | E' |
|
|
46 | 3.7 | E' |
|
|
52 | 5.8 | A2' |
|
|
165 | 0.0 | A1' |
|
|
211 | 25.5 | E' |
|
|
211 | 25.5 | E' |

Analysis of the .log file shows 6 low frequencies at -3.4213 cm-1, -0.0026 cm-1, -0.0004 cm-1, 0.0015 cm-1and two at 3.9362 cm-1. These correspond to the vibrations of the centre of mass and in the ideal case would be 0. In this case however, noise and inaccuracies in the calculation cause slight deviations from this optimum value. Higher level calculations would provide low frequencies closer to 0. These can be distinguished from the "real" normal modes as the lowest frequency of these is an order of magnitude larger at 46.4 cm-1.
Optimisation can often distort a molecules to the point where the program no long were recognises the chemical bond. This is because Gaussview contains lists of parameters such as lengths of bonds between various nuclei. If the optimised geometry produces a structure outside of the range defined by these parameters the program will not recognise the bond. This is because a chemical bond cannot be defined by internuclear separations alone. A bonding interaction is a region of electron density between two or more nuclei which provides an attractive force. These attractive forces can hold the nuclei in particular positions relative to one another, giving rise to complex molecular structures.
Isomers of Mo(CO)4(PPh3)2
Structure Optimisation
 |
The isomers of Mo(CO)4(PPh3)2 can be differentiated based on their IR spectra. 4 CO stretching modes are observed where the phosphine ligands are cis to one another, whereas only 1 is observed with the trans- isomer. This is due to the symmetry of the molecules. The thermal stability and vibrational characteristics of these compounds were investigated using computational techniques. The phenyl rings are very large require a large amount of time and effort to model. Therefore, the triphenylphosphine groups were replaced with trichlorophosphines. Cl has been found to exhibit similar properties to Phenyl rings, both in terms of steric bulk and electronic properties, but requires far less computational resources to model.
The structures were optimised three times using the B3LYP method and increasingly complex basis sets and pseudo-potentials. The preliminary optimisations were carried out using the low level LANL2MB basis set with loose convergence criteria to allow for the low accuracy of this method. This gave a rough estimation of the structure with good bond lengths and angles.
Prior to the second optimisation the dihedral angles of the phosphine ligands were adjusted to minimise unfavourable interactions. The trans isomer had the PCl3 groups in an eclipsed conformation with one P-Cl bond eclipsed with a carbonyl. The cis isomers were arranged with one PCl bond antiperiplanar to an axial carbonyl group. The new geometries were then subjected to optimisation using the LANL2DZ pseudo-potential and basis set. The electronic convergence was increased and normal optimisation criteria were used.
The third optimisation using the same basis set and setting as for the second was carried out to take account of the tendency for phosphorus to take part in hypervalent bonding. This was done by including d- atomic orbitals in the basis set.
| Trans Isomer | Cis Isomer | |||||
|---|---|---|---|---|---|---|
| 1st Optimisation | 2nd Optimisation | 3rd Optimisation | 1st Optimisation | 2nd Optimisation | 3rd Optimisation | |
| Calculation Type | FOPT | FOPT | FOPT | FOPT | FOPT | FOPT |
| Calculation Method | RB3LYP | RB3LYP | RB3LYP | RB3LYP | RB3LYP | RB3LYP |
| Basis Set | LANL2MB | LANL2DZ | Gen | LANL2MB | LANL2DZ | Gen |
| E(RB3LYP) / au | -617.522 | -623.576 | -623.694 | -617.525 | -623.577 | -623.693 |
| RMS Gradient Norm / au | 0.00017 | 0.00007 | 0.000056 | 0.000114 | 0.000028 | 0.000008 |
| Dipole Moment / Debye | 8.4652 | 1.3097 | 0.0709 | 0 | 0.3049 | 0.2293 |
Vibrational analysis confirmed that both structures were at an energy minima as no negative energies were observed. The fully optimised structures of each complex are very similar in energy. The trans isomer is more stable by 2.63 kJ mol-1. This is well within the error expected from these calculations, which is around 10 kJ mol-1. This means that comparison of the energies is problematic. However, the destabilisation of the cis- isomer relative to the trans- isomer can be attributed to the steric repulsion between the PCl3 groups. This causes a slight distortion from the ideal octahedral geometry and hence a small increase in energy. The trans- isomer has these groups as far apart as possible and so minimises this interaction. This effect could be increased by using even bulkier ligands, this would increase the steric clash and favour the trans isomer even more. Small ligands with attractive interactions such as H-bonding between the groups would likely favour the cis isomer.
| Bond Lengths | ||
|---|---|---|
| Calculated | Literature [2] | |
| Mo-P / Å | 2.476 | 2.576 |
| Mo-C (equatorial) / Å | 2.021 | 1.972 |
| Mo-C (axial) / Å | 2.055 | 2.059 |
| C-O (equatorial) / Å | 1.176 | 1.158 |
| C-O (axial) / Å | 1.175 | 1.136 |
| Bond Angles | ||
| Calculated | Literature [2] | |
| P-Mo-P / ° | 94.3 | 104.62 |
| P-Mo-C / ° | 175.8 | 173.2 |
| C-Mo-C / ° | 178.7 | 174.1 |
| Bond Lengths | ||
|---|---|---|
| Calculated | Literature [3] | |
| Mo-P / Å | 2.422 | 2.500 |
| Mo-C / Å | 2.057 | 2.005 |
| C-O / Å | 1.174 | 1.164 |
| Bond Angles | ||
| Calculated | Literature [3] | |
| P-Mo-P / ° | 176.7 | 180.0 |
| P-Mo-C / ° | 90.0, 88.4 | 87.2, 92.0 |
| C-Mo-C (trans)/ ° | 178.4, 180.0 | 180.0 |
| C-Mo-C (cis)/ ° | 90.8, 89.2 | 92.1 |
The tables above summarise the structural data from the optimised geometries. The literature values given are for Mo(CO)4(PPh3)2 rather than Mo(CO)4(PCl3)2 but as discussed previously these have similar properties. Comparison of these parameters to the literature indicate that the geometries obtained are reasonable as all bond lengths and bond angles are very similar. The literature values indicate that Mo(CO)4(PPh3)2 has a more strained structure than Mo(CO)4(PCl3)2, typically with larger bond angles and longer bond lengths. This is presumably due to increased steric bulk of Ph compared to Cl.
Vibrational analysis
Vibrational frequency analysis has verified that both complexes have been optimised to an energy minimum as all frequencies are positive.
| Vibration | Frequency / cm-1 | Intensity | |
|---|---|---|---|
| Trans- Isomer |
|
12 | 0.0 |
|
|
20 | 0.0 | |
| Cis- Isomer |
|
4 | 0.1 |
|
|
7 | 0.0 |
The table above shows the low frequency vibrations of both isomers. It can be seen that these "vibrations" are actually rotations of the PCl3 groups around the Mo-P axes. The thermal energy at room temperature is given by kT, at room temperature (298 K) this is approximately 2.5 kJ mol-1. This corresponds to a frequency of around 210 cm-1; the frequencies of these rotations are all below 20 cm-1. Therefore thermal energy at room temperature is around ten times in excess of that required for these motions. The PCl3 groups can be expected to readily undergo rotations under these conditions.
| Vibration | Calculated Frequency / cm-1 | Intensity | Literature Frequency / cm-1 [4] | |
|---|---|---|---|---|
| Trans- Isomer |
|
1939 | 1605.6 | 1896 |
|
|
1940 | 1606.0 | 1896 | |
|
|
1967 | 5.9 | N/A | |
|
|
2026 | 5.4 | N/A | |
| Cis- Isomer |
|
1938 | 1604.7 | 1986 |
|
|
1941 | 813.5 | 1994 | |
|
|
1952 | 588.5 | 2004 | |
|
|
2019 | 544.6 | 2072 |
 |
The calculated IR spectra of each complex are shown above. The carbonyl stretching frequencies can be used to identify these complexes. The trans isomer shows a single peak at 1940 cm-1 whereas the cis isomer shows 4 peaks at 1938 cm-1, 1941 cm-1, 1952 cm-1 and 2019 cm-1. These are all approximately 50 cm-1 lower than those reported in the literature. This difference is due to an inherent error with the calculations. The vibrations are treated as harmonic oscillations, where in reality they are better described as anharmonic. This introduces a systematic error of around 10% to the frequency values. For these vibrations this amounts to up to 200 cm-1. Therefore these vibrational frequencies are accurate to within the experimental error.
The number of carbonyl stretching modes which will be observed in the IR spectra can be predicted based on the symmetry of the molecules. If both molecules are treated as though the phosphines are undergoing rapid rotations then the trans and cis isomers have D4h and C2v symmetry respectively. The high symmetry of the trans isomer means that only one carbonyl vibrational mode is IR active, The relatively low symmetry of the cis isomer produces four IR active carbonyl stretches.
Even though only one carbonyl stretching mode is expected for the trans isomer and four for the cis isomer, there are four calculated vibrational frequencies for both complexes. However, the first two CO stretching modes(1939 cm-1 and 1940 cm-1) in the trans compound are degenerate by virtue of the high symmetry of the molecule. The remaining two stretching modes (result in no change in dipole moment and therefore are not IR active, hence the very low intensity of these peaks compared to the other two.
Mini Project - Siloxanes
Introduction
This mini project will investigate the structure an bonding in siloxanes, in particular the nature of the Si-O bond and the effect of substituents on the bond. Polymeric siloxanes are extremely thermally and chemically inert and have found widespread use as heat resistant rubbers. These properties have been attributed to the strength and flexibility of the Si-O-Si linkage. The Si-O bond is extremely strong with a bond dissociation energy of 799.6 kJ mol-1 [5]. The high bond strength and flexibility of the Si-O-Si linkage has been rationalised as delocalisation of the lone pairs on oxygen into the vacant d-orbitals on Si or into the σ* of an Si-R bond. The Si-O bond will be studied analysed to determine if there is any d-orbital involvement. This will be done by analysing the vibrational frequencies, molecular orbitals and natural bond orbitals of a small siloxane and a carbon analogue.

A polymeric siloxane would be far too large to study computationally, therefore only disiloxane (H3Si-O-SiH3) and dimethylether. This contains only a single Si-O-Si linkage. However, the results obtained here should also be valid for large and polymeric siloxanes. By comparing the bonding in these compounds the degree of delocalisation of the oxygen lone pairs can be determined.

Optimisation
Disiloxane and dimethyl ether were drawn out in various conformations and optimised using the low level B3LYP/3-21G method. This allowed the optimum starting positions to be found. The bond angles and bond lengths of the siloxane were set according to those reported in the literature[6]. The Si-O bond was set to 1.634 Å and the Si-O-Si angle was set to 144.1 °.
These initial structures were then subjected to optimisation by MP2/6-311G(d.p) calculations.
| (H3Si)2O [2] | Me2O [3] | |
|---|---|---|
| Si-O / Å | 1.641 | 1.408 |
| Si-O-Si / ° | 156.6 | 110.5 |
| E / au | -656.738 | -154.616 |
| RMS gradient / au | 0.00000038 | 0.000093 |
Vibrational frequency analysis was carried out to ensure that the structures where optimised. All frequencies were positive confirming that a minima was found. The Structure was then optimised further by including the additional keywords "int=ultrfine scf=conver=9", this increases the electronic convergence criteria.
| (H3Si)2O [4] | Literature [6] | Me2O [5] | Literature [7] | |
|---|---|---|---|---|
| Si-O / Å | 1.641 | 1.634 | 1.408 | 1.415 |
| Si-O-Si / ° | 156.6 | 144.1 | 110.5 | 111.0 |
| E / au | -656.738 | -154.616 | ||
| RMS gradient / au | 0.00000042 | 0.00093 | ||
|
|
| |||
Optimisation of the structure was again confirmed by vibrational analysis.
The structures and energies obtained after this second optimisation are not significantly different than those resulting from the first optimisation. This may be because the electronic convergence criteria were not tightened sufficiently. MP2 is a relatively high level calculation method and already includes electron correlation effects. Also, the basis set used should allow for very accurate calculations. Therefore, the criteria inherent to the method used may be more accurate than the extra limits imposed during the second optimisation. These structures show considerable similarity to those reported in the literature. The bond lengths for both compounds are very similar to those measured experimentally as is the bond angle for dimethylether. The calculated bond angle for disiloxane is 12.5 ° larger than that measured experimentally. This may be due to an overestimation of the steric repulsion between the silyl groups. However, both structures are non-linear as expected and the structural parameters seem reasonable.
Molecular Orbitals
The Molecular orbitals of both compounds were calculated using the same method and basis sets used in the final optimisation. The additional keywords "pop=full" were added and the NBO analysis was turned on.

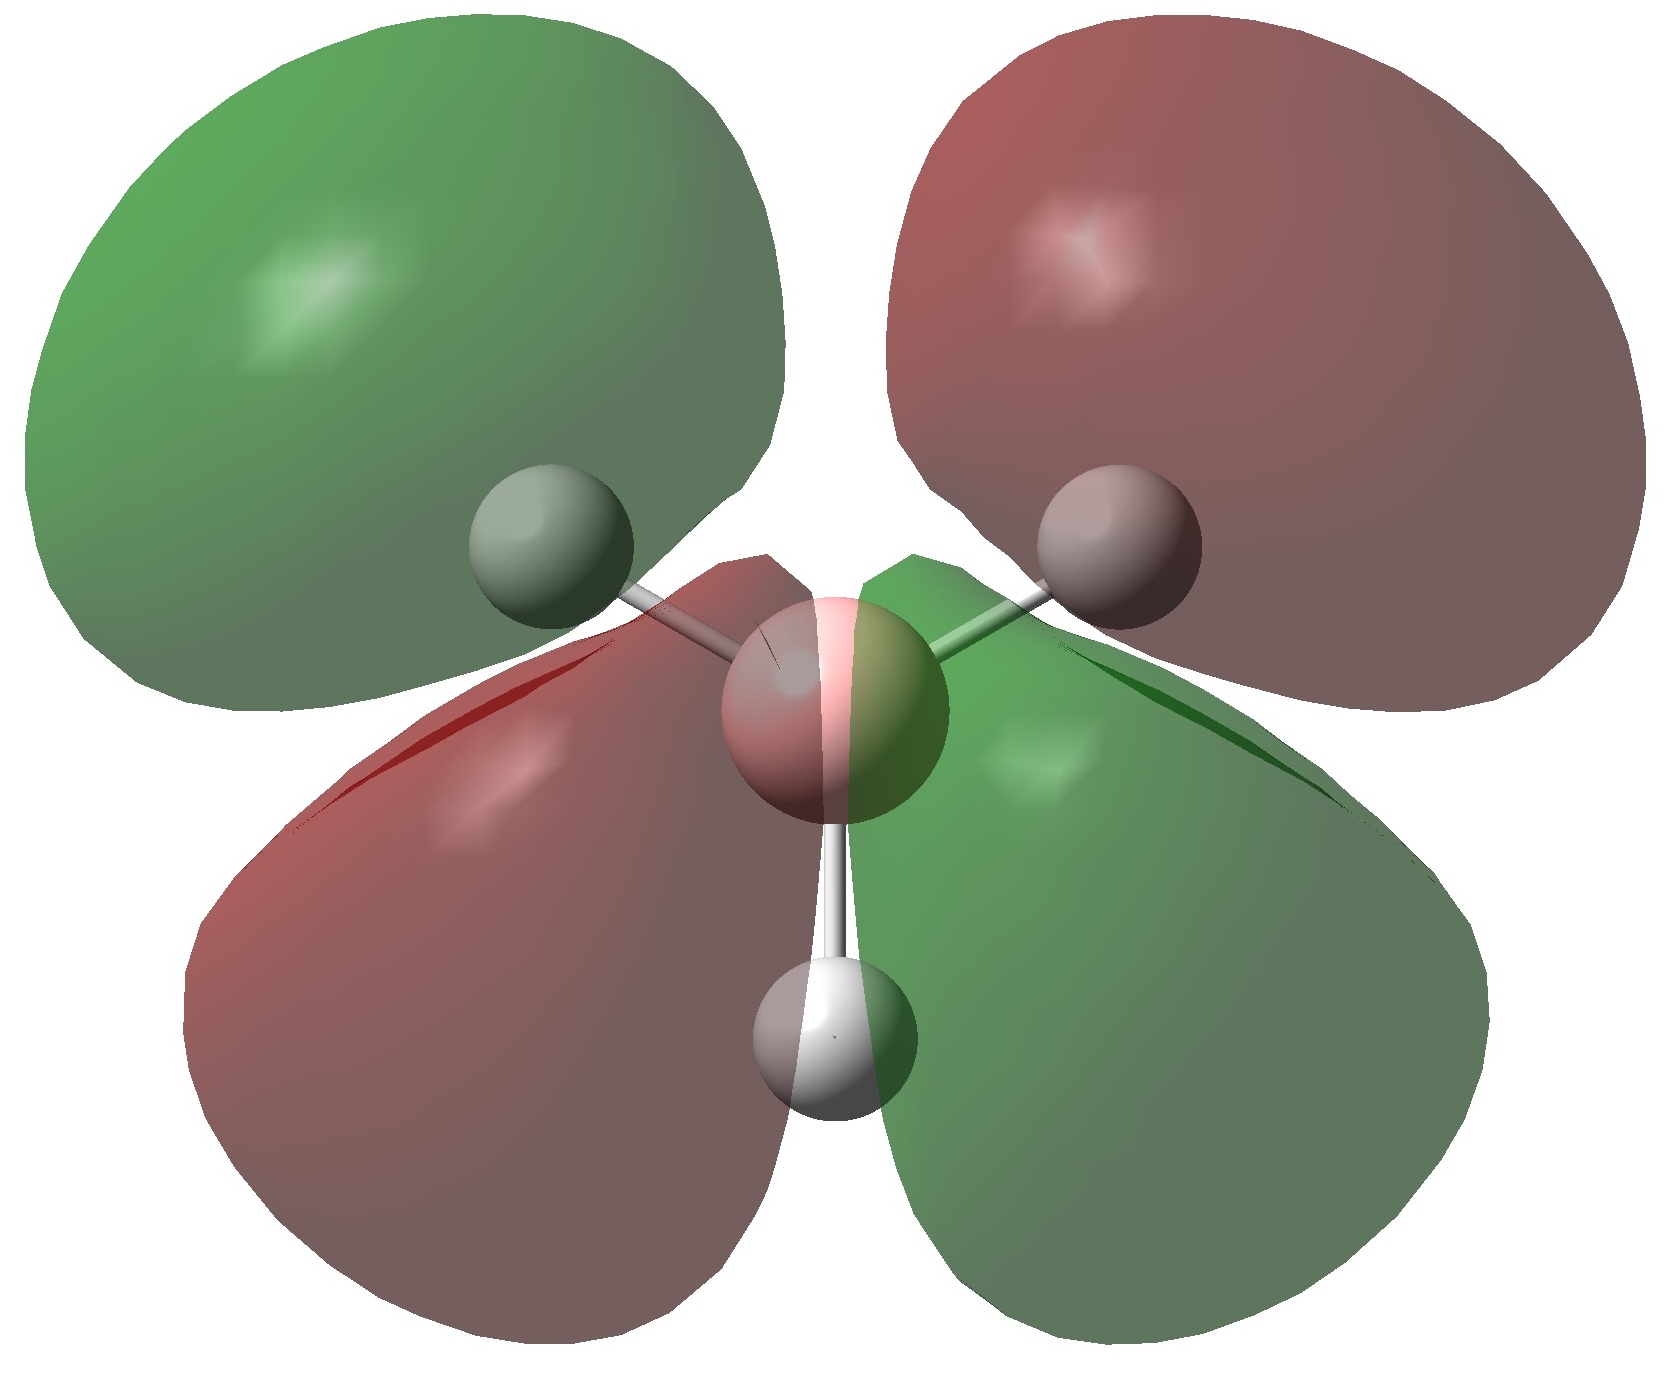
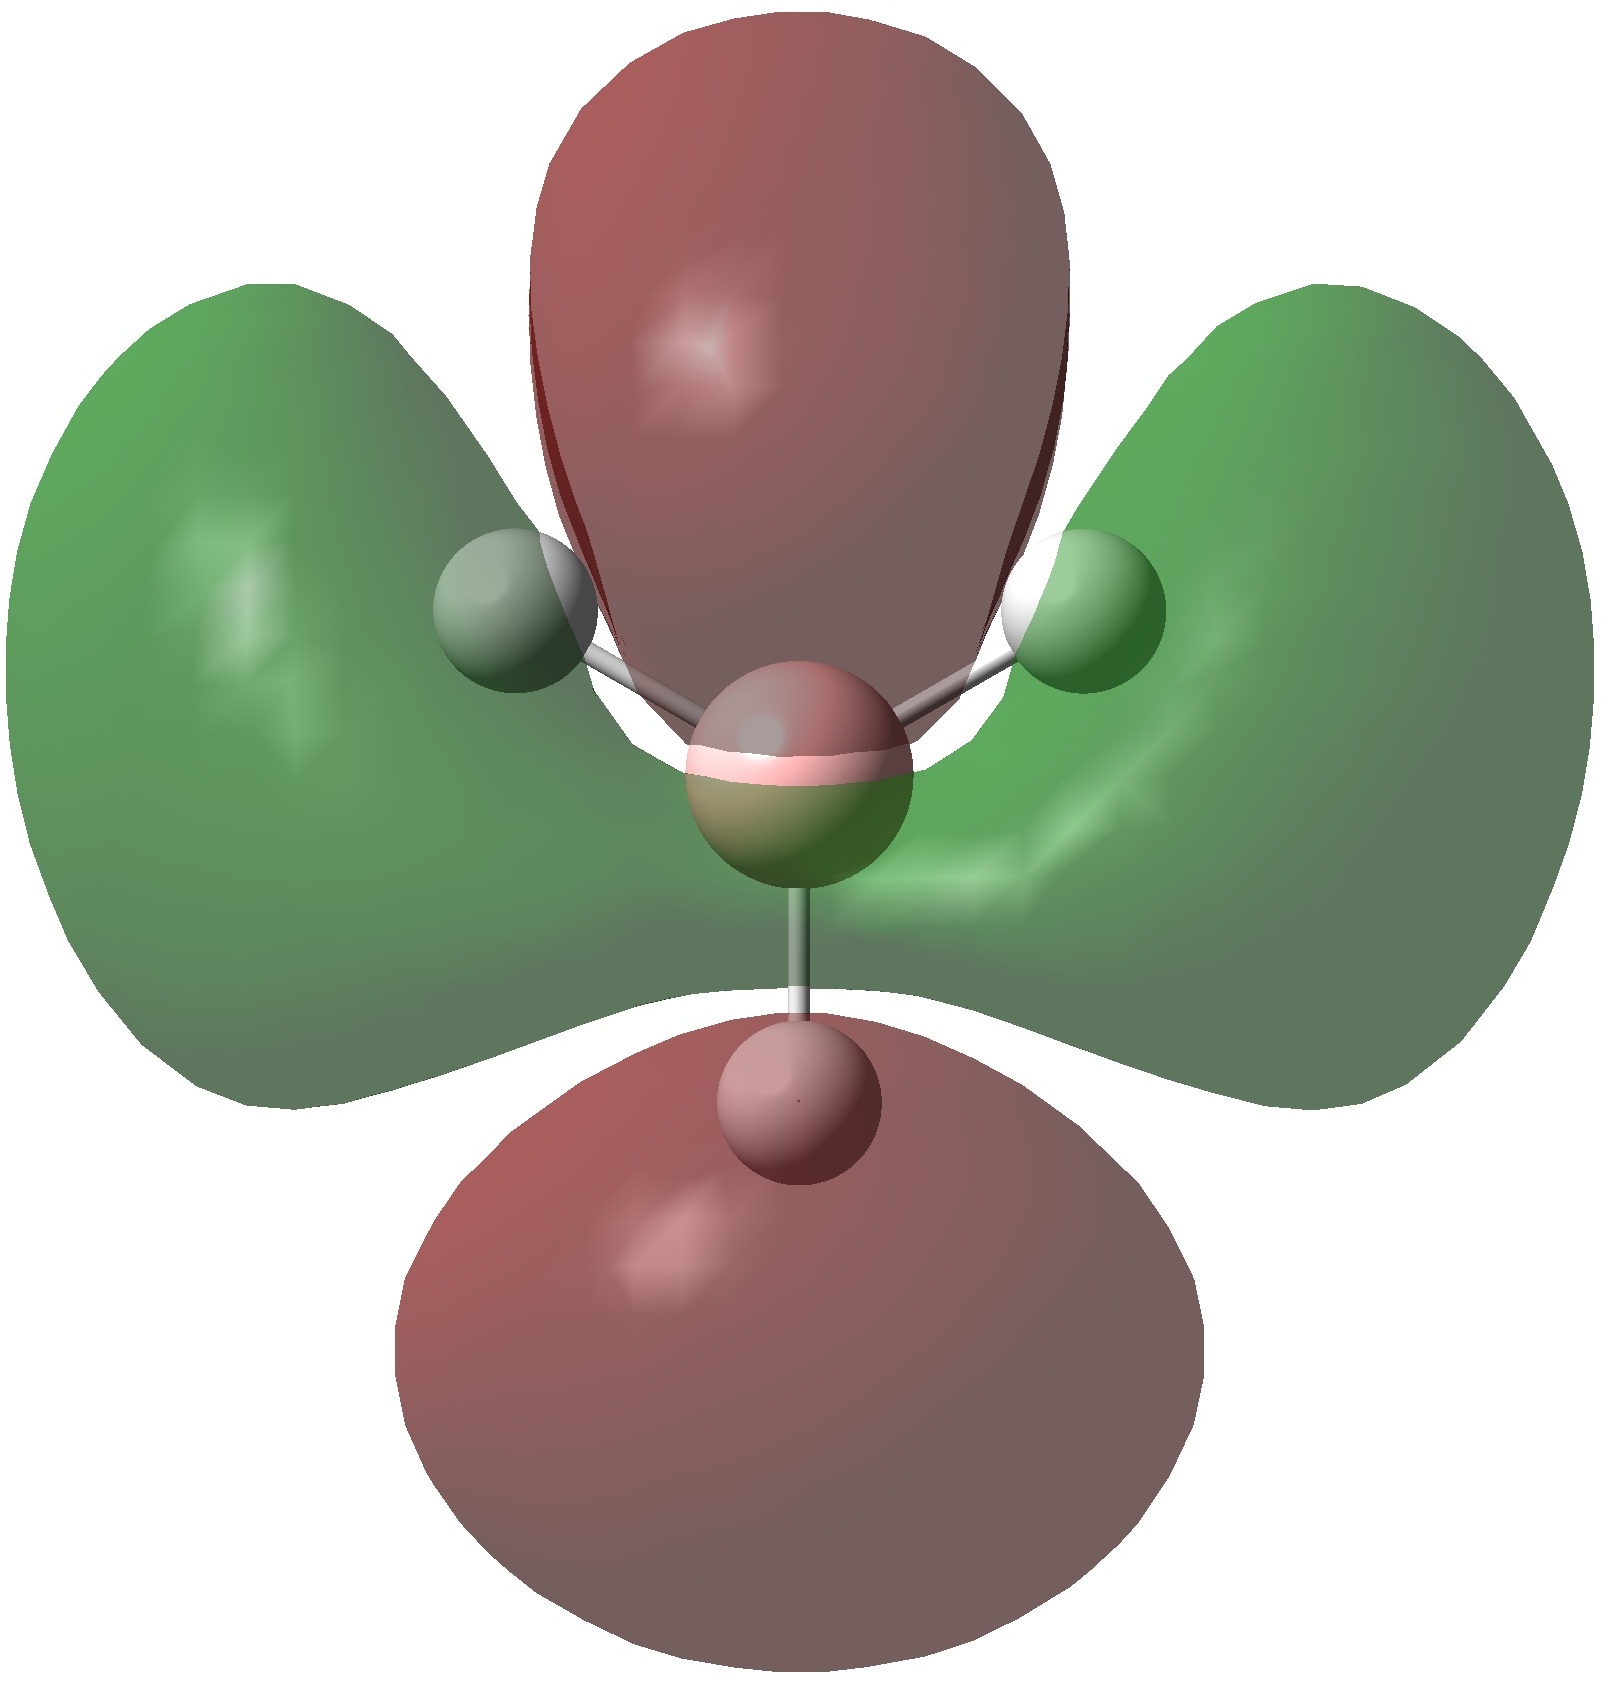
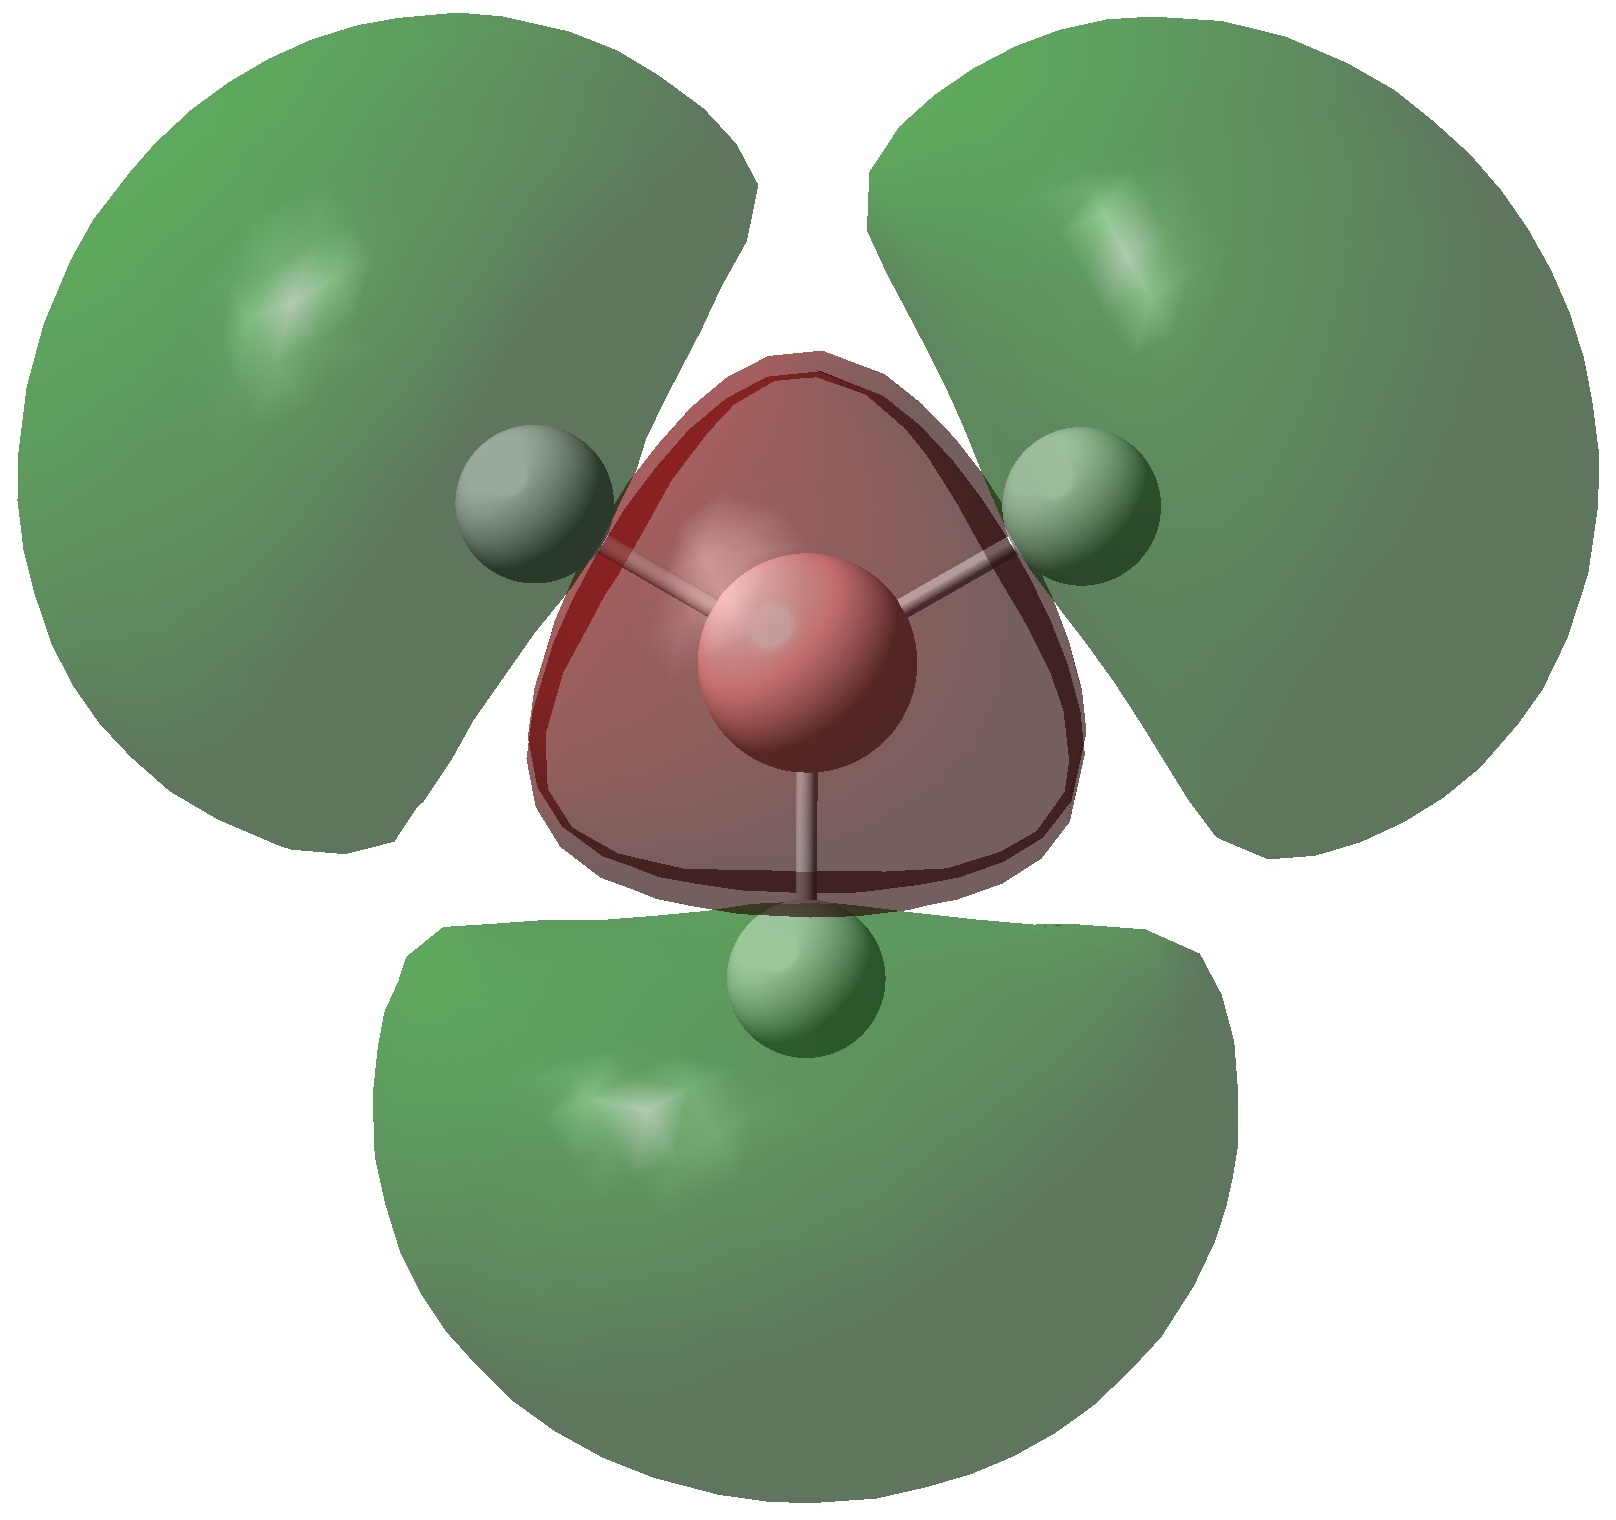
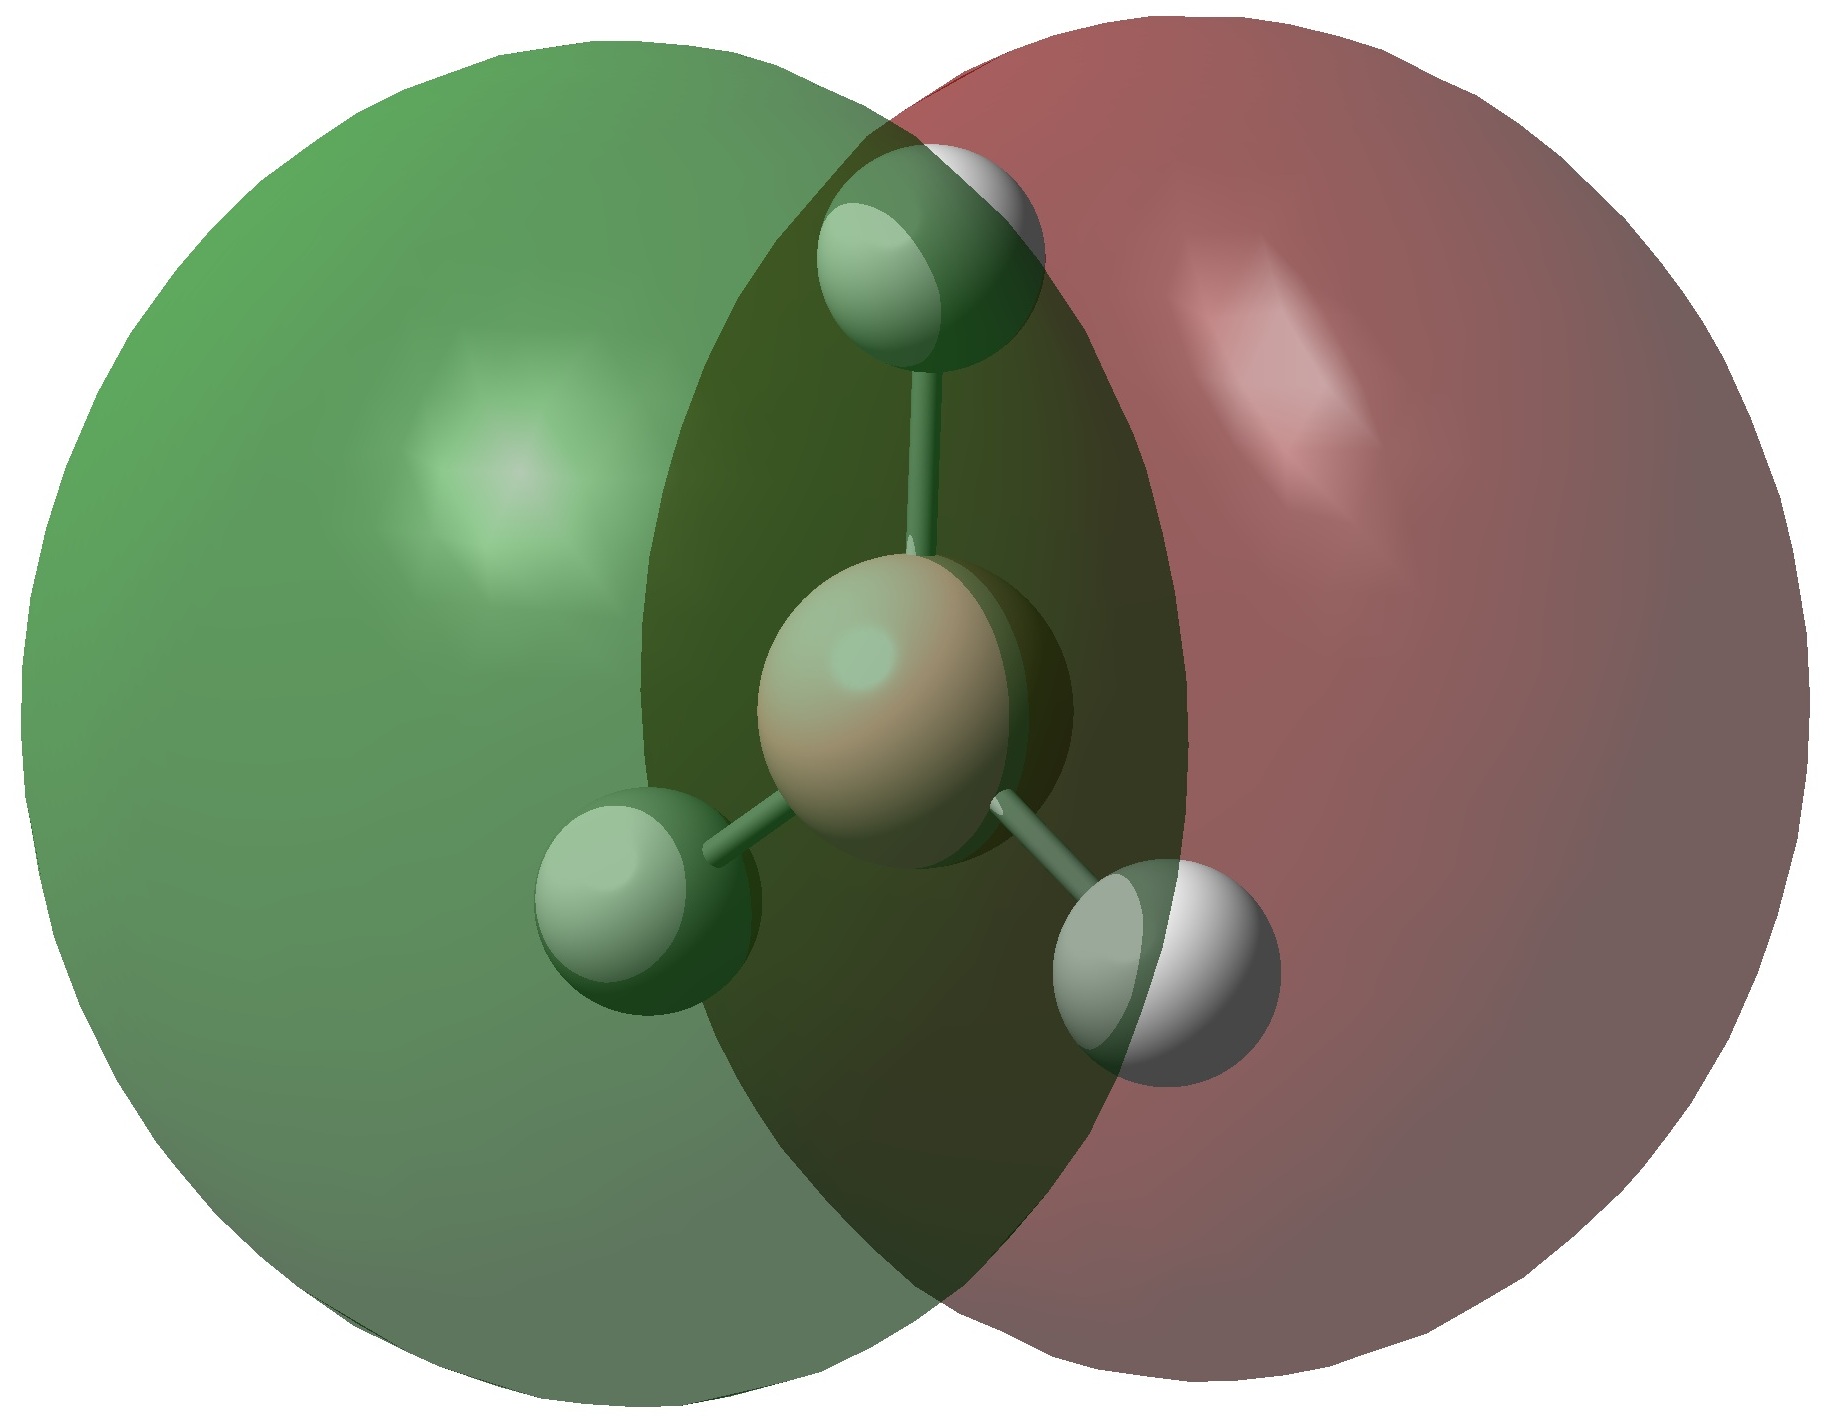
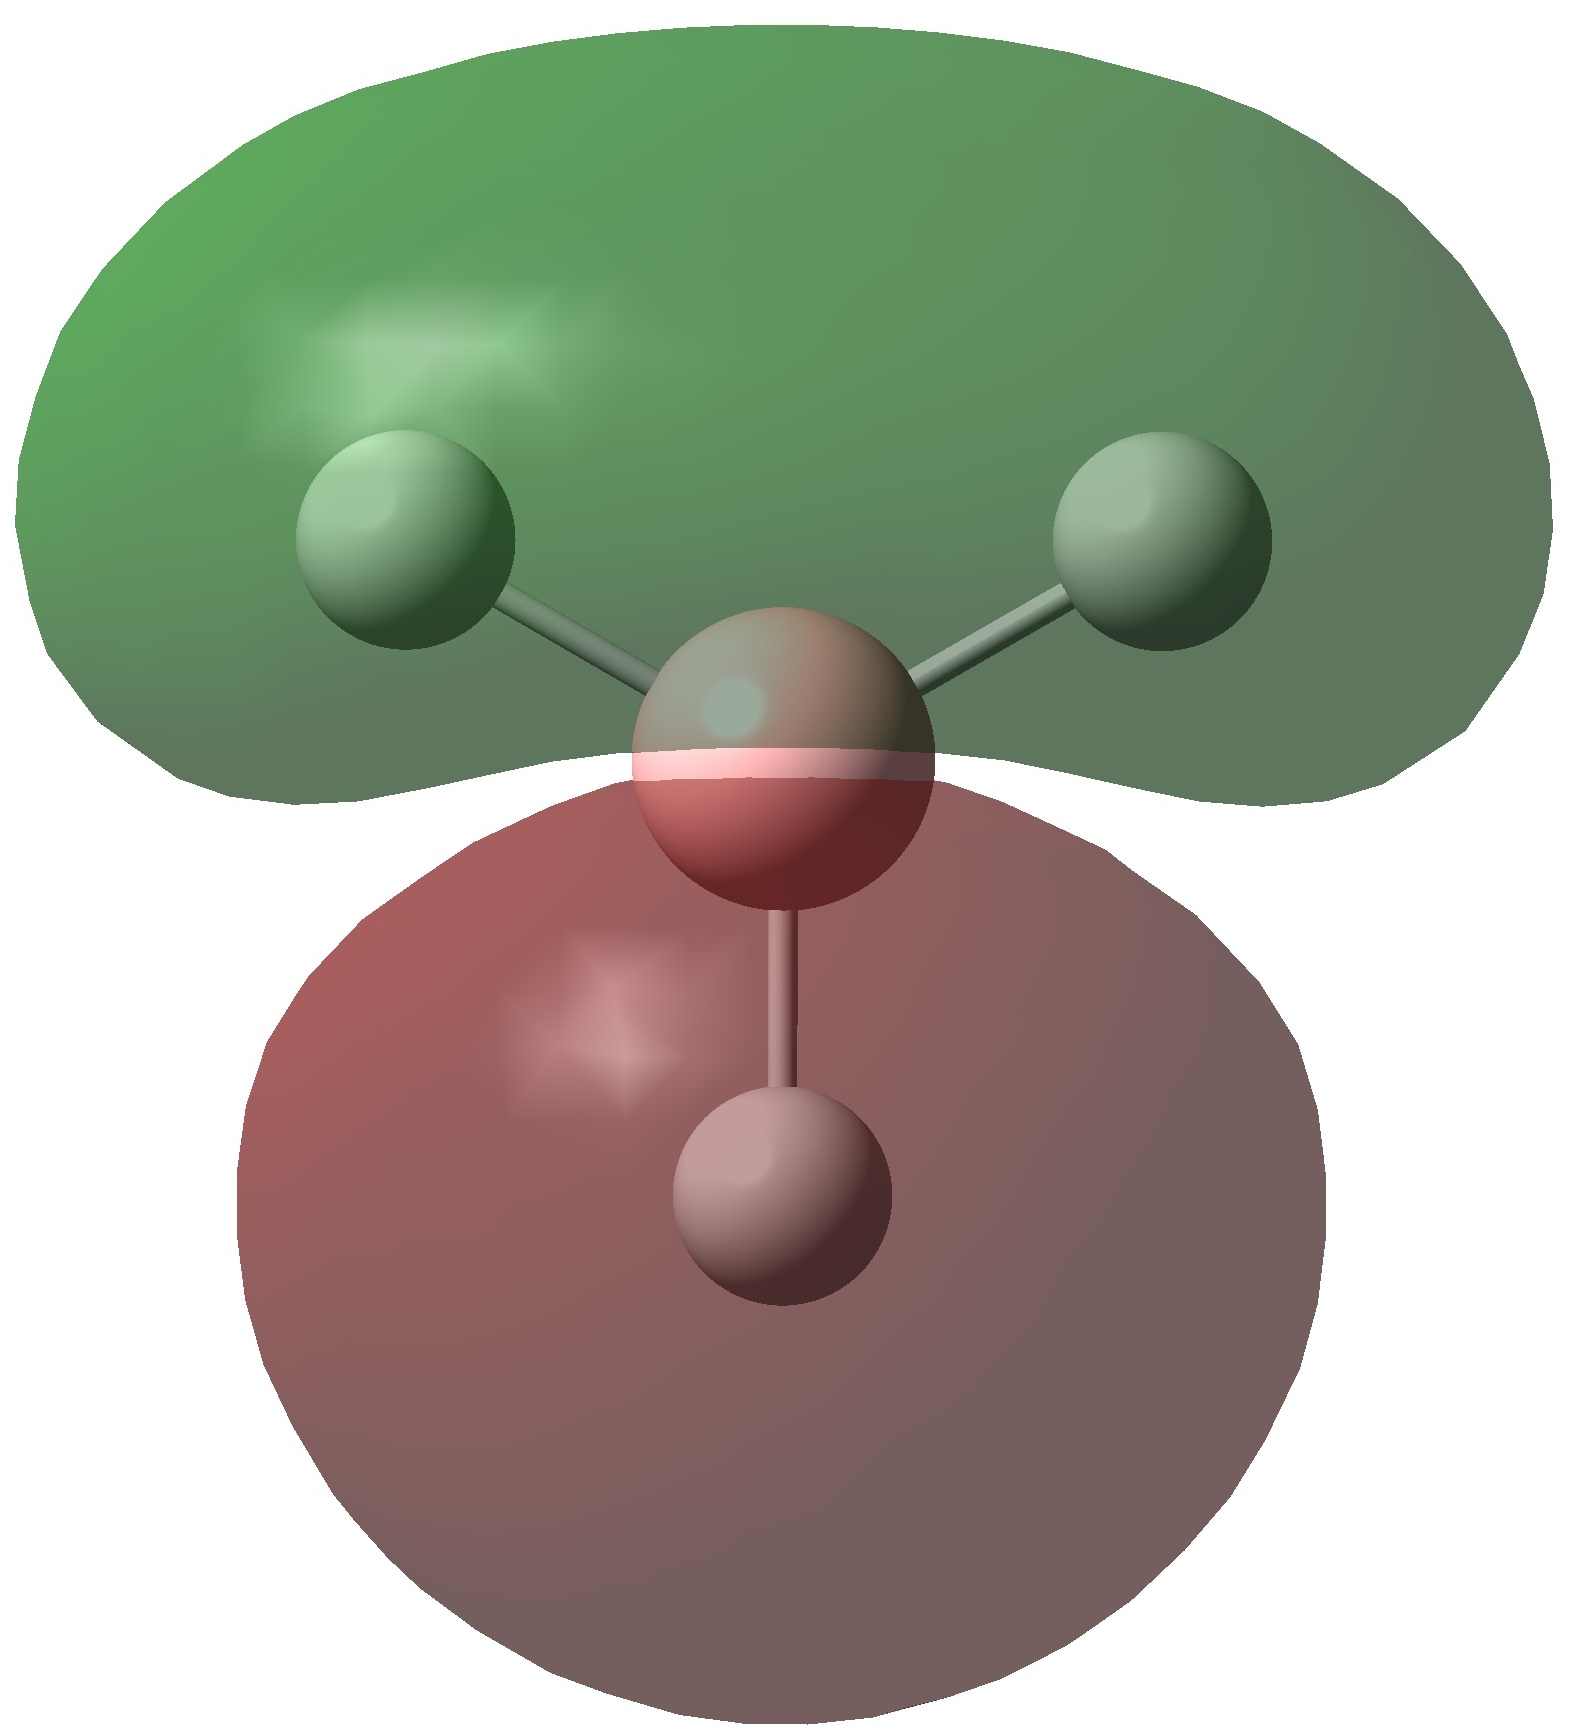
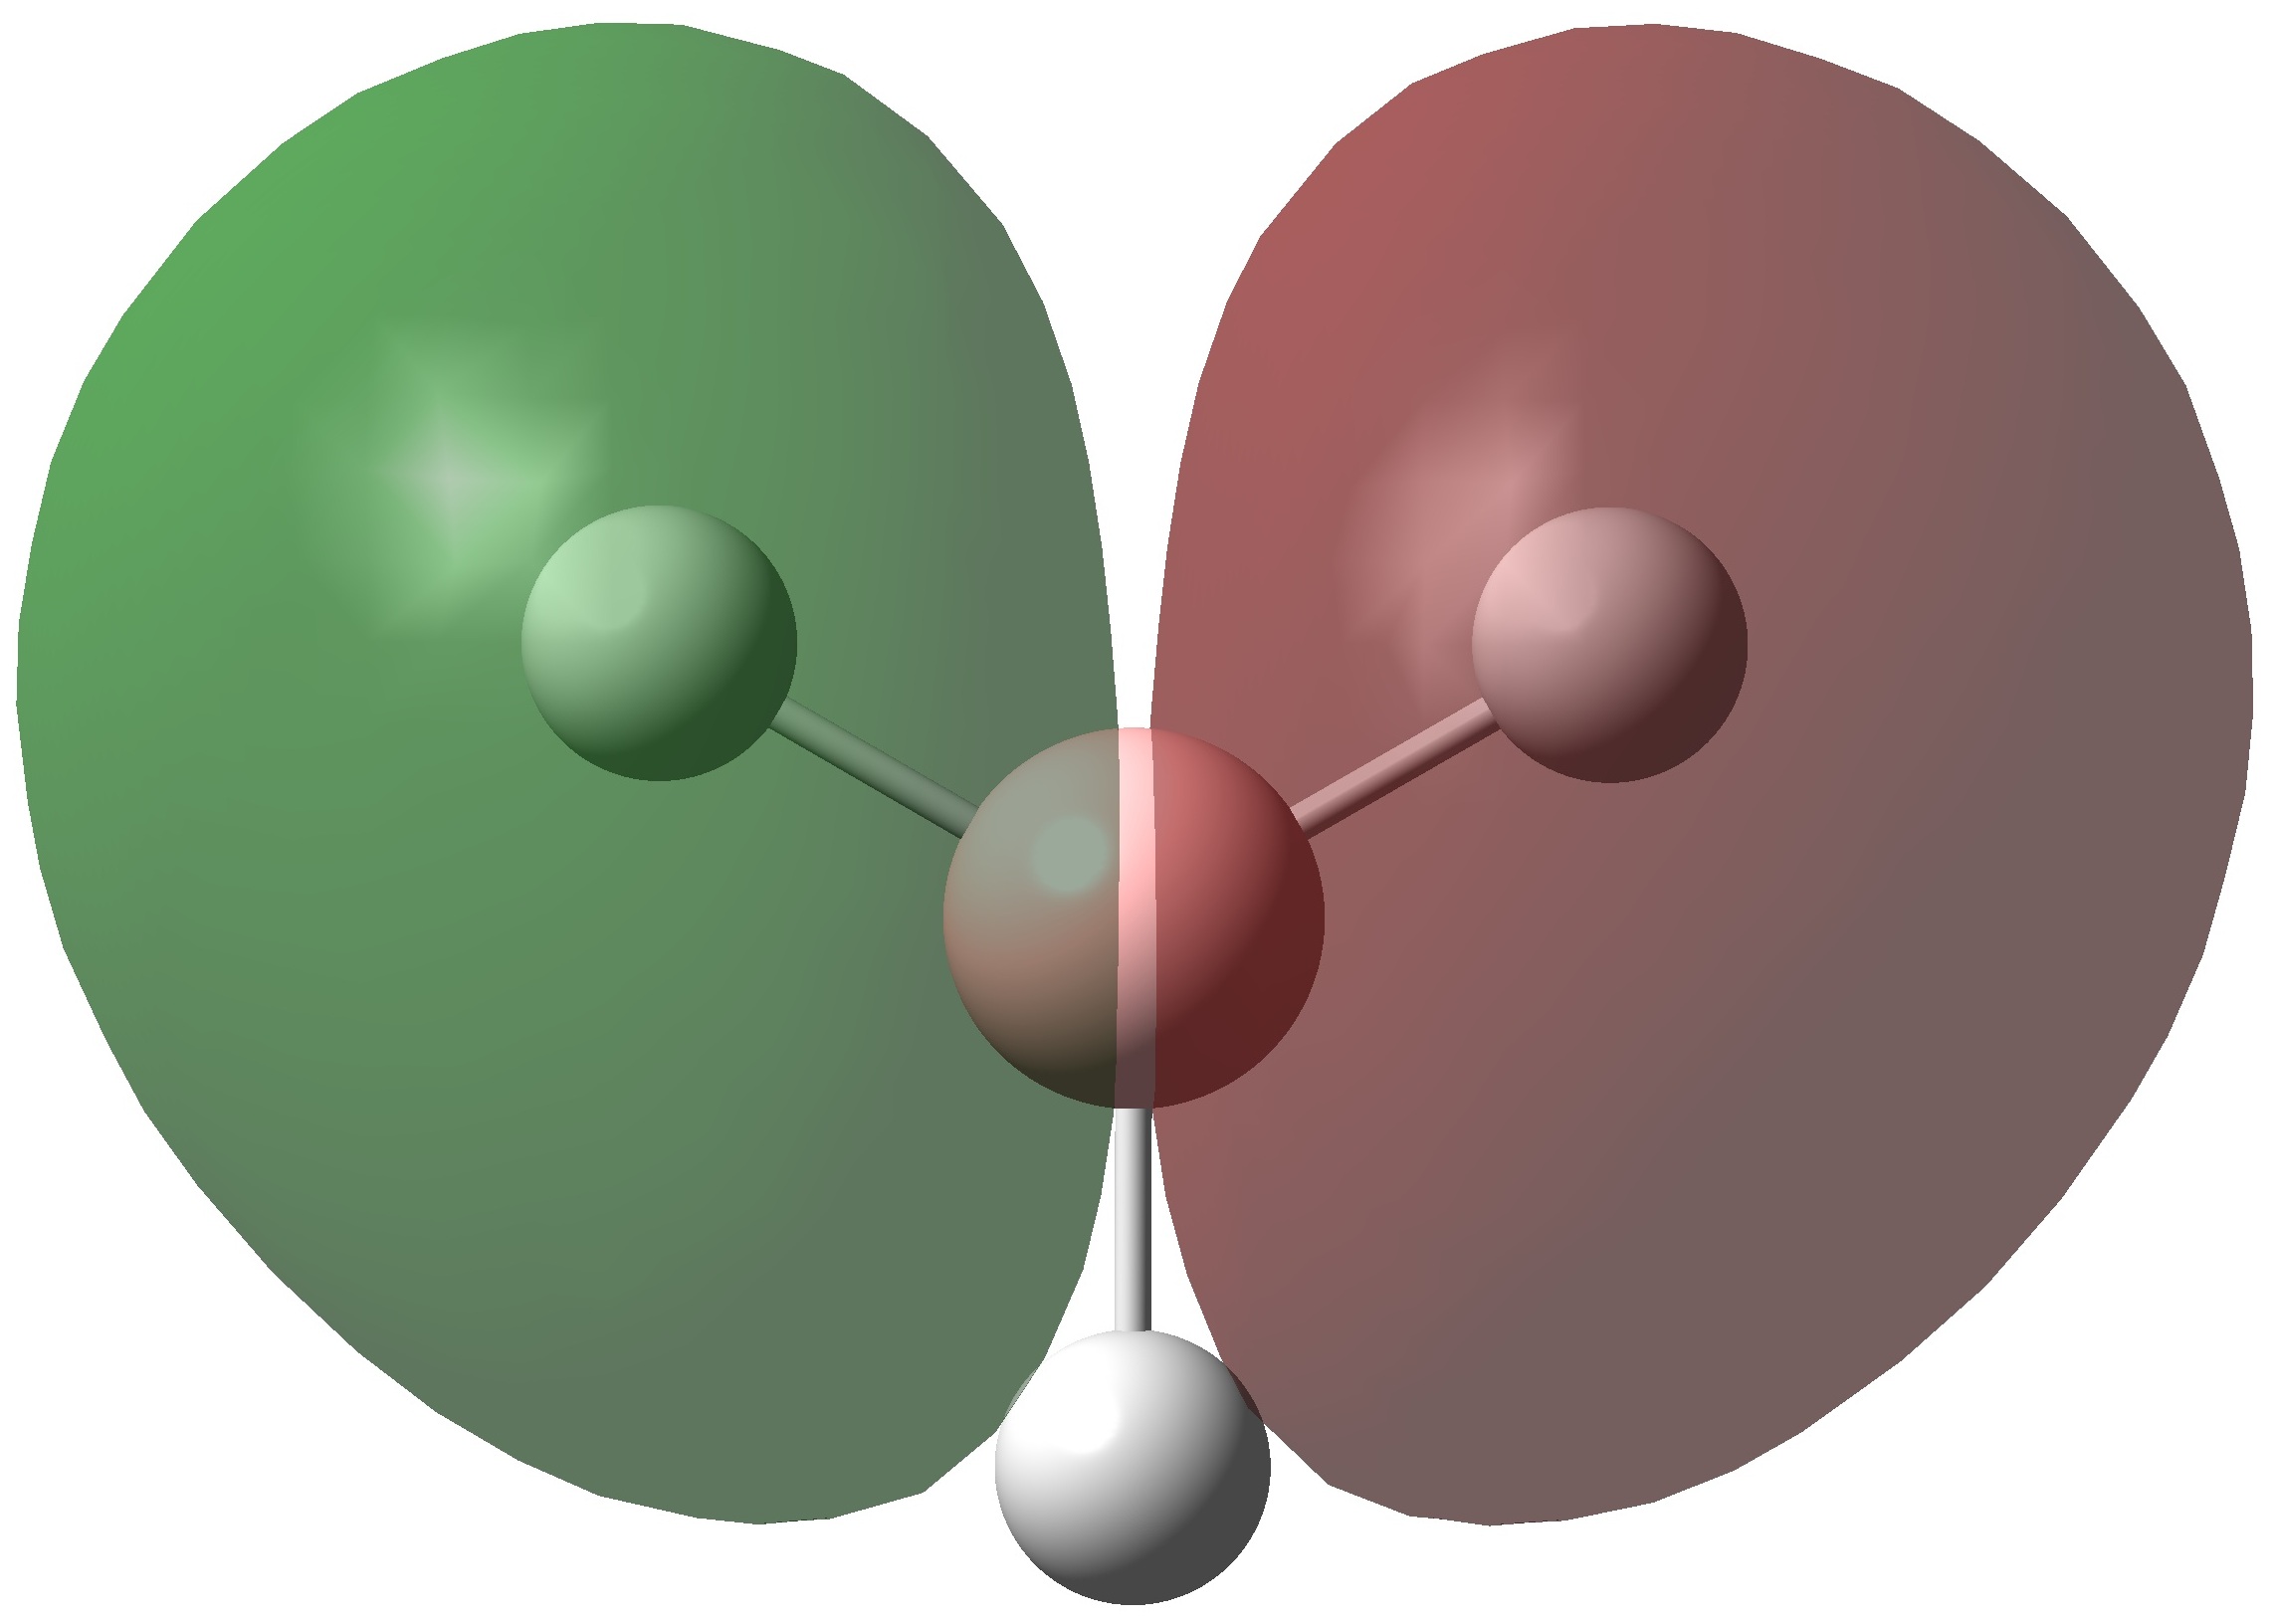
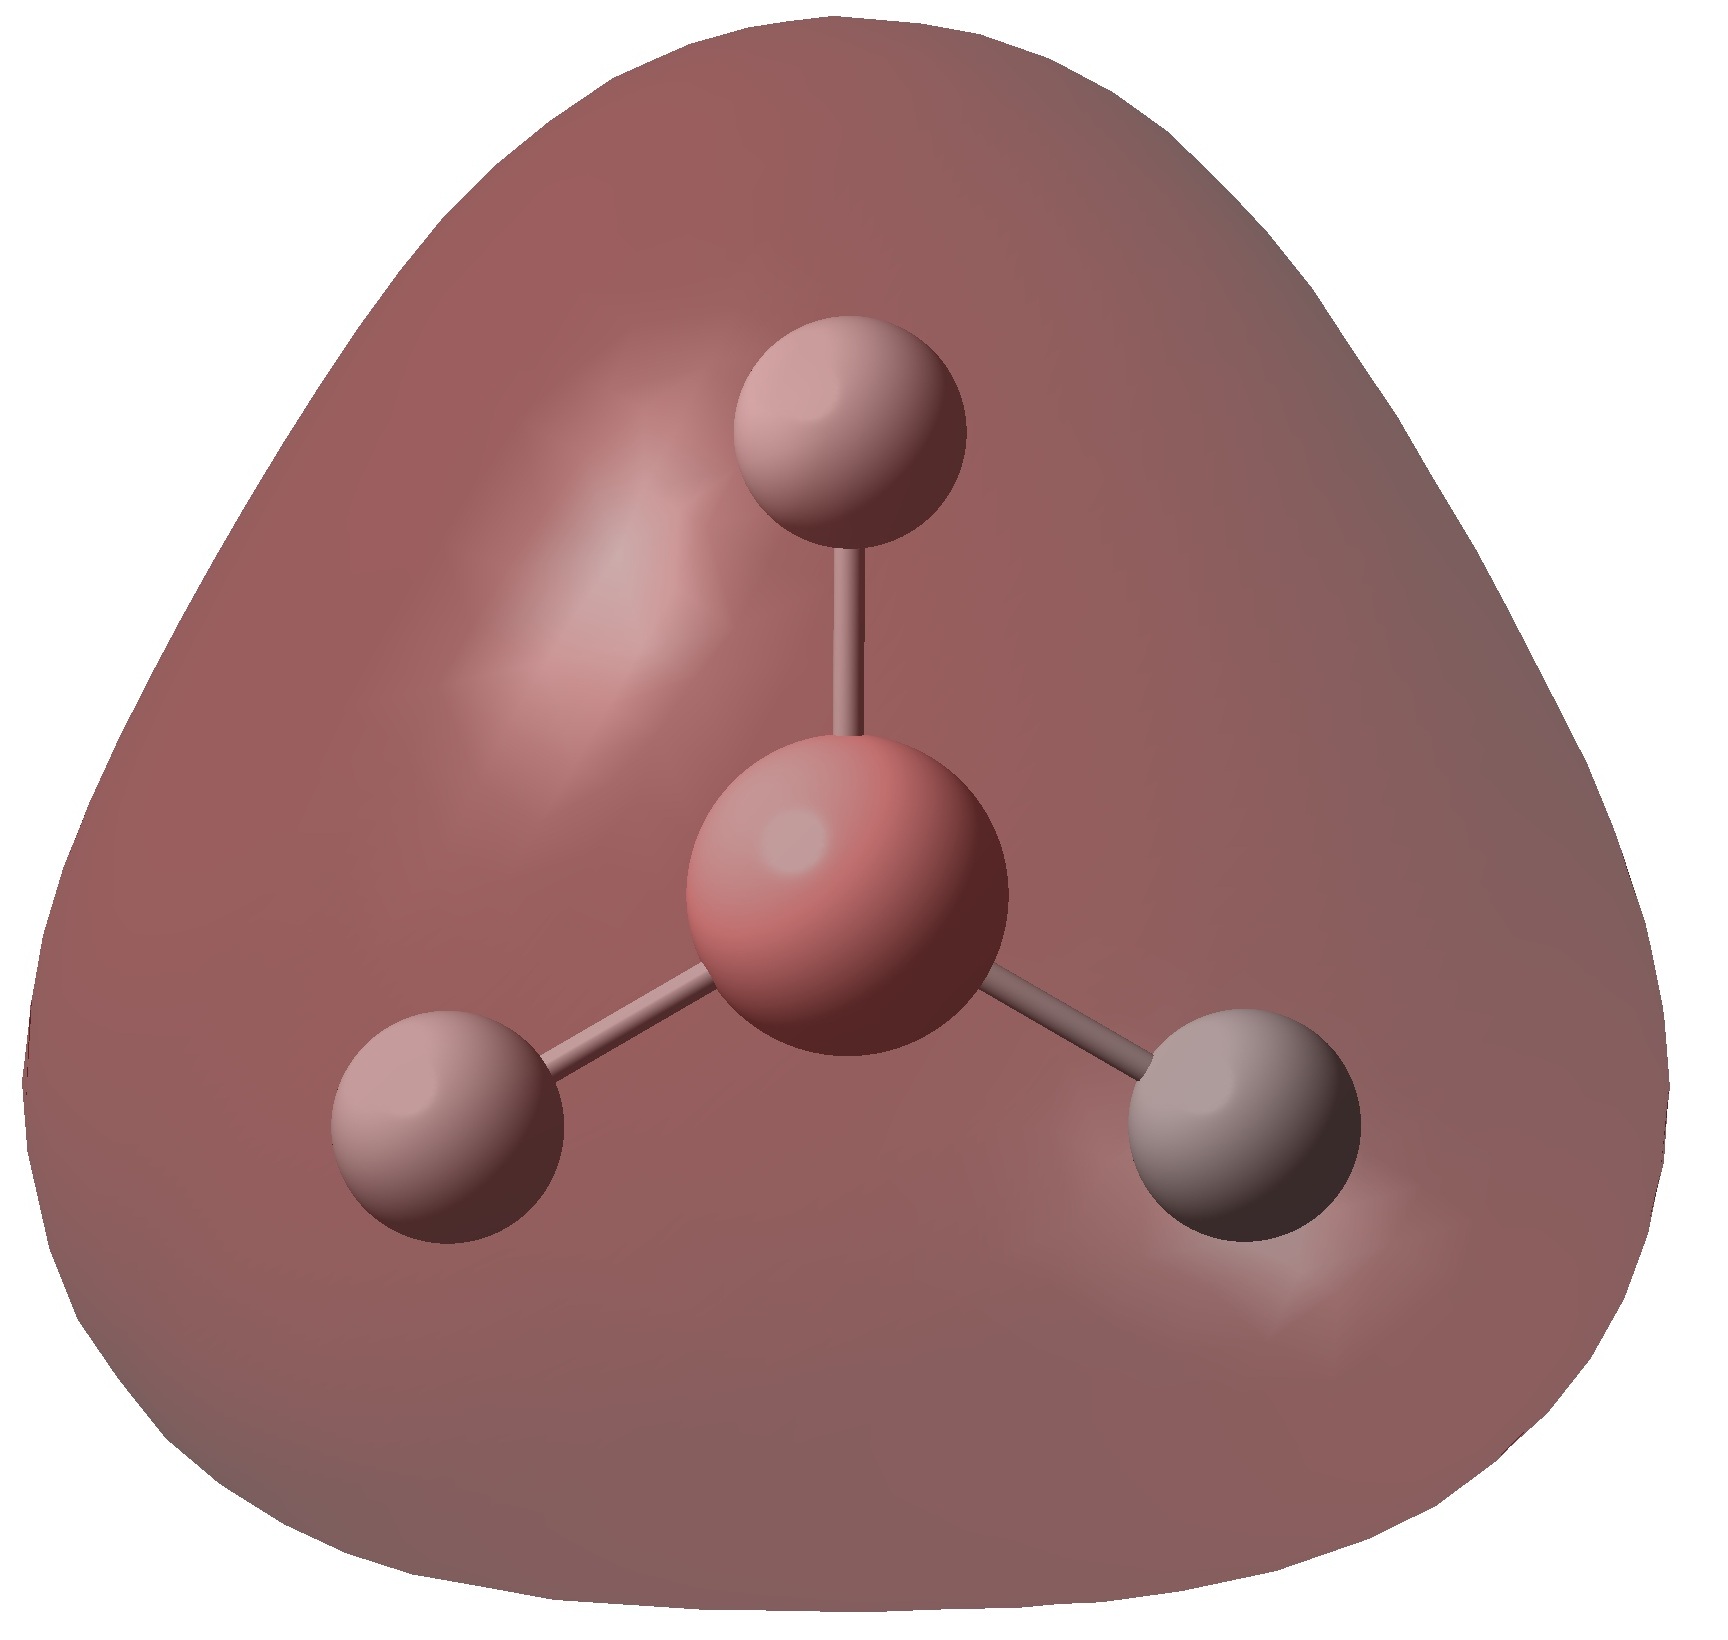
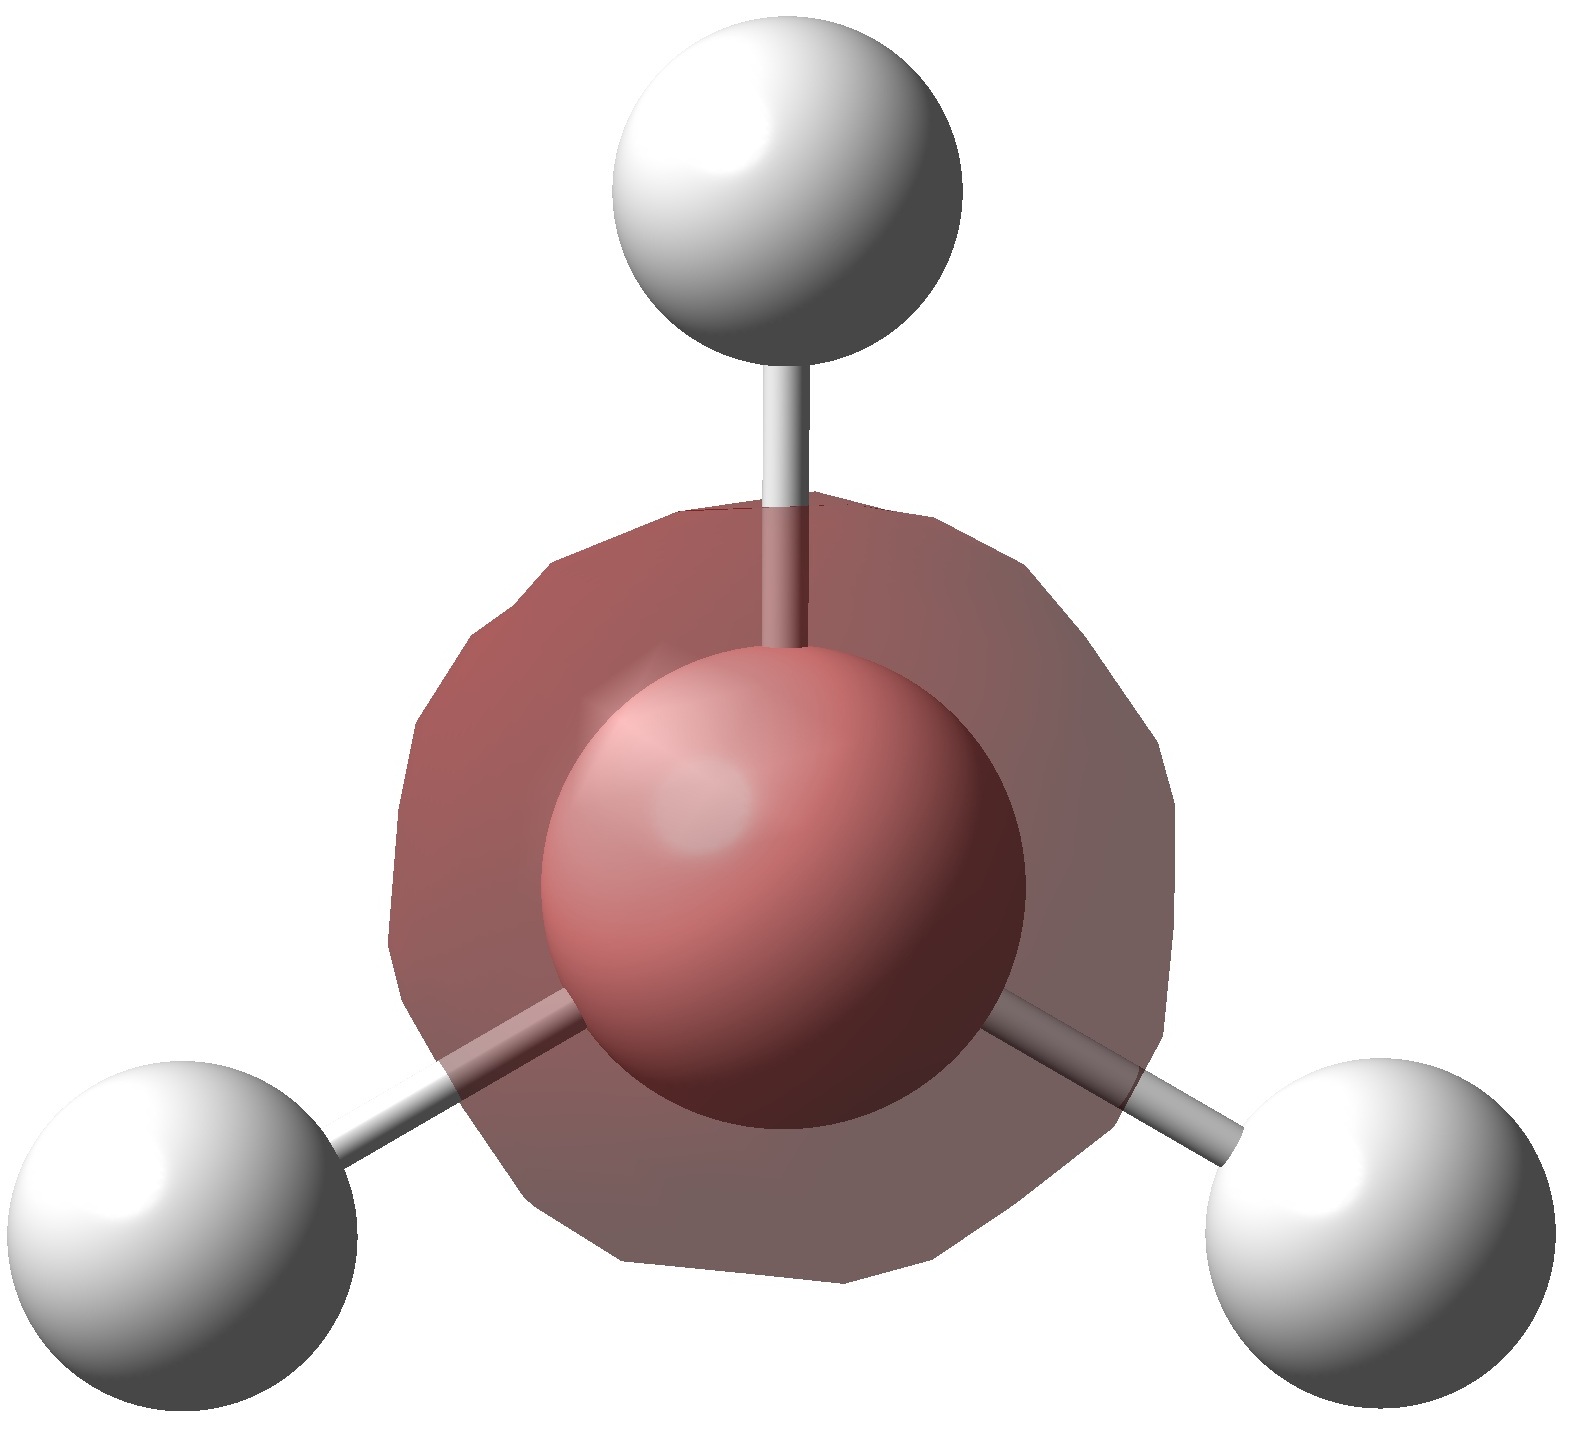
Above is a qualitative MO diagram showing the general arrangement of the orbitals in these structures. The calculated MO's are shown below.
| (H3Si)2O [6] | Me2O [7] | ||
|---|---|---|---|
| MO 1 | 
|

|

|
| MO 2 | 
|

|

|
| MO 3 | 
|

|

|
| MO 4 | 
|

|

|
| MO 5 | 
|

|

|
| MO 6 | 
|

|

|
| MO 7 | 
|

|

|
| MO 8 - HOMO | 
|

|

|
| MO 9 - LUMO | 
|

|

|
| MO 10 | 
|

|

|
The molecular orbitals of the two compounds are shown above. The precise ordering of the lower energy orbitals varies but in general the orbital shapes are very similar and correlate well with the qualitative molecular orbitals. The molecular orbitals for dimethylether (MO 1, 7 and 8) suggest a that there is a bonding interaction between the two carbon nuclei. This can be rationalised as a result of the higher bond angle bringing the two carbon nuclei closer together. This increases the orbital overlap and the interaction between the carbon nuclei, producing MO's with electron density between the two nuclei. No direct evidence is observed for the proposed p-d bond although MO's 7 and 8 do have the correct symmetry for overlap with a d-orbital and so have the potential for this interaction to occur. If this interaction is present in these molecular orbitals it is likely to be a small perturbation to the orbitals predicted in the qualitative MO diagram. The klopman-salem equation states that the stabilisation energy is inversely proportional to the difference in energy between the two orbitals. In this case the energy difference between the HOMO and the Si d-orbitals is likely to be rather large and so the interaction will cause only a small stabilisation of the orbitals.
NBO Analysis
 |
 |
Analysis of the electron distribution shows that the silicon atoms are far more positively charged than carbon. This is due to the high electropositivity of silicon. Oxygen shows a high negative charge for both molecules indicating that the electron distribution is distorted towards the electronegative oxygen atom.
An excerpt from the log files summarising the NBO data for each compound is shown below.
Dimethyl Ether
     (Occupancy)   Bond orbital/ Coefficients/ Hybrids
 ---------------------------------------------------------------------------------

4. (1.99277) BD ( 1) C   1 - O   5
                ( 32.40%)   0.5692* C   1 s( 23.87%)p 3.17( 75.69%)d 0.02(  0.44%)
                                            0.0002  0.4854  0.0558 -0.0008 -0.7260
                                            0.0326  0.0094  0.4746 -0.0588 -0.0018
                                            0.0000  0.0000  0.0000 -0.0515  0.0000
                                            0.0000  0.0247 -0.0331
                ( 67.60%)   0.8222* O   5 s( 28.28%)p 2.53( 71.61%)d 0.00(  0.11%)
                                            0.0000  0.5318  0.0014 -0.0004  0.7062
                                           -0.0208 -0.0020 -0.4655 -0.0143  0.0037
                                            0.0000  0.0000  0.0000 -0.0283  0.0000
                                            0.0000 -0.0026 -0.0166
5. (1.99277) BD ( 1) O   5 - C   6
                ( 67.60%)   0.8222* O   5 s( 28.28%)p 2.53( 71.61%)d 0.00(  0.11%)
                                            0.0000  0.5318  0.0014 -0.0004 -0.7062
                                            0.0208  0.0020 -0.4655 -0.0143  0.0037
                                            0.0000  0.0000  0.0000  0.0283  0.0000
                                            0.0000 -0.0026 -0.0166
                ( 32.40%)   0.5692* C   6 s( 23.87%)p 3.17( 75.69%)d 0.02(  0.44%)
                                            0.0002  0.4854  0.0558 -0.0008  0.7260
                                           -0.0326 -0.0094  0.4746 -0.0588 -0.0018
                                            0.0000  0.0000  0.0000  0.0515  0.0000
                                            0.0000  0.0247 -0.0331
Disiloxane
       (Occupancy)   Bond orbital/ Coefficients/ Hybrids
 ---------------------------------------------------------------------------------
     1. (1.99275) BD ( 1) O   1 -Si   2
                ( 86.54%)   0.9303* O   1 s( 47.26%)p 1.11( 52.69%)d 0.00(  0.05%)
                                            0.0001 -0.6875  0.0009  0.0000  0.7069
                                            0.0106 -0.0005 -0.1646 -0.0007  0.0016
                                            0.0001  0.0000  0.0000  0.0137  0.0000
                                            0.0000 -0.0139  0.0104
                ( 13.46%)   0.3669*Si   2 s( 22.85%)p 3.30( 75.51%)d 0.07(  1.64%)
                                            0.0000  0.0000 -0.4772 -0.0268 -0.0080
                                            0.0000 -0.0001 -0.8537  0.0104 -0.0136
                                            0.0057  0.0000  0.1605  0.0014  0.0105
                                           -0.0001  0.0000 -0.0004  0.0000  0.0000
                                            0.0000  0.0313 -0.0001  0.0001 -0.1059
                                            0.0650
     2. (1.99275) BD ( 1) O   1 -Si   6
                ( 86.54%)   0.9303* O   1 s( 47.26%)p 1.11( 52.69%)d 0.00(  0.05%)
                                           -0.0001  0.6875 -0.0009  0.0000  0.7069
                                            0.0106 -0.0005  0.1646  0.0007 -0.0016
                                           -0.0001  0.0000  0.0000  0.0137  0.0000
                                            0.0000  0.0139 -0.0104
                ( 13.46%)   0.3669*Si   6 s( 22.85%)p 3.30( 75.51%)d 0.07(  1.64%)
                                            0.0000  0.0000  0.4772  0.0268  0.0080
                                            0.0000 -0.0001 -0.8537  0.0104 -0.0136
                                            0.0057  0.0000 -0.1605 -0.0014 -0.0105
                                            0.0001  0.0000  0.0004  0.0000  0.0000
                                            0.0000  0.0313 -0.0001 -0.0001  0.1059
                                           -0.0650
The NBO data confirms that the Si/C-O bond is distorted towards oxygen. This effect is exaggerated in disiloxane where oxygen contributes 86.54% of the bond compared to 67.60% in dimethyl ether both compounds have d character in the bond. However, this is only a very small amount, 0.44% for dimethyl ether and 1.64% for disiloxane. This is strong eveidence in favour of the existence of the p-d bonding in siloxanes. This effect is very small so it is unlikely that this alone can account for the unusual properties of siloxanes. Based on these results the Si-O bond is best described as a highly polarised bond from an sp3 hybridised Si to an sp hybridised oxygen nuclei.
Conclusion
Of the two models proposed to explain the bonding in siloxanes the second is likely to be a better representation. Although there is some evidence from NBO analysis that d-orbitals are involved in bonding, it is a weak effect and is unlikely to be able to fully explain the observed properties of of siloxanes. The better representation is that in which the oxygen lone pairs donate into the σ* orbital of the Si-H bond. This orbital is expected to be lower in energy than the Si d-orbitals and so would have a far stronger interaction with the lone pairs. To further investigate this effect the constituent on the Silyl groups were varied, It was hoped that by varying the electron donating/withdrawing ability of the substituent a greater understanding of this unusual bonding could be gained. It could be predicted that electron withdrawing substituents would increase the positive charge on Si and therefore increase the strength of the bonding interaction whereas electron donating groups would decrease the electrostatic attraction of the electrons to the Si nuclei and hence weken the bond. To test these ideas the hexafluoro-, hexachloro- and hexamthyl- derivatives were studied. Unfortunately the structures did not optimise correctly and the hexamethyl derivative in particular was computationally demanding to calculate. In conclusion, d-orbital participation is unlikley to occur in bonding of siloxanes and the p-σ* model is a more realistic
References
- ↑ J. Glaser, G. Johansson. Acta Chemica Scandinavica 1982, 36A 125-135 DOI:10.3891/acta.chem.scand.36a-0125
- ↑ 2.0 2.1 F. A. Cotton, D. J. Darensbourg, S. Klein, B. W. S. Kolthammer Inorg. Chem., 1982, 21 (1), 294–299 DOI:10.1021/ic00131a055
- ↑ 3.0 3.1 G. Hogarth, T. Norman Inorganica Chimica Acta 1997, 254, 1, 167-171 DOI:10.1016/S0020-1693(96)05133-X Cite error: Invalid
<ref>tag; name "TransMo" defined multiple times with different content - ↑ E. C. Alyea, S. Song, Inorg. Chem. 1995, 34 (15), 3864–3873 DOI:10.1021/ic00119a006
- ↑ CRC Handbook of Chemistry and Physics, 91st Edition, ed. W.M.Haynes, 2011, 9-69 [1]
- ↑ 6.0 6.1 A. Almennigen, O. Bastiansen, V. Ewing, K. Hedberg, M. Traetteberg, Acta. Chem. Scand. 1963, 17, 2455-2460, DOI:10.3891/acta.chem.scand.17-2455
- ↑ K. Vojinovic, U. Losehand, N.W. Mitzel, Dalton Trans. 2004, 16, 2578-2581, DOI:10.1039/B405684A