Rep:Mod2:mathieu08
Module 3
Introduction The aim of this set of computational experiments is to learn and understand how to characterise transition structures (TS) on potential energy surfaces (PES) by use of examples including the cope rearrangement as well as two Diels Alders cyclo addition reactions.
The primary issue with the detection and study of TSs is that there are no longer fitted formulae for the energy, in other words, bonds are being made and broken, thus do not actually exist so the molecular mechanics / force field method previously used to great effect in module 1 can no longer be used. This is because they are unable to describe the changes in bonding and electron distribution within the molecule that correspond with the making and breaking of the bonds. Instead this sections employs a technique which numerically solves the Schroedinger equation by locating TSs based on the local shape of the PES.
The Cope Rearrangment
This tutorial examines the Cope rearrangement of 1,5-hexadiene and uses it as an example of how to study the chemical reactivity of a reaction through transition structure analysis. The Cope rearrangement is illustrated in the diagram below:
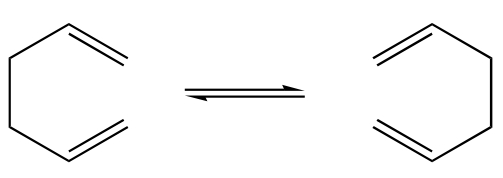
This reaction is an example of a [3,3]-sigmatropic shift rearrangement and has been the centre of much deliberation, primarily as to whether the mechanism it proceeds by occurs in a concerted, stepwise or dissociative manner. It is currently accepted that the reaction proceeds in a concerted fashion via either a "chair" or a higher energy "boat" transition structure. The techniques used to model this computationally are exercised in this tutorial and the results are illustrated in the following section.
Optimisation: HF method/3-21g basis set, this is a low accuracy basis set which gives rise to fairly inaccurate approximations of the experimental data.
The Total energy from the 1st optimisation of the anti hexadiene conformer was: -231.69260236 a.u.
The Point group of the anti conformer was - C2
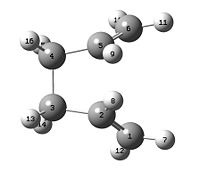
This is the anti1 conformer from comparison of the energy and point group with the data in the appendix 1 table who's structure is illustrated in the jmol below:
Anti1 1,5-hexadiene
The gauche conformer is expected to have a higher total energy than the anti conformer as it appears to have more steric interaction upon brief observation of the two molecules.
The total energy from the optimised gauche hexadiene conformer was: -231.69266120 a.u.
The Point group of this gauche conformer is: C1
This value is marginally smaller than that obtained for the anti structure. This observation is opposite to what was expected insomuch that there is seemingly less steric repulsion in the gauche structure giving it a lower total energy than the anti1 conformation.
Comparison of the total energy and the point group with the data in the appendix 1 table elucidates that this is the gauche3 conformer. The structure of which is illustrated in the jmol below:
Gauche3 1,5-hexadiene
It was believed that the anti C2 conformation would still give the most stable conformation with lowest energy despite the earlier gauche3 conformer giving a more stable molecule of hexadiene than the initially calculated anti1 conformer.
The anti conformer proposed was the anti2 conformer from the appendix table with Total Energy: -231.69253528 a.u. and Point Group: Ci. This Total energy matches that provided in the table for the anti2 conformer to 5 decimal places in accuracy, likewise the point group is also in accord with that provided for the anti2 conformer in the table within appendix 1. Comparison of the structure also shows that the molecules are identical, therefore it is fair to assume that these are the same molecules.
The table data for the anti2 conformer is displayed here for reference and a jmol is provided below to illustrate the structure of the anti2 conformer: Point group: Ci, Total Energy: -231.69254
Anti2 1,5-hexadiene
Observation of the table at the bottom of the instruction page shows that the C1 gauche conformer is in fact the most stable hexadiene structure. This would normally be explained due to the 1,3 stabilising attractions between the hydrogen atoms attached to these carbons (known as the gecko effect by Henry Rzepa); however, the distance separating the key hydrogen atoms remains unchanged between the anti and gauche conformers. This leaves the reason for the increased stability of the gauche conformer unknown. Incidentally the first structure obtained for the gauche conformation is the most stable gauche3 conformer. This therefore, is the reference structure that would be used in the determination of the activation energy for the relevant reaction (Cope rearrangement in this case).
After conformation that the optimisation of the anti2 conformer using the 3-21g level of theory matched that in the appendix 1 table; the energy of the DFT/B3LYP 6-31g basis set optimised anti2 was found to be: -234.55970424 a.u., lower and therefore more stable than that of the optimised structure using the 3-21g basis set. This is because the 6-31g basis set is more advanced than the 3-21g level of theory thus performs a more accurate calculation giving data closer in value to that of the experimental data.
The table below illustrates the difference in structure of the anti2 molecule calculated as the two levels of theory.
| Method used | 3-21g optimisation | 6-31g optimisation | ||||
| Structure | ||||||
| 4 Central carbom atoms (dihedral) (o) | 179.995 | 180.00 | ||||
| End alkenes (o) | 124.808 & 124.810 | 125.208 & 125.208 | ||||
| 4 left carbon atoms (dihedral) (o) | -114.698 | -118.776 | ||||
| 4 right carbon atoms (dihedral) (o) | 114.673 | 118.775 |
This table highlights that the geometry of the conformers actually changes very little between the two different levels of theory despite a significant difference in Total energy for the two.
N.B. It was forgotten to select d in the optimisation using the 6-31g level of theory for the above anti2 conformer so a repeat of this calculation was run in which d was selected giving the following total energy for the same conformer: -234.61171035 a.u.,and the same point group - Ci as produced earlier. This is again lower in energy than the originally optimised structure and perhaps might account for the fact that the boat transition structure was not immediately derived until further structural alterations in the following section.
The frequency data of the anti2 conformer was calculated to characterise the turning point that has been approached on the PES. This is confirmed to be a minimum when only real and no imaginary frequencies are obtained. N.b. Imaginary frequencies relate to those vibrations that would lower the energy of the molecule under study if the atoms were to follow these motions. The low frequency data is provided below and the IR spectrum is supplied in the thumbnail alongside:
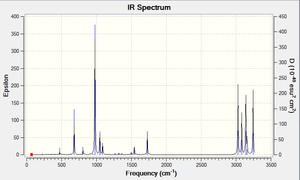
low frequency data: Low frequencies --- -9.3645 0.0006 0.0006 0.0007 3.6221 13.1700 Low frequencies --- 71.9003 79.9172 116.8581
It is clear that there is on imaginary frequency; however, this is so low in frequency that it can be ignored and therefore assumed that a minimum has been reached.
Thermochemistry: the desired energies are provided below:
Summary of energies (in hartree)
| Electronic Energy | Sum of electronic and zero-point energies [0 K] | Sum of electronic and thermal energies [298.15 K & 1 atm] | Sum of electronic and thermal Enthalpies [RT(H= E + RT)] | Sum of electronic and thermal Free Energies [(G=H-TS)] | |
| Reactant: Anti2 hexadiene | -234.55970424 | -234.416244 | -234.408954 | -234.408010 | -234.447849 |
| Discussion | - | the potential energy at 0 K including the zero-point vibrational energy (E = Eelec + ZPE) | the energy at 298.15 K and 1 atm of pressure which includes contributions from the translational, rotational, and vibrational energy modes at this temperature (E = E + Evib + Erot + Etrans) | the additional correction for RT (H = E + RT) which is particularly important when looking at dissociation reactions | the entropic contribution to the free energy (G = H - TS) |
N.B.
*1 hartree = 627.509 kcal/mol
The first of these is the potential energy at 0 K including the zero-point vibrational energy (E = Eelec + ZPE), the second is the energy at 298.15 K and 1 atm of pressure which includes contributions from the translational, rotational, and vibrational energy modes at this temperature (E = E + Evib + Erot + Etrans), the third contains an additional correction for RT (H = E + RT) which is particularly important when looking at dissociation reactions, and the last includes the entropic contribution to the free energy (G = H - TS).
It was attempted to re-calculate these corrections at 0 K by following the advanced tutorial using the Freq=ReadIsotopes method; however, it repeatedly failed to produce any results.
Optimising the "chair" and "boat" transition structures
This section involves setting up a transition state structure optimisation to determine the transition structures in the cope rearrangement; achieved by computing the force constants at the beginning of the calculation, using the redundant coordinate editor, coupled with the QST2 method. The reaction coordinate will be visualized and the IRC will be run. The activation energies for the Cope rearrangement via the "chair" and "boat" transition states will also be calculated using the thermochemistry data for each TS.
Background theory for the chair TS determination
The main issue with TS optimisations is that the calculation needs to know where the negative direction of curvature (i.e. reaction coordinate) is located. If the guessed TS structure geometry is reasonable, then the most effective way to calculate the TS is to cpmute the force constant matric (aka Hessian) in the first step of the optimisation. This geometry will be updated as the optimisation proceeds. Incidentally, if the geometry of the guess TS is far from the exact structure then this method is likely to fail as the curvature of the PES may be significantly different at points far removed from the TS.
Alternatively, in some cases a better TS can be generated by freezing the reaction coordinates (for atoms between which the new bonds will form which in this example means the terminal carbons) using opt=Modredundent to optimise to a minimum. Once optimised, the reaction coordinate can be freed, and TS optimisation run to determine the TS. This method gives a better initial guess and therefore, it is not always necessary to compute the whole Hessian.
The necessary allyl molecule for the construction of the TS were produced as follows:
Initially, the structure of the allyl was produced in gaussview and optimised using the HF/3-21G level of theory, the result is illustrated below:

This structure was duplicated and the bond separation between the terminal carbons was set to 2.2 Angstroms to give the chair conformer of the transition state with C2h symmetry.
Having created the chair conformer of the transition state it will now be optimised manually via two different procedures which are demonstrated in the ensuing sections:
The procedure of the first method explained in the introduction is applied in this brief section:
The structure is optimised to a TS (TSberny), selecting to calculate the force constants once (opt=calcfc) and the frequency analysis was calculated using the Hartree Fock 3-21g level of theory. By selecting to calculate the force constants once, this in effect tells the programme to traverse/ scan the PES to look for a maxima with only one negative force constant corresponding to one imaginary frequency.
The energy of the TS Berny optimised structure was found to equal -231.619322 Hartree with C2h symmetry and the structure is animated below:
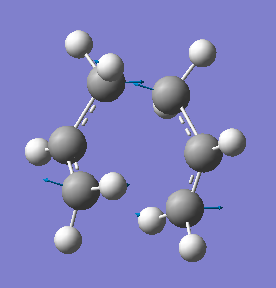
The vibrational analysis highlighted the presence of one imaginary frequency. The vibration shown is that with a frequency of -818 cm-1 and can be seen to simulate the cope rearrangement bond formation and breaking, whereby the terminal carbons move towards and away from one another simultaneously (asynchronously) at opposite ends of the transition state. This provides sufficient proof to confirm that the correct TS has been detected.
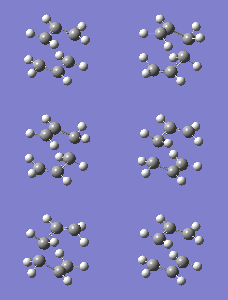
The alternative frozen coordinate method for optimising the chair TS is displayed below in this brief section:
For this procedure the duplicated allyl structure was reopened, the terminal carbons (those between which the bonds will form) of the butadiene and the ethylene molecules must then be selected and the distance separating them is set to 2.2 Å. This forzen structure is optimised to a minimum, again using the Hartree Fock 3-21g level of theory, ensuring to insert opt=Modredundent into the input file. Once this calculation has proceeded, it is then necessary to free the terminal carbons so their separation can be changed. This structure is then optimised to a TS using the TSberny optimisation ensuring to calculate the force constants 'never'.
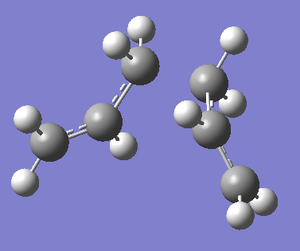
An incorrect transition state was produced upon the second optimisation which is illustrated in the thumbnail alongside. This issue was remedied by altering the optimisation from a minimum to a transition state, TS berny to be precise. The correct final optimised structure of the chair transition state was derived via the frozen coordinate method and is displayed below:
Frequency analysis of the frozen coordinate transition state structure gave the same imaginary absorption frequency as detected earlier, representative of the bond making and breaking observed in the cope rearrangement as the TS Berny method produced.
The TS Berny strcuture gave a bond separation of: 2.01937 Angstroms [2.02 (2dp)] meanwhile the frozen coordinate method gave the following bond separation: 2.01989 Angstroms [2.02 (2dp)]. The bond separation coupled with a comparison of the energies; -231.6193220 Hartree for the TS Berny method versus -231.6192197 Hartree for the Frozen coordinate method supplies enough information to assume that these structures are effectively identical.
Boat
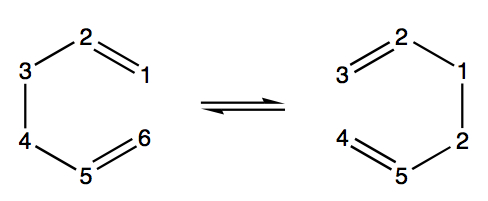
A different approach must be adopted to determine the optimised boat transition structure. Using the QST2 method, the calculation interpolates between two structures, in this case the reactant and the product to try and find the TS between them. To ensure this procedure works, one must make sure that the reactant and product are numbered in the same way, especially as both reactant and product are 1,5-hexadiene; the numbering as shown in the diagram below is changed manually.
As expected, the initial QST2 Hartree Fock calculation using the 3-21g basis set fails because it is unable to realise that the top allyl fragment can be rotated, therefore simply producing what appears to look like a more dissociated form of the chair transition structure. It is evident that this method will continue to fail to locate the boat transition structure from these reactant and product structures.
To assist the QST2 calculation, the structures of the reactant and the product must be altered to better simulate the boat transition state structure; essential for a successful calculation. This was done manually by altering the dihedral angles of the central 4 carbon atoms to zero degrees (i.e. C2-C3-C4-C5 = 0o). The inside C-C-C were then selected (i.e. C2-C3-C4 and C3-C4-C5) and the angle reduced to 100o to give the following two structures:
| Reactant | Product |

The first QST2 optimisation of these structures to determine the boat transition structure failed to give the correct conformation, instead producing a twist boat conformation as shown in the thumbnail alongside.
This issue was fixed by significantly decreasing the distance separating the terminal carbons on each of the 1,5-hexadiene chains shown above. This was done in the hope of again better simulating the boat transition state structure, therefore providing the calculation with a better starting point to approach the correct maximum for the transition state structure. The desired structure is shown below in which the boat TS is seen to posses C2v symmetry and has a total energy of -231.60280221 a.u.:
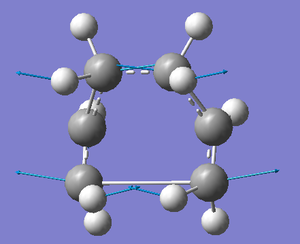
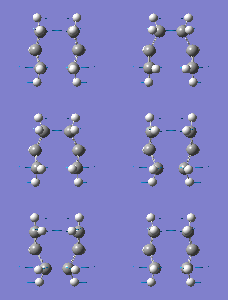
To confirm that this is the correct structure, the imaginary vibration with frequency 840 cm-1 representative of the motion which occurs in the making and breaking of bonds in the transition state is animated below and the displacement vectors are shown alongside in a thumbnail:
Note that the thermochemistry data was collected from the frequency analysis of both the chair and boat TSs for later use in activation energy calculations.
Optimised Transition structures
Both chair and boat TSs were optimised using two levels of theory. The TS for each was first arrived at using the 3-21g basis set and once this TS was achieved, it was further optimised using the more rigorous 6-31g(d) basis set which provides a more accurate calculation.
| HF/3-21G chair TS | B3LYP/6-31G* chair TS | HF/3-21G boat TS | B3LYP/6-31G* boat TS | |||||||||
| Optimised Structure | ||||||||||||
| Terminal C-C bond length (Å) | 2.02 (C5-C10 or C3-C14) | 1.97 (C5-C10 or C3-C14) | 2.14 (C3-C4 or C1-C6) | 2.21 (C3-C4 or C1-C6) | ||||||||
| Allyl Fragment angle | 121 o (C3-C1-C5) | 120 o (C3-C1-C5) | 122 o (C4-C5-C6) | 122 o (C4-C5-C6) | ||||||||
| Dihedral angle between Allyl fragments | 55 o (C1-C3-C14-C11) | 54 o (C1-C3-C14-C11) | 0 o (C2-C1-C6-C5) | 0 o (C2-C1-C6-C5) |
These vibrations are in accord with those produced earlier with the 3-21g level of theory, allowing us to confirm that the 3'21g basis set possesses sufficient accuracy to perform these calculations. It is however noticeable, that a discrepancy does occur between the total energies of the TSs and the frequencies at which the imaginary vibrations occur.
Intrinsic Reaction Coordinate
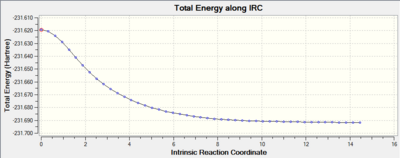
It is virtually impossible to determine the structure of the product from the shape of the transition structures, hence for this cope rearrangement it is not possible to distinguish which 1,5-hexadiene conformer will be formed from each of the transition structures. Fortunately, gauusview has a tool which can assist this exact process called the Intrinsic Reaction Coordinate (IRC). This programme detects the potential products by traversing the Potential Energy Surface (PES) from the energy corresponding with the transition strcutures (maximum). The programme follows the minimum energy path down to the local minmum by creating a series of points (producing corresponding structures for each) by taking small steps (alterations in geometry) in the direction where the gradient of the energy surface is steepest. Note that in this case, we have told the programme to go forwards only.
The first attempt at the IRC calculation was performed selecting to calculate force constants only once, meanwhile in the second attempt, the force constantS were calculated throughout the procedure. The first attempt failed to find a minimum; however, the second attempt did, hence giving us a conformation of the 1,5-hexadiene product formed from the chair transition state. The table below displays the data for the two procedures:
If we compare the data acquired for the final structure (from the calculation in which the force constants were always calculated) with that in the table supplied in appendix 1; we notice that the product is in fact the gauche2 structure, with Total energy: -231.69166 a.u. and point group: C2.
The gradient curve is simply the differential of the Total Energy curve and shows us that a minimum was not reached in the first attempt as the gradient never reaches zero, meanwhile in the second attempt the gradient does approach zero, indicative of a minimum. We cannot be sure that the exact product is deduced since there could be other minima which are simply less local to the transition structure; however, it is a fairly accurate approximation.
The IRC technique was again applied to the boat TS whereby observation of the final structure showed that the product had C1 symmetry and a Total energy of -231.69266101 a.u. .The gradient reached by the calculation was 0.00002797 so it can be assumed that a minimum and hence the product has been detected. Comparison of the data given for this final conformation with that supplied in the table within appendix 1 shows that the product derived from the boat TS is the gauche3 hexadiene conformer.
Activation Energy Calculations
To calculate the activation energy for both TSs, we need to find the difference in energy between each TS and the reactant. The reactant is the anti2 conformer of 1,5-hexadiene and the TS are either the chair or boat. The thermochemistry data for the anti2 conformer and the chair and boat TSs was extracted from the frequency calculation log file in order to deduce the activation energies for both TSs at 0 K. The sum of the electronic and zero-point energies are the energies required to perform the necessary calculation to derive the Activation energies at 0 K. It was deemed relatively pointless to determine the activation energy again at 298.15 K using the Sum of electronic and thermal energies despite this giving a more accurate results since the aim of this exercise is to differentiate between the accuracy of the two levels of theory. The results are displayed for both basis sets respectively in the tables below.
| Level of Theory | HF/3-21g | ||||
| Electronic Energy | Sum of electronic and zero-point energies | Activation energy (Hartree) | Activation energy (kcal/mol) | Experimental Activation energy (kcal/mol) | |
| Chair TS | -231.61932200 | -231.466692 | 0.072847 | 45.712148 | 33.5 ± 0.5 |
| Boat TS | -231.60280221 | -231.450932 | 0.088607 | 55.601690 | 44.7 ± 2.0 |
| Reactant (anti2) | -231.69253528 | -231.539539 | |||
| Level of Theory | B3LYP/6-31g* | ||||
| Electronic Energy | Sum of electronic and zero-point energies | Activation energy (Hartree) | Activation energy (kcal/mol) | Experimental Activation energy (kcal/mol) | |
| Chair TS | -234.55698263 | -234.414928 | 0.054275 | 34.434556 | 33.5 ± 0.5 |
| Boat TS | -234.54309304 | -234.402339 | 0.066964 | 41.995776 | 44.7 ± 2.0 |
| Reactant (anti2) | -234.55970424 | -234.469203 | |||
Comparison of the data highlights that the activation energies calculated using the lower level of theory are all significantly overestimated. However, the calculations using the higher level of theory, despite being very slightly conservative are in good agreement with the experimental values. This proves that the higher level of theory does in fact increase the accuracy of the calculations. Note that the Boat TS is higher in energy than the chair TS and consequently has a higher activation energy. Coupling the activation energy data with that acquired from the IRC analysis, we can deduce that the Chair TS path is the kinetically governed path along which the reaction can proceed giving rise to the Gauche2 conformer. On the other hand the Boat TS path provides the thermodynamic route for the reaction giving rise to the more thermodynamically stable Gauche3 conformer.
The Diels Alder Cycloaddition
The Diels Alder reaction under study involves the formation of cyclehexene from butadiene (diene) and ethylene (dienophile) as shown in the reaction scheme below:

Preparation for the formation of the TS was performed by optimising the geometry of both the cis-butadiene and ehtylene molecules. The AM1 semi-empirical method was used for the optimisation of both structures and the HOMO and LUMO of both molecules were obtained and are displayed in the table below. These molecular orbitals (MOs) are fundamentally important to the diels alder reaction as it is these which dictate how the reaction will proceed. The principal orbital interactions involve the π/ π* orbitals of ethylene and the HOMO & LUMO of butadiene. This reaction is referred to as [4s + 2s] since there are 4 π orbitals in butadiene's π system and 2 π orbitals in ethylene's π system.
The s denotes the symmetry of the orbital systems where s is symmetric and a is anti-symmetric. Symmetry is determined by reflection down what is in effect the σh plane in the molecule. The HOMO of ethylene and the LUMO of butadiene are both s and the LUMO of ehtylene and the HOMO of butadiene are both a. Therefore it is the HOMO-LUMO pairs of orbitals which interact in this reaction..
| Reactant | MO label | MO Image | Symmetry | Energy (a.u.) |
| cis-butadiene | LUMO | 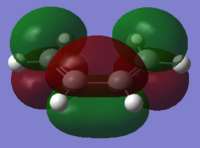 |
Symmetric | 0.01718 |
| cis-butadiene | HOMO | 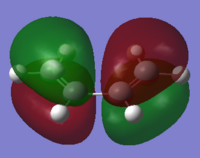 |
Anti symmetric | -0.34382 |
| ethylene | LUMO | 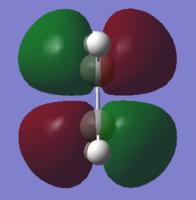 |
Anti-symmetric | 0.05284 |
| ethylene | HOMO | 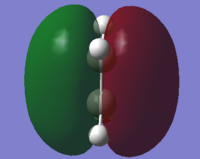 |
Symmetric | -0.38775 |
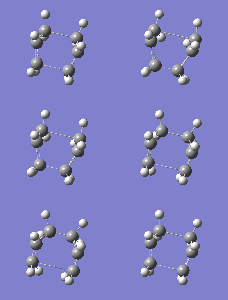
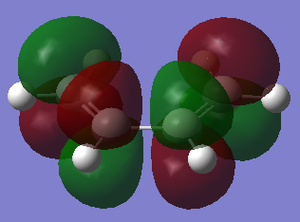
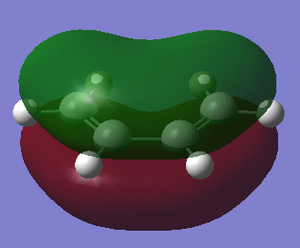
In addition to the HOMO and LUMO orbitals, the HOMO-2 and LUMO+1 orbitals are shown in the thumbnails alongside as they are particularly interesting. These orbitals elegantly display the π bonding character present in butadiene whereby both sets of orbitals are anti-symmetric.
Formation of the Transition State
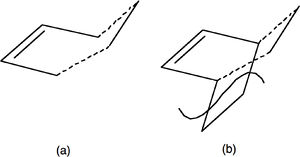
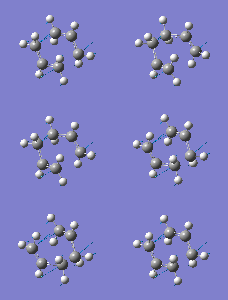
The transition structure for the Diels Alder reaction was determined using the frozen coordinate method as follows. Note that all calculations in this section were performed using the AM1 semi-empirical molecular orbital method. Firstly, both the optimised butadiene and ethylene molecules were inserted into a new page and orientated such that they represented the envelope conformation of the Diels Alder transition state as shown in the thumbnail alongside. An initial optimisation to a minimum was calculated on this transition structure guess, in which the terminal carbons of both molecules (between which bonds were being formed) were frozen with a bond separation of 2.2 Å. Once this structure had been optimised, a further optimisation was run on the new structure; however, this time the optimisation was to a transition state (TSberny method) and the terminal carbons were now unrestricted, thus allowing the bond separation to change.
The initial TS optimisation failed, this can be explained by considering the vibrations of the molecule. The molecule has 3N-6 normal modes, each of which gives rise to a independent orthogonal vibration within the molecule. The desired maximum on the PES corresponding with the TS is the point at which all of these vibrations are at a minimum except one, the imaginary vibration with negative force constant. This means that at this point, all the vibrations will increase the energy of the structure if the atoms were to follow the motions in their vibrations except for the one for which the TS is a maximum. We know that this vibration is imaginary from observation of the following equation into which the negative force constant must be substituted for k:
Here it becomes apparent that the square root of a negative number must be calculated, giving an imaginary solution for the frequency. Conversely, the motion of the atoms in this vibration is indicative of a rearrangement resulting in a decrease in the energy of the overall structure.
Upon observation of the text file resulting from the failed TS optimisation it is clear that instead of only observing one negative force constant there are in fact two, thus giving rise to two imaginary frequencies. Whilst one of these imaginary frequencies is desired (its motion corresponding with that of the formation of the product from the transition state, hence decreasing the energy) the other is unwanted and corresponds with a different molecular configuration. It just so happens that this vibration overlaps with the desired vibration at this point on the PES. This unwanted vibration can be removed from the calculation simply by inserting the words opt=noeigentest into the optimisation criteria of the text input file. This requests the programme to ignore any other calculated force constants once it has obtained one thus omitting this latter one from the calculation. This approach is valid since observation of the output text file from the failed attempt signifies that the guess structure is near the desired maximum giving a converged RMS force gradient of 0.0003.
The ensuing TS optimisation using this adjustment gave the desired TS with one imaginary frequency at -956 cm-1. The detection of one imaginary frequency in the frequency analysis confirms that the TS has been detected. Animation of the frequency highlights the synchronous bond forming motion of the atoms in the transition state towards that of the product which would lower the overall energy of the molecule. Also characteristic of the Diels Alder reaction path. Shown in table below:
| Level of theory | AM1 Semi Empirical | DFT/B3YLP 6-31g(d) | ||||
| Structre | ||||||
| Total Energy | 0.11165526 | -234.54389557 | ||||
| Imaginary Frequency (cm-1 | -956 | -525 | ||||
| Imag. Freq. Animation | 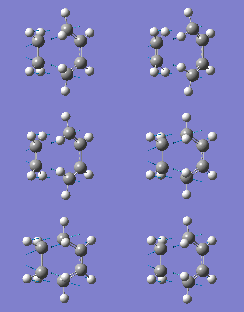
| |||||
| Lowest Positive Frequency (cm-1 | 147 | 136 | ||||
| Lowest +ve Freq. Animation | 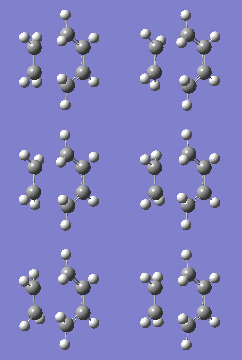
| |||||
| C-C Bond Forming Length (Å) | 2.12 | 2.27 | ||||
It is not possible to compare the energies for the two methods since they report the energies differently, accounting for the large discrepancy. The higher level of theory gives a larger C-C bond forming length which is due to the increased accuracy of the DFT/B3LYP.6-31g(d) method. The shallower potential energy slope to the TS maximum (reaction coordinate) and subsequent lower total energy of the TS as well as the lower value for the imaginary frequency can be accounted for by this larger bond length.
The optimisations of both TSs contain one imaginary frequency confirming that a TS has been found in both cases. The discrepancies in the frequencies for the imaginary frequencies can be ignored upon visualisation of the vibrations which confirm that they are the same.
Observation of the literature values for a typical sp3C-sp3C (1.54Å) and a typical sp2C=sp2C (1.34Å) bond length suggests that in the optimised TS molecules the π-bonds (1.38Å) are breaking to form C-C bonds and the the two sp3 carbons/ C-C bond (1.40Å) forms a π-bond. The Van der Waals radius of a C-atom is 1.71Å and the bond forming length is 2.12Å (or 2.27Å for the DFT/B3LYP/6-31G(d) optimised molecule) which is shorter than twice the van der Waals radius of the carbon atom. This means that the atoms are close enough to each other share electron density the bond has not actually been formed yet.
The frontier molecular orbitals of the transition state were produced and are illustrated below with their assigned symmetry:
| Orbital | View 1 | View 2 | Symmetry | Energy (a.u.) |
| LUMO | 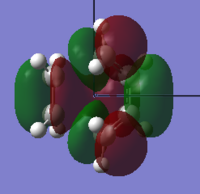 |
 |
Symmetric | +0.023 |
| HOMO | 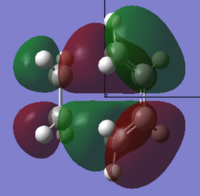 |
 |
Anti-Symmetric | -0.323 |
The diagram below shows a clearer representation of the MOs present in the transition structure of the Diels Alder reaction under study.
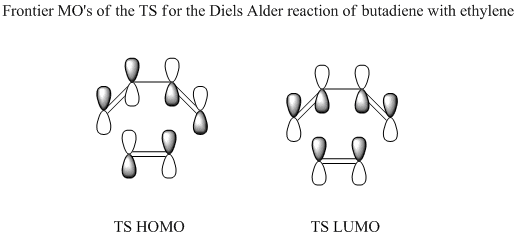
The above images illustrate that the HOMO of the TS clearly arrises from the overlap of the HOMO of the cis-butadiene with the LUMO of the ethylene and represents the σ-bonding orbitals of the two C-C single bonds to be formed in the reaction. The LUMO of the TS meanwhile, arises from the overlap of the LUMO of the cis-butadiene with the HOMO of the ethylene and represents the σ*-antibonding orbitals. This is in agreement with MO theory in that the symmetry of the orbitals is conserved. The conservation of orbital symmetry rule stipulates that the orbital formed by the overlap of any two orbitals with the same symmetry must have identical symmetry to those initial orbitals. This agreement with MO theory is observed because in the case of the Diels Alder reaction, occupied orbitals can only interact with unoccupied orbitals.
Cycloaddition of Cyclohexa-1,3-diene and Maleic Anhydride
The Diels Alder reaction of maleic anyhydride with 1,3-cyclehexadiene and the subsequent regioselectivity of the prodcuts will be examined in this section. The reaction scheme below shows how the reaction proceeds via two different TS, each giving rise to different products, the exo and endo forms.

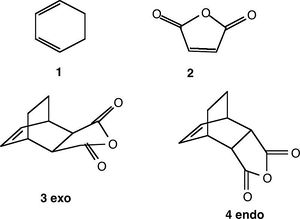
The frozen coordinate method was adopted for the detection of the TS for this reaction as it was believed that both the TSberny method and QST2 method would struggle to determine the TSs. This was because the guess for the TS in both methods must be extremely similar to the actual structure of the TS to allow the programme any chance of detecting the correct TS.
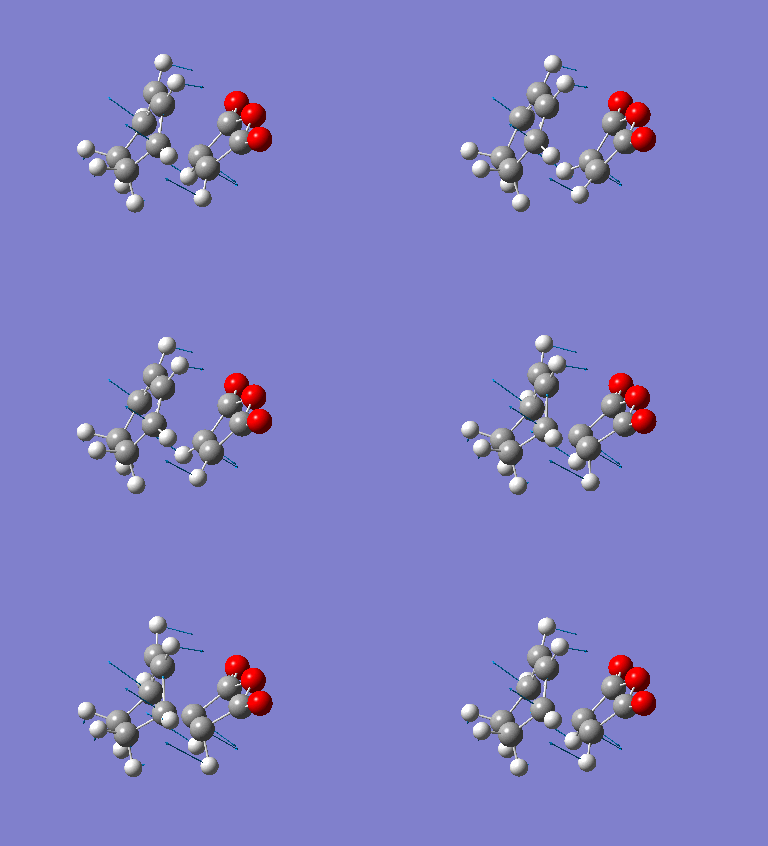
Initially the cyclohaxadiene and maleic anyhydride were both optimised using the semi empircal AM1 level of theory before inserting the molecules into the same page. They were then reorientated with respect to one another in order to try and better represent the exo and endo TSs respectively. Again the frozen coordinate method was adopted for these calculations. This requires the carbons between which the new bonds form to be frozen during the first AM1 semi empirical optimisation to a minimum. Once the result from this optimisation has been received, the set bond distance is released by selecting derivative in Redundent Coordinates and a further AM1 semi emprical optimisation is performed but instead to a TS using the berny method. Note that opt=noeigentest was again inserted to tell the programme to ignore the presence of more than one imaginary frequency. This technique was applied to determine both exo and endo transition states, the results of which are displayed in the table below:
| Properties | endo | exo | ||||||||
|---|---|---|---|---|---|---|---|---|---|---|
| Semi-empirical/AM1 | DFT/B3LYP/6-31G(d) | Semi-empirical/AM1 | DFT/B3LYP/6-31G(d) | |||||||
| Energy (a.u.) | -0.05150465 | -612.68339680 | -0.05041938 | -612.67931095 | ||||||
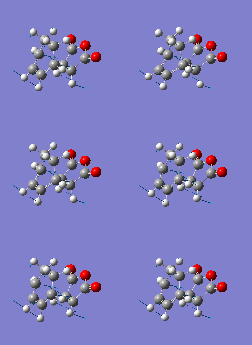
| Imaginary Frequency (cm-1) | -806 | -447 | -812 | -448 | ||||||
 |
| |||||||||
| C-C Bond Forming Length (Å) | 2.16 | 2.27 | 2.17 | 2.29 | ||||||
| Structure |
|
| ||||||||
As for every previously deduced TS, the presence of one imaginary frequency confirms that a TS has been obtained. The vibration, as in the previous section corresponds to the synchronous formation of the two C-C bonds, as expected for cycloadditions, which are concerted reactions.
The bond lengths of the parts of each fragment not involved in the reaction are very similar, as are the distances between the carbons which form the new C-C bond, with 2.27Å for the endo TS and at 2.29Å for the exo TS.
Observation of the exo and endo TSs would lead one to expect the exo TS to be more stable, and hence the exo product to be the thermodynamic product, as there is less steric repulsion in this conformation. The steric repulsion in the endo product, also present in the endo TS, is known as a 1,3-diaxial compression and occurs between the hydrogen atoms at the rear of the cyclohexene ring and in the maleic anhydride. The contributing factors to the stability of the TSs will be continued after the MO analysis.
| TS | MO label | MO image | Energy (a.u.) | Symmetry |
| EXO | HOMO | 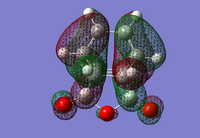 |
-0.242 | Anti-symmetric |
| ENDO | HOMO |  |
-0.242 | Anti-symmetric |
The HOMO of each describes the σ-bonding interaction to be formed between between the reagents. It is constructed by overlap of the HOMO of cyclohexadiene with the LUMO of the maleic anhydride. The LUMO of Maleic anhydride forms the π* anti-bonding orbital of the C=C bond. Because it is populated during the cycloaddition the C=C bond breaks, leaving a C-C single bond.

It is thought that the exo TS should be the more stable but the endo TS is however, the more stable of the two by 0.0041 a.u. This is due to secondary-orbital interactions in the endo TS which stabilise the structure[1]. These interactions are present between the central carbons of the conjugated π-system in the cyclo-1,3-hexadiene fragment and the π*-orbital of the C=O bonds from the maleic anhydride fragment. In-phase orbitals centred on the carbon atom of the π* C=O orbital and the central carbons of the conjugated system are able to interact creating an overlap present on the top face of the π-conjugated system from the back of the molecule to the bottom face of the maleic anhydride. The overall effect is to cause a stabilisation in the endo TS which lowers its Activation energy. The interaction can be seen in the thumbnail alongside and is demonstrated in the diagram below.
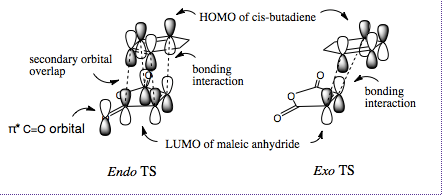
This interaction is not observed in the exo TS since the maleix anhydride fragment points away, and is thus too far away from the conjugated π-system of the cyclohexadiene.
Conclusion
These computational calculations are extremely useful in that they accurately allow us to determine the kinetic pathway and the thermodynamic products of a reaction. However, they are limited in that they are unable to tell us whether a reaction does in fact proceed kinetically or thermodynamically. Consequently, it is not possible to deduce which is the major or minor product unless the reaction is performed experimentally.
Furthermore, in the calculation of all the data in these exercises we have only ever considered one molecule despite the fact that in reality when performing experiments, there are large numbers of molecules present, all of which are able to interact with one another. An improvement to tackle this issue would be to make use of the Boltzmann distributions and statistical mechanics to simulate an ensemble thus considering more than only one set of reactants. In addition, a more rigorous basis set would improve the accuracy of the calculations; however, this proves far more expensive in computational time and power and is not always feasible.
References
- ↑ R. Hoffmann, R.B. Woodward, J. Am. Chem. Soc., 1965, 87, 4388

