Rep:Mod2:lm709
Borane analysis
First, BH3 molecule model was created in Gausview in trigonal planar symmetry by default and an input file for Gaussian structure optimization. Method used was DFT/B3LYP and 3-21G basis set. The Gaussian optimised output file DOI:/10042/to-10535 was fed back for further Gaussian calculations after modifying comand line to get vibrational frequencies and molecular orbital surfaces/energies DOI:http:/10042/to-10534 . Summary window for the optimised BH3 structure gave all B-H bondlengths equal to 1.20 angstroms and angles of 2π/3. The overall energy was found to be -26.462 a.u. and gradient as small as 0.00004507, which confirms us reaching energy minimum.
Vibrational frequencies
Vibrational frequencies of borane were calculated using Gaussian just modifying the comand line, keeping the same method (DFT/B3LYP) and the same basisi set (3-21G). The resulting total energy was the same as for optimisation only task: -26.462 a.u. and RMS gradient was as low as 0.00015990.
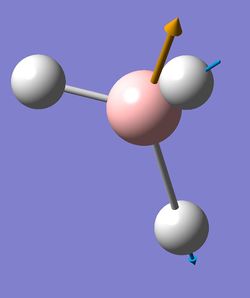
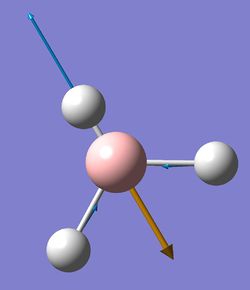
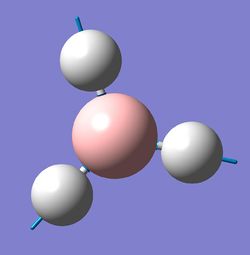
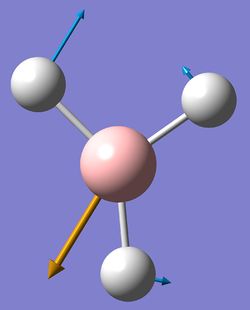
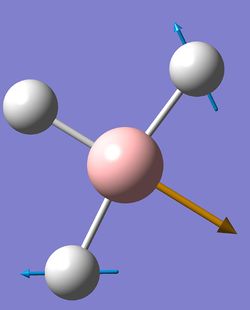
Since all non linear moleculees have 3N-6 vibrational modes, borane should have 6, which is thae case and they are presented in a table below, where blue arrows indicate displacement vector and a brown one shows the derivative of dipole moment.. Although it also has 6 low frequency vibrations (in cm-1): 13, 0.0003, 0.0008, 0.0008, 28 and 39.
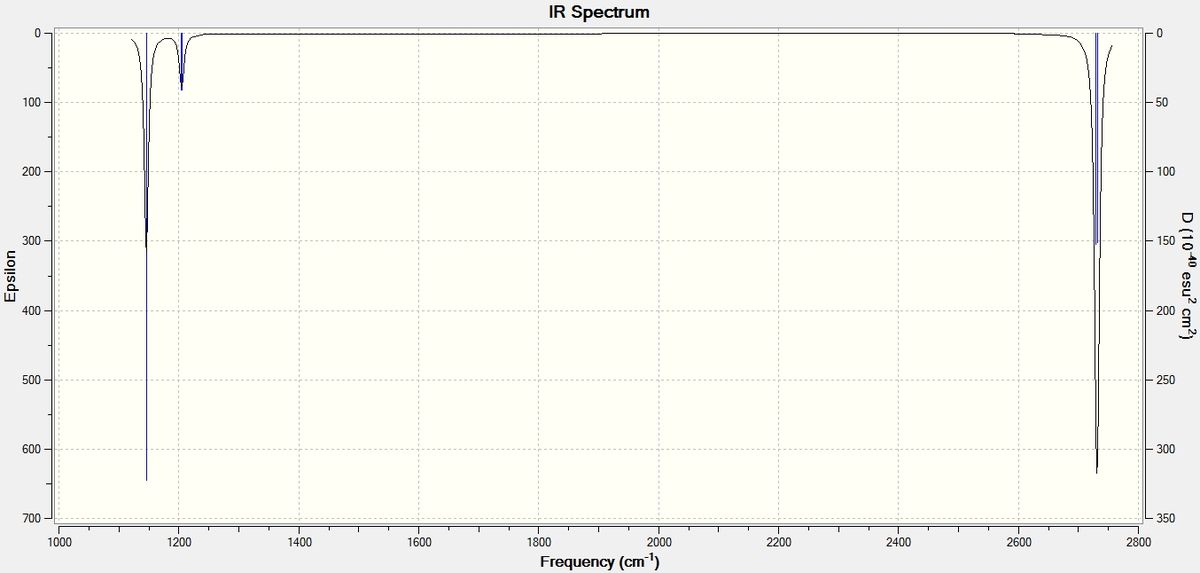
The predicted IR spectrum is produced below:
Here we can see that not all of the modes correspond to the peak, this is because only the ones that involve the change in overall dipole moment are IR active. Thus the greater dp/dt, the higher the intensity of the peak (that represents a corresponding vibrational mode). In our case totally symmetric B-H stretch at 2592.5 cm-1 has a negligible intensity, since it does not involve any change in overall dipole moment of BH3 molecule. Therefore we only observe three peaks in its IR spectrum: 2730 cm-1 and 2732 cm-1 ones are under the same peak and they both have high intensities, 1206 cm-1 and 1203 cm-1 are under the second yet low intensity peak and finally at 1146 cm-1 peak there is only one all in phase B-H wagging mode hiden that also has high intensity.
Molecular orbitals
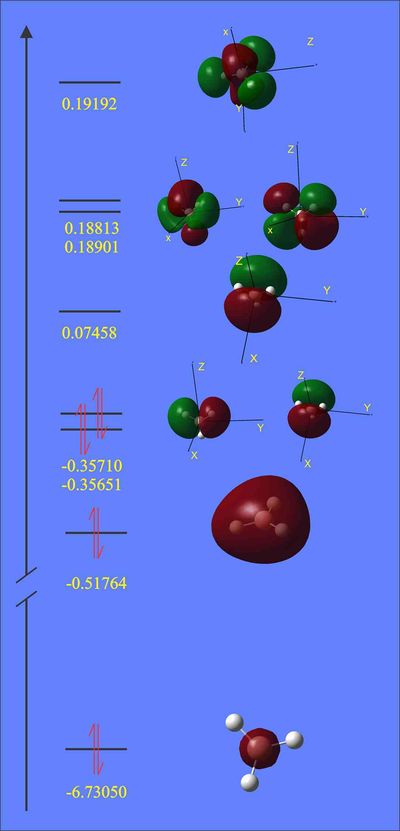
Energies and surfaces of BH3 molecular orbitals were calculated together with vibrational frequencies and therefore they are presented below in a diagram, where they are ranked in order of increasing energy, MO diagram of the same BH3 is presented next to it.
 |
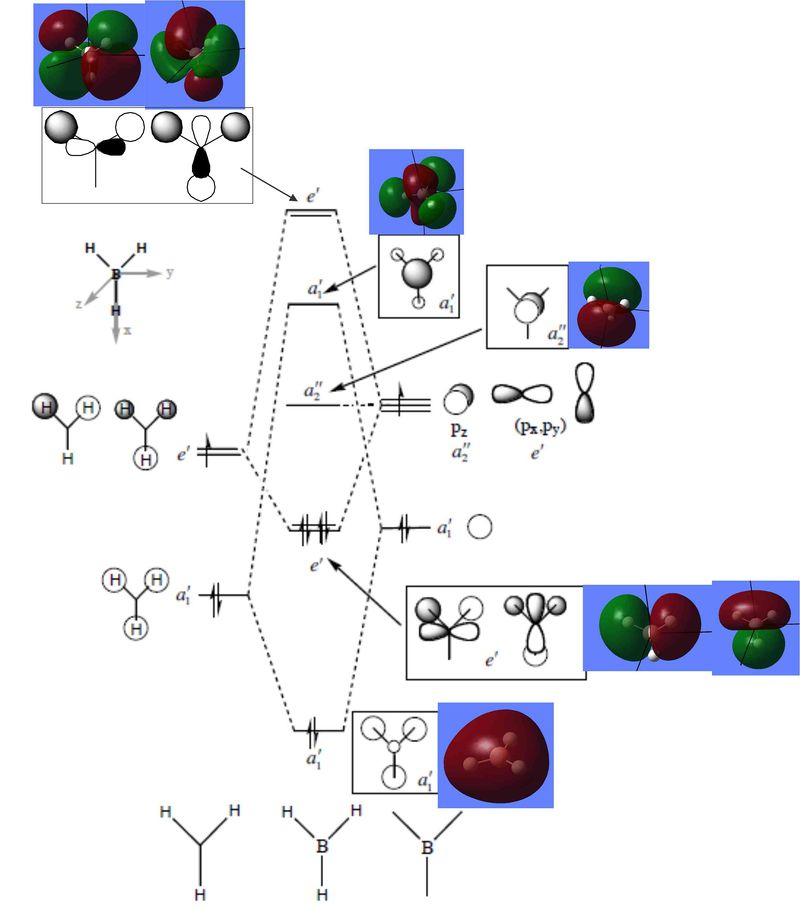 |
We can see that antibonding e' and a1' MO's are very close in energy, thus their order is difficult to predict computationally and thus we can not be absolutely certain about it. The actual MO's look similar to LCAO's, they have the same sign where it has to be, the same nodes and roughly the same shapes. Yet the actual computed MO's are smoother and have in phase lobes joined together.
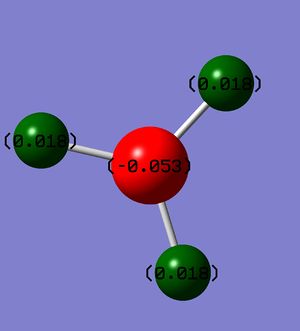
Natural Bond Orbital analysis shows that all B-H bonds have the same contribution from boron and are all equal. Charge distribution on a coloured model (where red represents high electron density and green represents low) is given below, which shows boron to be more electron rich than hydrogens and that chatge is distributed symmetrically (all H's have the same electron density):
 |
TlBr3 analysis
Thallium is in the same group as boron and aluminium therefore resembles their electron deficiency in covalent compounds and therefore should be a Lewis acid BX3 or AlX3 species. Its compounds are highly toxic, thus computational tools to investigate their properties bring a lot of convenience.
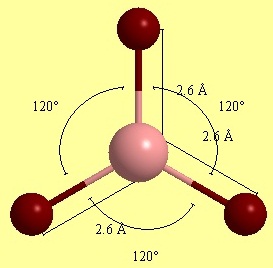
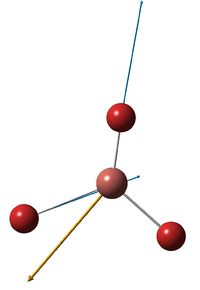
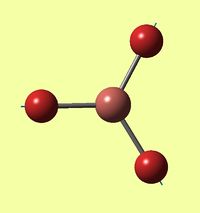
In this part TlBr3 model was constructed in GaussView and submitted for Gaussian structure optimisation using DFT/B3LYP method and LanL2DZ basis set. This was done on the laptop, thus DOI is not available. Frequency calculation was run using the same method and basis set with the restricted point group geometry (DOI:/10042/to-10539 ). Results from optimisation and frequency simulation are given below as well as some analysis of TlBr3 structure.
More accurate Tl-Br bondlength is 2.65 angstroms, which compares well with literature value, which cites bondlengths (average Tl-Br is 2.74 angstroms) for crystaline α-Tl2Br3 compound [1] that was the closest I could find to what we are computing here. We can at least say we are somewhere in the same range, since our molecule is monomeric and has no neighbouring Br's coordinated to Tl.
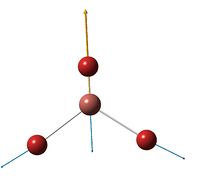
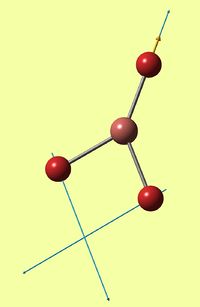
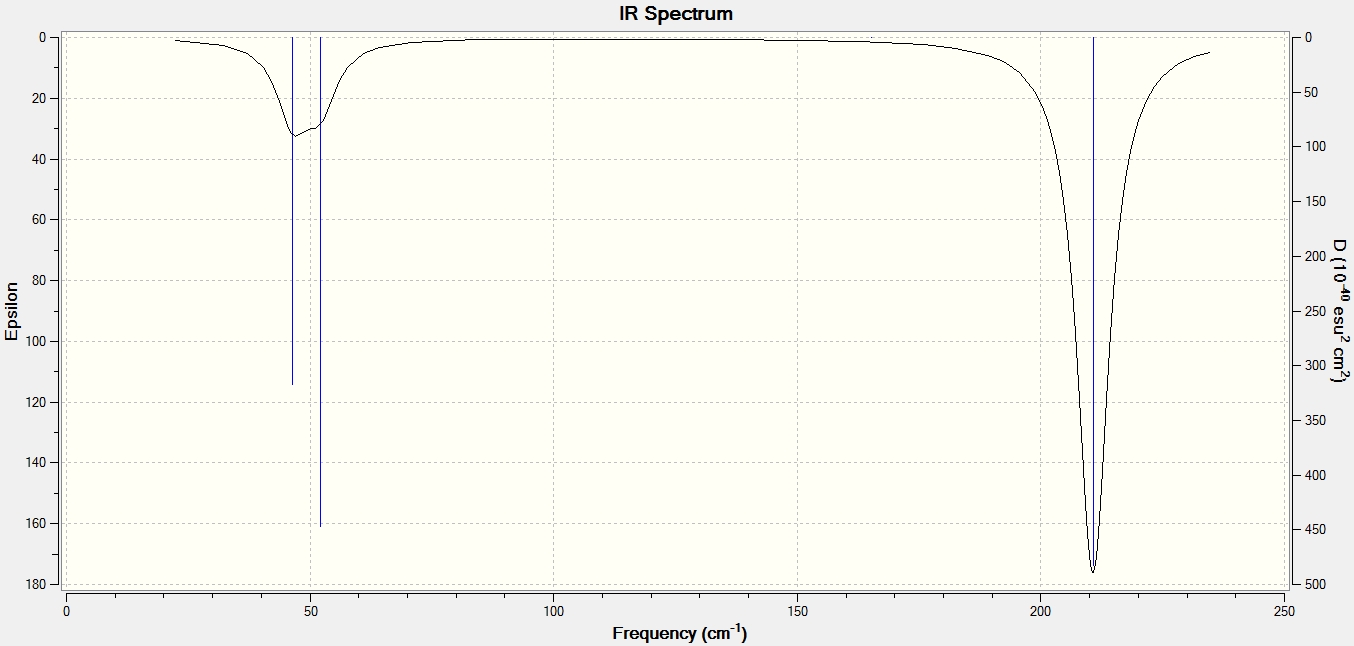
We can see in the table above that again not all of these modes are active, the one at 165 cm-1 is not (no dipole change), thus we observe one high intensity peak at 211 cm-1 that includes both E' peaks of the same intensity and frequency (degenerate). Other less energy requiring modes are covered by one broad peak: wagging at 52 cm-1 and degenerate rocking and scissoring both at 46 cm-1 . Literature[2] values for these vibrations are given in brackets, but those are "estimated" as the researchers say. There were six low frequency vibrations observed as well (v (cm-1): -3.4214 -0.0026 -0.0004 0.0015 3.9366 3.9366), that are not all terribly negative, thus OK.
In TlBr3 all the vibrational modes are at way lower frequencies the in BH3, this is because all the atoms are much heavier that makes their reduced mass lower than that of borane (since it contains the product term in denominator) and thus frequencies are reduced proportionally.
CHEMICAL BOND: The old perception used to be two electrons shared between two atoms, which they share. Although a more comprehensive view would be to take orbitals into account. Then we could think of a chemical bond as a positive (in phase) overlap (MO) of atomic orbitals that is populated with electrons. It is then an interaction between atoms that bring them close together . Although big molecules have both bonding and antibonding MO's in the same region between atoms of interest, hence the one with the most electron populated MO's that have the least amount of nodes (in between atoms of interest) results in the greatest bonding character.
IR spectrum:
Unfortunatelly, this molecule involves all heavy atoms thus calculation method is not accurate enough to give reliable MO's/MBO's, which therefore are not discussed.
References
- ↑ Rupprecht Ackermann, Christian Hirschle, Heinz W. Rotter, Gerhard Thiele, "Mixed-Valence Thallium(I, III) Bromides The Crystal Structure of α—Tl2Br3", Zeitschrift für anorganische und allgemeine Chemie, 2002, 628 (12), 2675–2682. http://onlinelibrary.wiley.com/doi/10.1002/1521-3749%28200212%29628:12%3C2675::AID-ZAAC2675%3E3.0.CO;2-4/pdf
- ↑ V. G. Solomonik, K. S. Krasnov, "The force constants and vibration frequencies of trihalides of metals of the III-a group", Journal of applied spectroscopy, 21 (2), 1120,DOI:10.1007/BF00618942
MoCl2(CO)4 complexes
Cis complex
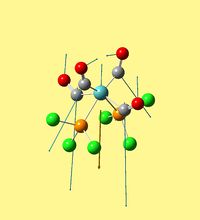
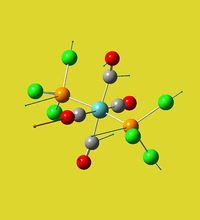
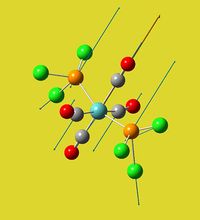
The original model of cis compound was drawn in GaussVieW and had its geometry as shown in figure A. It had all its P-Cl bondlenghts equal to 2.04 angstroms, Carbon/Oxygen bonds were also all exual lenght: 1.32 angstroms and the selected Cl/(CO) dihedral angles are illustrated. This model then was optimised using DFT/B3LYP method and LanL2MB basis set also adding comand line "opt=loose" to obtain a rough estimateDOI:10042/to-10610 , which is presented in figure B. It, however retained its P-Cl bonds unlike the labscript said, though optimisation procedure has clearly been successful and convergence achieved: P-Cl bonds were in the range of 2.39 to 2.41 angstroms (two equatorial ones slightly longer than the rest), carbon/oxygen bonds were 1.19 a for both axial and equatorial ligands. Its total energy was reported as -617.525 a.u. , RMS gradient as low as 0.00002971, which indicates convergence and dipole moment of 8.47 Debye.
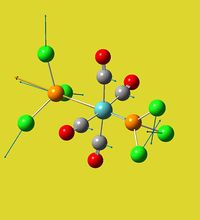
The final structure optimisation of this isomer was carried out using LanL2MB yielded results where I manually set one of the P-Cl bonds eclipsed to axial C=O ligands for both PCl3 ligands. I used the same method, just a different basis set (LanL2DZ), which is more suitable for heavy atom containing compounds to obtain fully optimized geometry (see figure C DOI:10042/to-10609 ). Its total energy was -623.577 a.u., RMS gradient: 0.00000693 a.u. and dipole moment:1.31 Debye. P-Cl bondlengths were 2.24 for eclipsed and 2.24 angstroms for the other four (all shorter than in previous optimisation), Carbon/oxygen all were about 1.17 angstroms, thus again all shorter than in previous optimisation.
Although none of the previous optimisations took d orbitals of phosphorus into account, which is a great source of inacuracy, since phosphorus is hypervalent in this Molybdenum complex compound. Therefore one more additional optimisation was run using the same method and basis set but adding comand line "extrabasis", which adds d orbital set for phosphorus when electronic structure of metal complex is solved in Gaussian. The resulting structure DOI:10042/to-10611 is shown in figure C1. Its total energy was -623.693 a.u., RMS gradient was 0.00005595 and dipole moment of 0.07 Debye.
|
|
|
| ||||||||||||
| Figure A. Non optimised model
generated using GaussVieW 5.0. |
Figure B. LanL2MB optimised model. | Figure C. LanL2DZ optimised model. | Figure C1. LanL2DZ optimised model, which involves
phosphorus d orbital contribution. |
Final geometry
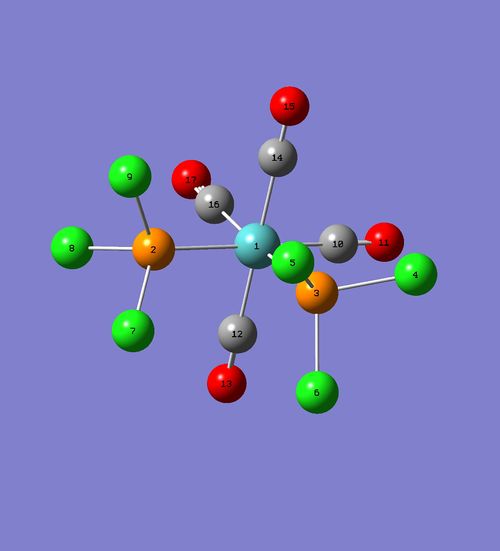
This section is dedicated for structural analysis of cis isomer, which structure was optimised involving d orbital contribution (DFT/B3LYP method and LanL2DZ basis set plus "int=ultrafine scf=conver=9" and "extrabasis" command lines). Geometry of it is presented below:
| Bond | Bondlength (angstroms) |
|---|---|
| C(16)-O(17) | 1.18 |
| C(14)-O(15) | 1.17 |
| C(12)-O(13) | 1.17 |
| C(10)-O(11) | 1.18 |
| P(3)-Cl(6) | 2.11 |
| P(3)-Cl(5) | 2.12 |
| P(3)-Cl(4) | 2.12 |
| P(2)-Cl(9) | 2.11 |
| P(2)-Cl(8) | 2.12 |
| P(2)-Cl(7) | 2.12 |
| Mo(1)-C(16) | 2.02 |
| Mo(1)-C(14) | 2.05 |
| Mo(1)-C(12) | 2.05 |
| Mo(1)-C(10) | 2.02 |
| Mo(1)-P(3) | 2.48 |
| Mo(1)-P(2) | 2.48 |
Vibration analysis
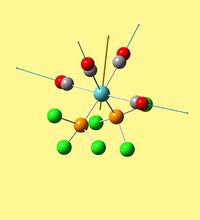
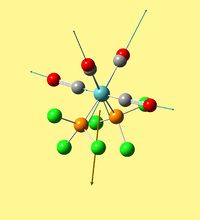
Vibrational frequencies were calculated DOI:10042/to-10612 using well optimised model (see figure F1 above) and the same method (DFT/B3LYP)and LanL2DZ basis set plus comand lines "int=ultrafine scf=conver=9" and "extrabasis" to involve d orbitals of phosphorus. Total energy was found to be -623.693 a.u., RMS gradient was 0.00005598 a.u. and dipole moment 0.07 Debye. Gaussian generated 45 vibrational modes as predicted by 3N-6 formula (N=17, thus 3x17-6= 45), the ones of interest are summarised below (in pictures blue arrows indicate displacement vectors, while a yellow one is a derivative of dipole moment). Simulated IR spectrum exhibits four distinctive absorption peaks at ν (cm-1): 2019, 1938 (C=O st); 600-567 (C=O wag); 483,443 (P-Cl st and Mo-C wag/scissoring skeleton vibrations):
Selected (highest intensity) vibrations are sumarised below: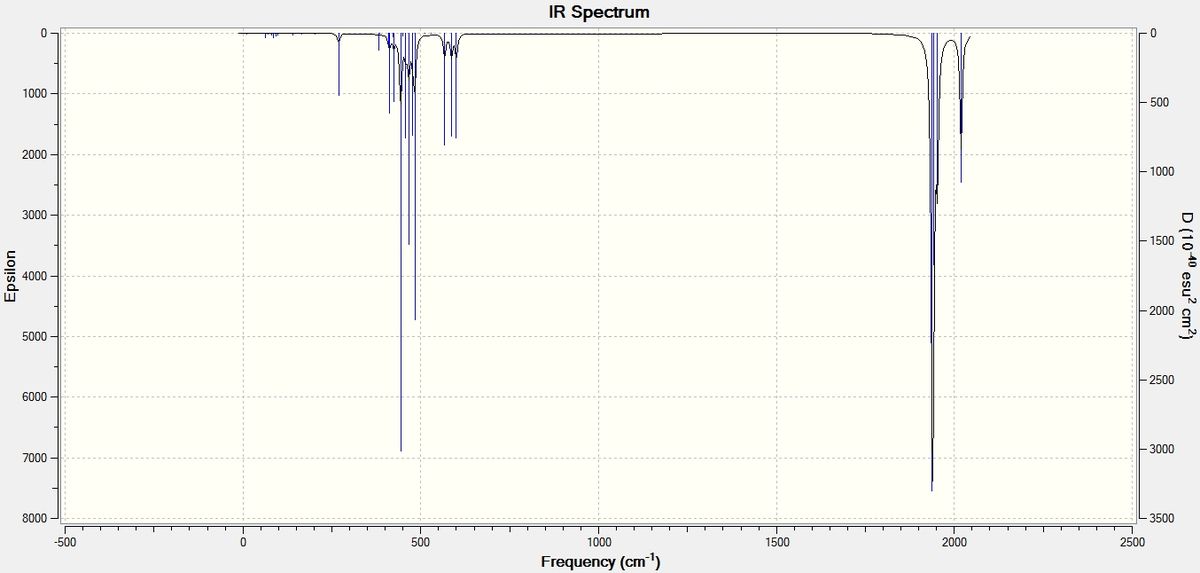
Trans complex
Model of trans compound was drawn in GaussVieW and had its geometry as shown in figure D. It had all its P-Cl bondlenghts equal to 2.04 angstroms, Carbon/Oxygen bonds were also all equal lenght: 1.32 angstroms and the selected Cl/(CO) dihedral angles (14.06 degrees) are illustrated, while two PCl3 groups were gauche to each other. This model then was optimised using DFT/B3LYP method and LanL2MB basis set also adding comand line "opt=loose" to obtain a rough estimate DOI:10042/to-10613 just like in cis compound case. It gave molecule (see figure E), that has a total energy of -617.522 a.u. , RMS gradient of 0.00011476 a.u. and no net dipole moment, since it was very symmetric. both PCl3 groups were almost gausche (180 degrees between antiperiplanar P-Cl bond pairs) and one P-Cl bond from each of the trans ligands was close to paralel to Mo-CO bond (about 14 degrees off). Bondlengths also changed upon optimisation to the following: 1.19 angstroms for carbon/oxygen and 2.40 (average) for P-Cl, although again the latter were indicated in ball/stick model.
For the final optimisation model in figure E was modified by setting both PCl3 ligands eclipsed and one of their bonds parallel to Mo-CO bond. DFT/B3LYP code with LanL2DZ basis set and additional comand line "int=ultrafine scf=conver=9" was used to obtain final geometry (see figure F DOI:10042/to-10614 ). As in the cis isomer case P-Cl bonds contracted slightly to 2.24 angstroms as well as carbon/oxygen bonds to 1.17 on average.
Although none of the previous optimisations took d orbitals of phosphorus into account, which is a great source of inacuracy, since phosphorus is hypervalent in this Molybdenum complex compound. Therefore one more additional optimisation DOI:10042/to-10615 was run using the same method and basis set but adding comand line "extrabasis", which adds d orbital set for phosphorus when electronic structure of metal complex is solved in Gaussian. The resulting structure is shown in figure F1. Its total energy was -623.69415607 a.u., RMS gradient was 0.00000839 and dipole moment equal to 0.23 Debye.
|
|
|
| ||||||||||||
| Figure D. Non optimised model
generated using GaussVieW 5.0. |
Figure E. LanL2MB optimised model. | Figure F. LanL2DZ optimised model. | Figure F1. LanL2DZ optimised model
where phosphorus d orbitals are taken into account. |
Final geometry
The more detailed analysis of trans complex where d orbitals of phosphorus were involved in optimisation process will be given here. 
| Bond | Bondlength (angstroms) |
|---|---|
| C(16)-O(17) | 1.17 |
| C(14)-O(15) | 1.18 |
| C(12)-O(13) | 1.18 |
| C(10)-O(11) | 1.17 |
| P(3)-Cl(9) | 2.12 |
| P(3)-Cl(8) | 2.12 |
| P(3)-Cl(7) | 2.12 |
| P(2)-Cl(6) | 2.12 |
| P(2)-Cl(5) | 2.12 |
| P(2)-Cl(4) | 2.12 |
| Mo(1)-C(16) | 2.06 |
| Mo(1)-C(14) | 2.06 |
| Mo(1)-C(12) | 2.06 |
| Mo(1)-C(10) | 2.06 |
| Mo(1)-P(3) | 2.42 |
| Mo(1)-P(2) | 2.42 |
Vibration analysis
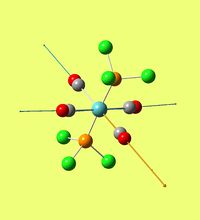
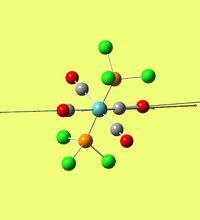
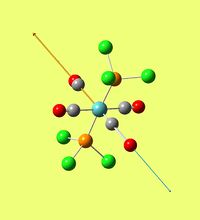
Vibrational frequencies were calculated using well optimised model (see figure F1 above) and the same method (DFT/B3LYP)and LanL2DZ basis set plus comand lines "int=ultrafine scf=conver=9" and "extrabasis" to involve d orbitals of phosphorus DOI:10042/to-10616 . Gaussian generated 45 vibrational modes as predicted by 3N-6 formula (N=17, thus 3x17-6= 45), the ones of interest are summarised below (in pictures blue arrows indicate displacement vectors, while a yellow one is a derivative of dipole moment):
Gaussian simulated IR spectrum has five distinctive peaks at ν (cm-1): 1939 (CO st), 610 (CO wag), 578 (CO scissoring), 461 (Mo-P/Mo-C scissoring, P-Cl st), 434 (P-Cl st).The latter is reproduced below:

Cis/Trans Comparison
C=O bondlengths in both isomers are almost identical (1.17-1.18 angstroms), In cis isomer Mo-C bonds in axial plane (where PCl3 ligands are attached) angstroms).are slightly shorter than axial ones (2.02 vs 2.06) probably due to phosphorus trans effect, which is not the case in trans isomer, where all Mo-C bonds are equal (2.06 angstroms) and no shortening due to tighter bonding. Mo-P in trans is 2.42 angstroms and thus shorter than in cis (2.42 angstroms), which is possibly due to trans effect but now one PCl3 to the other PCl3. P-Cl are about the same in both isomers (2.11-2.12 angstroms).
Regarding the stability of these two isomers, well, their absolute energies seem to be nearly identical, the difference is only 0.001 a.u., which is 2.65 J mol-1, therefore in the range of computational error and we can not tell which is thermodynamically more stable. Although intuition tells that trans is more thermodynamically preferred at least due to sterical reasons. If we wanted to stabilise trans isomer or destabilise cis the easiest way would probably be to increase the bulkyness of phosphine ligands (so they would clash in cis isomer). Otherwise we can choose to stabilise cis isomer by promoting trans effect, which would require to increase its electron donating capability by putting electron rich substituents on phosphorus that are not thar large at the same time. Researchers [1] however found that energy difference is -72.98 kJ/mol with cis being more stable, still the measurements were for solid crystalline structure that has additional interactions, which is not our case.
The number of C=O stretch bands predicted agrees well with theoretically predicted if we take a look into intensities. Cis one is predicted to have four and indeed it has all of them with high intensity (2019 - one peak; 1952, 1941, 1938 - another peak). Trans isomer is predicted to have only one band and again it has that at 1940 cm-1, which is represented by two orthogonal thus degenerate energy asymmetric stretches (intensity of 1606) the other two modes have intensity of 5 (321 times lower). They only appear because optimised structure is not perfectly symmetric and stretching mode gives some tiny change in dipole moment as individual ones added together do not cancel. If we chech its IR it only gives one peak in C=O region!
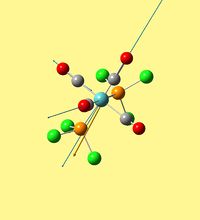
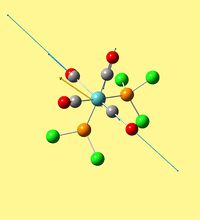
None of the structures were predicted negative frequencies, which means optimisation was not bad at all. The lowest frequencies for cis isomer was 12 and 20 that result in PCl3 ligands rotating around P-Mo bond accompanied by the whole skeleton deformation, though amplitudes of those deformations are very small. For trans isomer it is very similar:two lowest frequencies were 4 and 7 inverse centimeters. These correspond to both PCl3 rotating to one side (around Mo-P bond), while the whole equatorial plane with Mo and CO's - to the other (v= 4cm-1). v= 7cm-1 was due to phosphines rotating to opposite sides while the skeleton twists a bit. As before all the amplitudes were low.
| Structure | 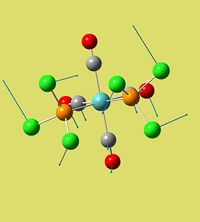 |

|
| Frequency (cm-1) | 12 | 20 |
| Intensity | 0.02 | 0.004 |
| Structure | 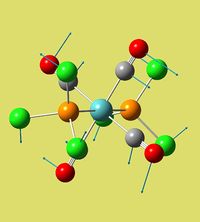 |
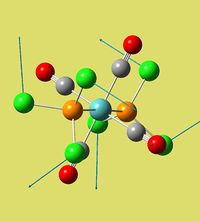
|
| Frequency (cm-1) | 4 | 7 |
| Intensity | 0.05 | 0 |
These low frequency deformations can occur at room temperature due to low energy requirement that can be excited thermally.
Literature [2] values of v (C=O) for cis Mo(CO)4(PPh3)2 are given: 2023, 1929, 1911, 1899 cm-1, which is in good agreement with the predicted values keeping in mind that we replaced phenyls with chlorines.
References
- ↑ DennisW. Bennett, Tasneem A. Siddiquee, Daniel T. Haworth, Shariff E. Kabir, Farzana K. Camellia, "The crystal and molecular structure of transtetracarbonylbis(triphenyl-phosphine)chromium(0) in a new unit cell: Is the trans conformer more stable than the cis?, J. Chem. Crystal., 2004, 34 (6), 363, DOI:10.1023/B:JOCC.0000028667.12964.28 .
- ↑ Oliver Herd, Dietmar Hoff, Konstantin W. Kottsieper, Christian Liek, Kirsten Wenz,Othmar Stelzer, William S. Sheldrick, "Water-Soluble Phosphines. 17. Novel Water-Soluble Secondary and Tertiary Phosphines with Disulfonated 1,1'-Biphenyl Backbones and Dibenzophosphole Moieties", Inorg. Chem., 2002, 41, 5034, DOI:10.1021/ic011239z
Mini Project: Coordination of Si in Azobenzene ligand systems
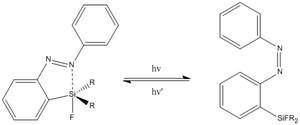
The purpose of this mini project is to explore the capabilities of computational chemistry to predict the electronic structure of azobenzenes that have one main group element substituent. Depending on the nature and the amount of ligands on the main group atom, its electrophilicity and ability to coordinate with one of the nitrogens in N=N (from azobenzene) can be tuned to achieve the desired reactivity.

The molecule of interest in my case is silicon substituted azobenzene (see figure I), which can be photoswitched [1] between cis and trans conformations to enable/disable coordination with silicon and therefore changing its geometry. Such changes between 4 and 5 as well as 5 and 6 coordinated silicon centers are known (see figure II). The trend of increased electrophilicity of silicon upon adding more electronegative substituents (fluorines in this case) was observed that results in its ability to coordinate lone pair of nitrogen (from N=N), although no coordination is observed if Silicon has no fluorines attached.
Cis/Trans isomerism
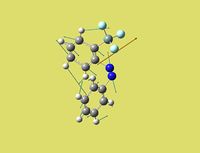
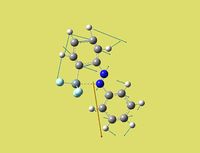
First, both cis and trans isomers of SiF3 bearing Azobenzene were optimised using DFT/B3LYP method and 6-311G(D, P)basis set, followed by the same method and basis set plus one additional comand "int=ultrafine scf=conver=9". Imput structure of trans isomer was altered using crystalographic data from N Kano et.al paper prior to the first optimisation and essentially remained the same when it was complete. Relevant bondlengths in cis isomer were altered accordingly, while dihedral angle between Ph-N=N-Ph was set to 8 degrees as in a similar compound investigated by S. Anitha Nagamani et.al. The resulting structures and relevant data are summarised below: [2]
Totla energy: -1161.64406 a.u., RMS gradient: 0.00001350, dipole moment: 4.2239 Debye.
| Trans | Cis | |
|---|---|---|
| Total Energy (a.u.) | -1161.64406466 | -1161.61148396 |
| RMS Gradient (a.u.) | 0.00001350 | 0.00000727 |
| Dipole moment (Debye) | 4.2239 | 6.2424 |
| Link | DOI:/10042/to-10789 | DOI:/10042/to-10790 |
| Trans | Cis | |||||||
|---|---|---|---|---|---|---|---|---|
| Total Energy (a.u.) | -1161.64403899 | -1161.61146122 | ||||||
| RMS Gradient (a.u.) | 0.00002819 | 0.00000975 | ||||||
| Dipole moment (Debye) | 4.2240 | 6.2402 | ||||||
| Model |
|
| ||||||
| Link | DOI:/10042/to-10793 | DOI:/10042/to-10791 |
Geometry and polarisation analysis
As we can expect, reactivity at Silicon is very different in those two compounds, since trans azobenzene is 5-coordinate and thus hypervalent. Therefore all bonds to silicon become more polarised: silicon itself more electrophilic and its "ligands" more nucleophilic. Therefore one of the use of this photoswitched activation can be the improved Homo-Sakurai reaction. All of the following analysis uses data from fully optimised structures presented above.
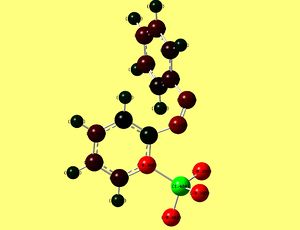
Charge distribution in both isomers is presented in figures III and IV.
 |
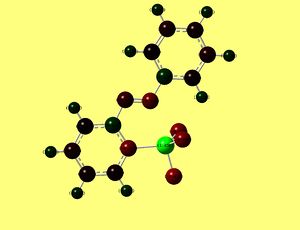 |
Indeed numbers show that silicon became more electropositive and fluorines - more electronegative, which indicates greater polarisation.
Vibrtional frequencies
We can expect that upon successful coordination of nitrogen to silicon, N=N stretching frequency should decrease, since less electron density would be left in N=N area, which weakens the bond. In addition, Si-F bonds should get shorter and harder to stretch due to increased electron density there.
Cis isomer
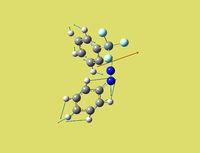
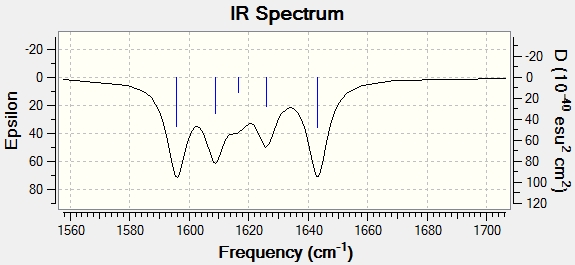
Frequencies of N=N are located around 1600 cm-1 for both isomers and the most intense modes out of those where N=N stretching amplitude is the greatest are presented below together with the IR spectrum. Calculation was run on fully optimised structure using exactly the same method and basis set DOI:/10042/to-10956 . IR spectrum of this region is also reproduced below:
Trans isomer
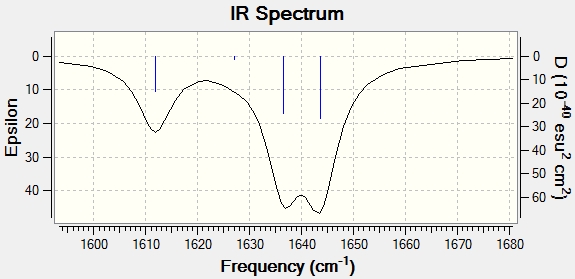
Analoguous procedure for Trans isomer DOI:/10042/to-10959 :
IR comparison
We can see that the shape of the peak at 1600 cm-1 has changed upon coordination of N=N to SiF3. Coordinated molecule (trans) has become more rigid and we have less peaks in this region. Moreover, intensities of absorptions have also decreased for the same reason, rigidity does not allow high amplitude movements, thus N=N doesn't stretch that much. I expected the shift towards lower frequencies in trans (coordinated) molecule due to the reasons described above, yet it did not occur or otherwise it is within the limits of accuracy to predict, since these are mid energy frequencies and a shift expected would be small (up to 40 cm-1), while error in predicting - way higher.
MO's of silylated azobenzene
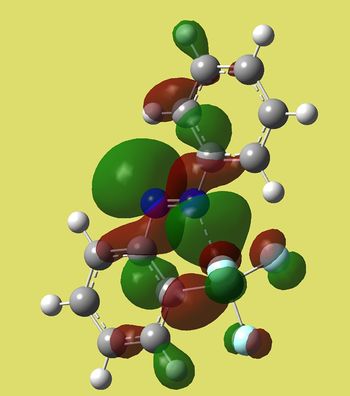
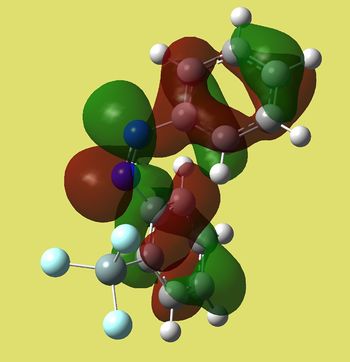
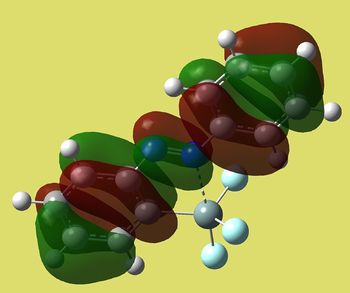
Now I would like to analyse and compare molecular orbitals around HOMO-LUMO region of those two molecules. Let's start from HOMO-1 orbitals and work energy up:
| Cis | Trans |
|---|---|
 |
|
| E=-0.27425 a.u. | E=-0.27375 a.u. |
Cis isomer has strong bonding character at N=N, while trans one's extends even further into phenyl rings. Antibonding interactions are pronounced in non silicon containing phenyl in cis isomer, whereas trans has virtually no lobes on phenyls - on F's instead.
| Cis | Trans |
|---|---|
 |
|
| E=-0.23277 a.u. | E=-0.25497 a.u. |
We can see that homo of trans compound is much more symmetric. It has the shape of bonding π MO's in between N=N and C=C's in phenyl rings (only one node goind through the middle of each ring). This is where molecule's nucleophilic sites are located and it makes sence, since N=N attacks electrophiles and the case of intramolecular allyl transfer to nitrogen was observed [3]. On the other hand, cis has antibonding type of lobes around N=N with 4 nodal planes. Moreover, the energy of trans seems to be slightly lower in energy.
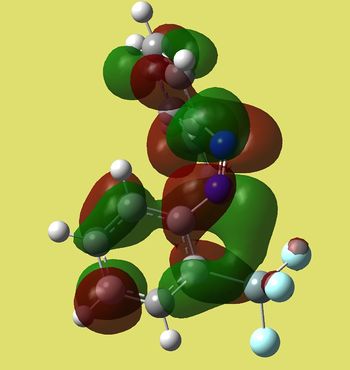
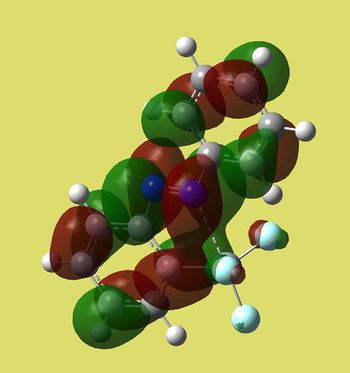
| Cis | Trans |
|---|---|
 |
|
| E=-0.09936 a.u. | -0.11793 a.u. |
Again MO of trans is more symmetric and lower in energy. It shows antibonding character around N=N (as if we connect two p orbitals out of phase). It also has fewer nodal planes on the ring bearing silicon substituent. Cis MO's are rather weird again. Thus if we expect LUMO to be attacked by nucleophiles that could happen at N=N in trans isomer.
| Cis | Trans |
|---|---|
 |

|
| E=-0.05301 a.u. | -0.04587 a.u. |
Now both molecules have bigger lobes on the phenyl ring that has silicon attached.
References
- ↑ Naokazu Kano, Fuminori Komatsu, Masaki Yamamura, and Takayuki Kawashima, "Reversible Photoswitching of the Coordination Numbers of Silicon in Organosilicon Compounds Bearing a 2-(Phenylazo)phenyl Group", J. Am. Chem. Soc., 2006, 128 (21), 7097, DOI:10.1021/ja060926s 10.1021/ja060926s .
- ↑ S. Anitha Nagamani, Yasuo Norikane, and Nobuyuki Tamaoki*, "Photoinduced Hinge-Like Molecular Motion: Studies on Xanthene-Based Cyclic Azobenzene Dimers", J. Org. Chem., 2005, 70 (23), pp 9304–9313, DOI:/10.1021/jo0513616 /10.1021/jo0513616
- ↑ Naokazu Kano, Takayuki Kawashima, "Photocontrol of the Coordination Numbers of the Main Group Elements: Properties of Azobenzenes Bearing a Main-Group-Element Substituent and their Application". http://www.tci-asiapacific.com/tcimail/backnumber/136Eall.pdf

