Rep:Mod2:kr207
The use of GaussView to investigate various structural and electronic aspects of a molecule
In this first part of the module the emphasis was to learn how Gaussview could be used to obtain detailed structural information about a molecule. The actual calculation job is run by Gaussian, which can subsequently be edited using Gaussview 5.0.8c. Using GaussView not only structural aspects but also electronic aspects can also be examined based on molecular orbital calculations. This was illustrated using the example of BH3, BCl3 and MoCO4(PPh3)2
Simple Mos eg Bcl3 and bh3 are created and both their electronic and nuclear structure is optimised and key information from the gaussian .log output file is used for further investigation of the compound
Analysis of a simple compound such as BH3
In this exercise Gaussview was used to optimise the structure of BH3. More detailed information about the structural and energetic aspect of this compound were deduced from the output file.
Optimisation of the BH3 structure
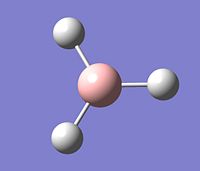
BH3 was created in Gaussview and its structure was then optimised starting from an initial bond length of B-H = 1.5Å. The optimum conformation for BH3 was found to be planar and have a B-H bond distance of 1.18Å and 3 equiavlent H-B-H bond angles of 120.0°. This is in agreement with the ideal conformation of a sp2-hybridised molecule such as BH3.
The following table shows a summary of the key data obtained from the BH3 optimisation.
https://www.ch.imperial.ac.uk/wiki/images/0/0f/BH3FIRSTOPTIMISATION.LOG
This optimisation was successful since the RMS gradient of the energy of BH3, the RootMeanSquare, essentially indicating the deviation of the total energy from the ideal minimum, is close to 0 and <0.001 a.u.
Furthermore, from the .log-output file it can be seen that the job with the final set of forces and displacements has been fully converged.
This calculation was very quick since the basis set used (3-21G) required only low accuracy hencing simplifing and speeding up the calculation. However, this basis set is sufficient for this molecule.
Corresponding Optimization Plots
...on the Total Energy:
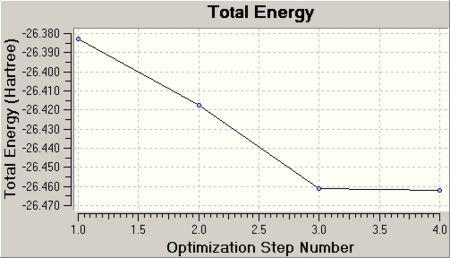
This graph 1 shows the total energy of the molecule after each optimisation step (4steps in total). Essentially, it shows how the program moves along the potential energy surface of BH3 with each individual step until the minimum energy is found. This will be explained in further detail.
...on the RMS gradient:
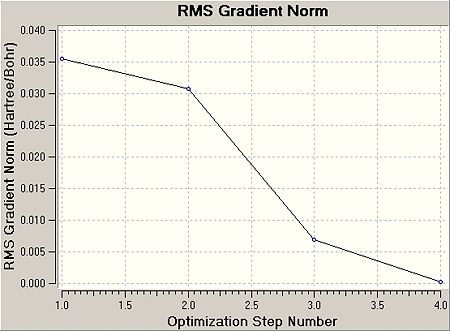
This graph 2 shows the gradient of the energy of the molecule at each optimisation step.
The more steps are involved, the better the optimisation. As the optimisation progresses, the RMS decreases, i.e. the energy and thus the structure of BH3 approaches more the ideal. As the optimisation step number increases, the more accurate the optimisation as the RMS comes close to 0.
Consequently, with increasing optimisation the total energy is edited to a minimum energy, the optimum most -ve minimum energy. Furthermore, it can be seen that the accuracy of the optimisation is increased, as in the graph 1 the change in energy between two optimisation steps decreases and remains nearly unchanged between optimisation step 3 and 4.
As mentioned before, this step 4 also has the lowest gradient and is subseqeuntly found to be the best approximation, where all net forces and hence displacements have been fully converged, as can be seen from the .log-output file sketched below.
Item               Value     Threshold  Converged?
Maximum Force            0.000413     0.000450     YES
RMS     Force            0.000271     0.000300     YES
Maximum Displacement     0.001610     0.001800     YES
RMS     Displacement     0.001054     0.001200     YES
Predicted change in Energy=-1.071764D-06
Optimization completed.
From this it can be seen that the net forces in the optimised molecule are essentially 0. This confirms that in fact we have computed the equiibrium, i.e. the most stable structure for BH3, at which the nuclei-nuclei repulsion and attractive nuclei-electron interactions balance each other out and the lowest possible potential energy is reached.
The plot below essentially describes what happens when a molecule is optimised using the method described in the introduction(This plot was taken from the Inorganic Module 2 introduction) .

The graph sketches the potential energy surface curve of a molecule and the optimisation process. The schroedinger equation is solved for varying coordinates of the nuclei and electrons to find E(R) for each individual position. From graph 1 it can be seen that there are 4 optimisation steps. E(R) is computed for position in step 1. For step 2 the molecule is set to slighlty changed new nuclear configuration and E(R') is computed again.
Graph 1 visualises this and shows that the total energy energy decreases, i.e. the optimisation process approaches the most stable equilibrium position in step 4. The subsequently determined bond length for B -H as 1.18Å is therefore referred to as the equlibrium bond distance at which Nuclear-nuclear repulsion, nuclear-electron attraction and electron-electron interactions are most stabilised.
In the preceeding steps 1-3 the nuclei and electrons are not in equilibrium and these nuclear-electron interactions within the molecule are not balanced. This imbalance causes a net force which makes the molecule shift to a better position, i.e. the internuclear distance r changes. Since the force is the slope of a energy vs r plot, the molecule will experience a force as long as a change in r causes a change in energy.
In step 4 at the most -ve energy of the molecule, the slope is 0, indicating that the most favourable bond distance for BH3 has been found.
Molecular orbitals of BH3
In the previous part the emphasis was on structural aspects of BH3. In the following exercise calculations were carried out to solve the electronic structure of BH3, i.e. the wavedescription of the electrons in the molecule. From the optimisation carried out in the previous step, the optimum position of the nuclei were determined. Based on this quantum mechanical calculations can be carried out and molecular orbitals, i.e. the wave describition of the electrons can be modelled. Molecular orbitals of BH3 were computed and subseqeuntly compared to approximate MOs obtained from MO diagrams. The quantitative results computed were compared to the qualitative description of MOs derived from LCAO in MO diagrams. The following table shows a summary of the molecular orbital calculations.
| Calculation Set Input | ' | Calculation Data Output | ' |
| File | .log | RMS gradient | 0.00020662 a.u. |
| Calculation Type | FREQ | Dipole Moment | 0.00 Debye |
| Calculation Method | RB3LYP | Point Group | D3h |
| Basis Set | 3-21G | Energy | -26.462263 a.u. |
| Calculation Duration | 10.0sec | ||
https://www.ch.imperial.ac.uk/wiki/images/f/f7/KRBH3MOLECULARORBITALS.LOG
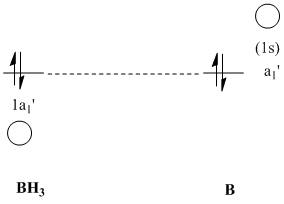
The image below shows the MO diagram for BH3. The individual MOs for BH3 were tabulated separately in the Table 1 below. Column 2 refers to the approximate MOs produced in the MO diagram above and column shows the equivalent computed MO obtained from Gaussview.
 |
| label of MO | LCAO MO | Computed MO |
|---|---|---|
| 2a1' |  |

|
| 1e' |  |

|
 |

| |
| 1a2 |  |

|
| 2e' |  |

|
 |

| |
| 3a1' |  |

|
Please note that the in the MO diagram above only the valence MOs are shown. The computed molecular orbital #1 refers to the non-bonding MO from the 1s atomic orbital on B.
 |
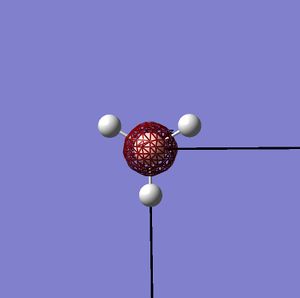 |
Relative ordering of the MO energies
The relative ordering of the antibonding 3a1' and the two degenerate antibonding 2e' MOs in the MO diagram cannot be determined with high accuracy. On the one hand s-s interactions are stronger than s-p interactions, which would mean that 3a' is highest in energy and thus above the 2e' orbitals. On the other hand, the a1' AO energy level is lower than the e' AOs, which would justify that the 3a1' MO is lower in energy that the 2e'.
In the MO diagram plotted above the latter was assumed. However, as can be seen from the table above it was found that for the computed MOs this relative ordering for 3a1' and 2e' was in fact reversed. For this particular computed molecule the stronger antibonding s-s overlap was found to dominate.
This was discussed with other people doing the same calculations and it was found that both cases were computed.
Comparison of the real and the LCAO MOs
Overall the LCAO approximation of MO was confirmed by the real MO computed, in particular for the occupied MOs and the LUMO. The main difference is that the computed MO gives a better account for the real distribution of the e--density across the entire molecule. It accounts for the effect of in-phase or out-of-phase overlap within a MO.
Upon comparing the computed and the LCAO MOs, it was concluded that the MOs derived from LCAO are a very good approximation of the real MO. This is particularly true for the occupied orbitals and the LUMO.
Compared to the occupied MOs the unoccupied orbitals were found to be more diffuse and less accurate in terms of the e--density from the original AO. Therefore, they cannot be directly correlated to the LCAO description. This could also explain the relative energy ordering of the 2e' and the 3a1' MOs. The computed 2e' MOs are more dispersed. As a consequence there is more bonding overlap in space across the molecule between the in-phase p and s AOs, than is accounted for in the LCAO representation. This is very obvious in the computed representation of MO6. Therefore, based on these increase in bonding interactions relative to the anti-bonding overlaps, the 2e' are stabilised and 3a1' is the most anti-bonding MO.
General notes on the MOs for BH3
2a1' and 1e' are bonding MOs, 3a1' and 2e' are anti-bonding.
The HighestOccupiedMolecularOrbital is the degenerate 1e' and the LowestUnoccupiedMolecularOrbital is the non-bonding 1a2". This 1a2" is non-bonding and essentially represents a vaccant pz-orbital on B, perpendicular to the plane of the molecule. B is an electropositive element and therefore the 1a2" is low in energy and non-bonding rather than anti-bonding.
This low-lying pz-LUMO explains the strong lewis acidity of BH3.
Since this LUMO is realtively low in energy BH3 is susceptible to a donation of a pair of electrons from a higher energy HOMO from a lewis basic molecule into that BH3 LUMO.
Since 1a2" is non-bonding rather than anti-bonding, the overall bonding is not affected by donation of a pair of electrons into that LUMO. The bonding is not weakened and BH3 is not destabilised.
BH3 is therefore likely to accept electrons from a base due to that low-lying p-orbital, this will be confirmed in the NBO analysis.
NBO analysis
Using gaussian and Gaussview not only can the e-density of a molecule be computed in the form of MOs, but also a Natural Bond Orbital analysis can be carried out.
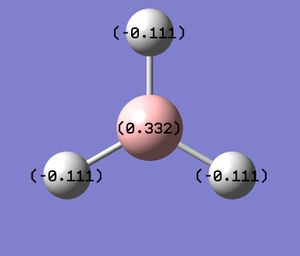
In this part the NaturalBondOrbital charges in BH3 were determined both in Gaussview and the .log file obtained from gaussian. This shows that in the B is the lewis acidic component and electrondeficient.
 |
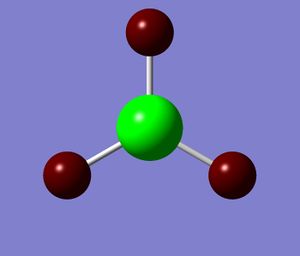 |
The .log file output from gaussian confirmed the NBO charges for the B-atom as 0.33161 and for the H-atom -0.11054 as determined in gaussview giving 0 overall charge of BH3.
In addition, from the log-file the bonding in BH3 can be described more accurately.
    (Occupancy)   Bond orbital/ Coefficients/ Hybrids
---------------------------------------------------------------------------------
    1. (1.99853) BD ( 1) B   1 - H   2
               ( 44.48%)   0.6669* B   1 s( 33.33%)p 2.00( 66.67%)
                                           0.0000  0.5774  0.0000  0.0000  0.0000
                                           0.8165  0.0000  0.0000  0.0000
               ( 55.52%)   0.7451* H   2 s(100.00%)
                                           1.0000  0.0000
    2. (1.99853) BD ( 1) B   1 - H   3
               ( 44.48%)   0.6669* B   1 s( 33.33%)p 2.00( 66.67%)
                                           0.0000  0.5774  0.0000  0.7071  0.0000
                                          -0.4082  0.0000  0.0000  0.0000
               ( 55.52%)   0.7451* H   3 s(100.00%)
                                           1.0000  0.0000
    3. (1.99853) BD ( 1) B   1 - H   4
               ( 44.48%)   0.6669* B   1 s( 33.33%)p 2.00( 66.67%)
                                           0.0000  0.5774  0.0000 -0.7071  0.0000
                                          -0.4082  0.0000  0.0000  0.0000
               ( 55.52%)   0.7451* H   4 s(100.00%)
                                           1.0000  0.0000
    4. (1.99903) CR ( 1) B   1           s(100.00%)
                                           1.0000  0.0000  0.0000  0.0000  0.0000
                                           0.0000  0.0000  0.0000  0.0000
    5. (0.00000) LP*( 1) B   1           s(100.00%)
There are 3 equivelent B-H bonds. Each of which has 44.48% B-character and 55.52% of the bond can be attributed to the H. The B in these bonds have 33.33%p-character and 66.67%s-character, which indicates a sp2-hybridised B.
From this output it can be seen that the B has formed 3 of those sp2 hybrid orbitals. Each of those interacts and forms a bond with the s-AO of the H (100%s-character).
Apart from the valence orbitals, which are most important to describe the bonding, information about the core-orbitals can be also obtained. 4. refers to the 1s orbital of boron.
All orbitals 1.-4. are filled, with an occupancy close to 2
Since B is sp2 hybridised there is an additional vaccant p-orbital on B, perpenticular to the plane of the molecule. This is described by 5. This orbital is vaccant and hence has an occupancy of 0. Gaussian however assigns this empty "LP* orbital" 100%s-character. In this case it is assumed that Gaussian cannot distinguish between this perpendicular p-orbital on B and the next B-3s-orbital. This could be due to the simple basis set used (see BCl3)
There is no mixing of MOs in BH3 as there are no MO of the same symmetry that could overlap. Therefore the E(2) value in the the "second Order Perturbation Theory Analysis of Fock Matrix in NBO Basis" is with 1.51kcal/mol less than 20kcal/mol and thus insignificant.
    Second Order Perturbation Theory Analysis of Fock Matrix in NBO Basis
    Threshold for printing:   0.50 kcal/mol
                                                                             E(2)  E(j)-E(i) F(i,j)
        Donor NBO (i)                     Acceptor NBO (j)                 kcal/mol   a.u.    a.u.
===================================================================================================
within unit  1
  4. CR (   1) B   1                / 10. RY*(   1) H   2                    1.51    7.54    0.095
  4. CR (   1) B   1                / 11. RY*(   1) H   3                    1.51    7.54    0.095
  4. CR (   1) B   1                / 12. RY*(   1) H   4                    1.51    7.54    0.095
The log-output file also contains a NBO summary which lists the population of the B-H bonds and the core orbital with 2 electrons each and the vaccancy of the B lone pair. It also gives the energy of the individual bonding components:
Natural Bond Orbitals (Summary):
                                                           Principal Delocalizations
          NBO                        Occupancy    Energy   (geminal,vicinal,remote)
====================================================================================
Molecular unit  1  (H3B)
    1. BD (   1) B   1 - H   2          1.99853    -0.43712
    2. BD (   1) B   1 - H   3          1.99853    -0.43712
    3. BD (   1) B   1 - H   4          1.99853    -0.43712
    4. CR (   1) B   1                  1.99903    -6.64476  10(v),11(v),12(v)
    5. LP*(   1) B   1                  0.00000     0.67666
    6. RY*(   1) B   1                  0.00000     0.37177
    7. RY*(   2) B   1                  0.00000     0.37177
    8. RY*(   3) B   1                  0.00000    -0.04532
    9. RY*(   4) B   1                  0.00000     0.43446
   10. RY*(   1) H   2                  0.00032     0.90016
   11. RY*(   1) H   3                  0.00032     0.90016
   12. RY*(   1) H   4                  0.00032     0.90016
   13. BD*(   1) B   1 - H   2          0.00147     0.41201
   14. BD*(   1) B   1 - H   3          0.00147     0.41201
   15. BD*(   1) B   1 - H   4          0.00147     0.41201
      -------------------------------
             Total Lewis    7.99463  ( 99.9329%)
       Valence non-Lewis    0.00441  (  0.0551%)
       Rydberg non-Lewis    0.00097  (  0.0121%)
      -------------------------------
           Total unit  1    8.00000  (100.0000%)
          Charge unit  1    0.00000
All B-H have the same energy, are therefore equivalent. The 1sAO is lowest in energy since it is the coreorbital. The lone pair is relatively higher in energy, indicating that it doesn't take part in any bonding interaction as it is perpendicular to the bonding orbitals, but is low-lying enough so that BH3 can act as a Lewis acid, i.e. accept a pair of electrons into that low-lying empty p-orbital.
Vibrational Frequencies of BH3
In this part of the exercise a frequency analysis was carried out to check the efficiency of the optimisation and to obtain an IR-spectrum of BH3 that could then be compared with experimental data. The following table shows a summary of the frequency gaussian calculation.
| Calculation Set Input | ' | Calculation Data Output | ' |
| File | .log | RMS gradient | 0.00020662 a.u. |
| Calculation Type | FREQ | Dipole Moment | 0.00 Debye |
| Calculation Method | RB3LYP | Point Group | D3h |
| Basis Set | 3-21G | Energy | -26.462263 a.u. |
| Calculation Duration | 10.0sec | ||
https://www.ch.imperial.ac.uk/wiki/images/7/7c/KATHARINAR_BH3_FREQ.LOG
The energy obtained for BH3 is exactly the same as previously obtained from the optimisation process. This means that the frequency calculation was carried out using the correct, optimised BH3 structure.
The following table shows a graphical summary of the vibtrational modes and frequencies obtained.
| No. | form of vibration | frequency / cm-1 | Relative intensity | symmetry, D3h point group | 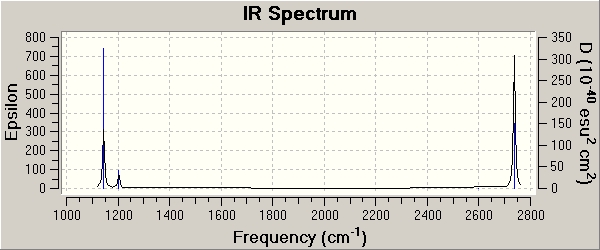
|
|---|---|---|---|---|---|
| 1 |  |
1144.15 | 93 | a2" | |
| 2 |  |
1203.64 | 12 | e' | |
| 3 |  |
1203.64 | 12 | e' | |
| 4 |  |
2598.42 | 0 | a1' | |
| 5 |  |
2737.44 | 104 | e' | |
| 6 |  |
2737.44 | 104 | e' |
None of the above vibtrational frequencies is -ve, which indicates a successful optimisation.
The frequency analysis is the second derivative of the potential energy surface. If the curvature, i.e. the second derivative is +ve, there is a minimum of the curve. Therefore, the +ve vibrational frequencies obtained confirm that BH3 is in its ground state. A -ve frequency would indicate a maximum, which would mean that BH3 is in an higher energy state and not at the lowest possible point of the PES-curve as seen above
6 vibrations were observed in total.
The symmetry label for each vibration was determined using the D3h charactertable and the .log output file.
In the IR-spectrum only 3 peaks are observed, even though there are 6 vibrations.
This is due to the fact that vibrations on BCl3 are doubly degenerate. From the symmetry labels of the vibrations it can be seen that they refer to double degenerate irreducible representations. This refers to the fact that orbitals only as a group map onto themselves and can only be considered together. THe representation is therefore a result of the sum of all coordinates of the individual components.
More information can be obtained from the .log-file from gaussian frequency calculations.
Low frequencies --- -66.7625 -66.3592 -66.3589 -0.0020 0.0031 0.2123
Every molecule has 3N-6 vibrational frequencies.
The first line "low frequencies" refers to the "-6" frequencies of the motions of the center of mass of BH3. These vibrations are much smaller than the actual vibtrations tabulated above.
These frequencies should be around 0 within +/- 10cm-1.
In this case they are more -ve, which is due to the fact that a simple low level basis set was used
The fact that they are negative shows that the center of the nuclei is not at its minimum in the potential energy surface vs R graph. And the position would have to be further optimised.
Analysis of BCl3
Structural optimisation of BCl3
The geometry of BCl3 was optimised following procedure for the previous example BH3 The following tables show the gaussian calculation summary for this optimisation analysis.
| Calculation Set Input | ' | Calculation Data Output | ' |
| File | .log | RMS gradient | 0.00005905 a.u. ≈ 0 a.u. |
| Calculation Type | FREQ | Dipole Moment | 0.00 Debye |
| Calculation Method | RB3LYP | Point Group | D3h |
| Basis Set | LANL2MB | Energy | -69.439281 a.u. |
| Calculation Duration | 13.0sec | ||
https://www.ch.imperial.ac.uk/wiki/images/0/01/KATHARINA_BCL3_OPT.LOG
As can be seen a different basis set is used than in BH3.
When chosing a basis set, computational difficulty and accuracy of the basis functions, i.e. size of the basis set have to be weighed relative to each other. In addition, to simplify the calculations for second row atoms pseudo-potential functions are used that model the core electrons. This also explains why despite using a larger basis set, both optimisation and frequency calculations were very fast. For BCl3 the medium level basis set LANL2MB was used. A higher level basis set has to be used since Cl has 17 electrons and is therefore relatively large on a quantum-mechanical scale. BH3 is compared to BCl3 less demanding and a simpler basis set can be used.
The high accuracy of this optimised model to the real structure of BCl3 was confirmed by comparing the B-Cl bond distances and Cl-B-Cl bond angles of the computed model to the literature. BCl3 is as BH3 trigonal planar and has a Cl-B-Cl bond angle of 120.0°, which was also found in the computed model. The literature B-Cl bond length is given as 1.75Å. In this model it was found to be 1.87Å longer by 0.12Å.
Ground state BCl3 is sp2 hybridised, i.e. trigonal planar. Therefore the symmetry of BCl3 is D3h. In this exercise Gaussview was constrained to use this D3h symmetry. The tolerance of the point group was set changed to very tight (0.0001) to D3h. This was done to achieve more accurate optimisation results since the atoms are more fixed in their position.
Vibrational Frequencies of BCl3
A frequency analysis was carried out to check the efficiency of the optimisation as explained for BH3.
The following shows the summary of this calculation.
| Calculation Set Input | ' | Calculation Data Output | ' |
| File | .log | RMS gradient | 0.00005910 a.u. = 0 a.u. |
| Calculation Type | FREQ | Dipole Moment | 0.00 Debye |
| Calculation Method | RB3LYP | Point Group | D3h |
| Basis Set | LANL2MB | Energy | -69.439 a.u. |
| Calculation Duration | 11.0sec | ||
https://www.ch.imperial.ac.uk/wiki/images/1/13/KATHARINA_BCL3_FREQ.LOG
The same basis set and method have to be used for different calculations, i.e. for optimisation and frequency or population in the form of molecular orbitals.
The reason for this is that for instance frequency or molecular orbital calculations are done on the optimised structure. This optimised molecule was obtained using a particular basis set. The basis set is the functions that describe the electronic structure for a compound and therefore has to be consistent for different calculations based on the same compound. For instance for BH3 the simplest low-energy basis set 3-21G was used. The BH3 used in further calculations is hence based on a 3-21G geometry. The same appies to BCl3. BCl3 was optimised using th LNL2MB pseudo-orbital and basis set. If e.g. the vobrational frequencies were computed on another, e.g. higher level set such as LNL2DZ, this would mean that in fact the population under these conditions is for excited electron density, relative to the LNL2MB basis set. This difference in e--density would also affect the frequencies needed for particular vibrational motions.
The energy obtained for BCl3 is the same in both methods, indicating that the frequency was carried out with the BCl3 in the correct optimised structure.
Table 3 summarises the vibrations computed for BCl3.
| No. | form of vibration | frequency / cm-1 | Relative intensity | symmetry, D3h point group | 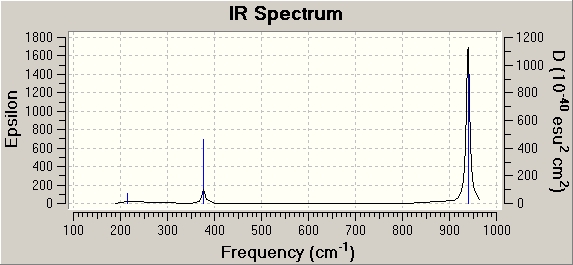
|
|---|---|---|---|---|---|
| 1 |  |
214.13 | 4 | e' | |
| 2 |  |
214.13 | 4 | e' | |
| 3 |  |
376.94 | 44 | a2" | |
| 4 |  |
417.38 | 0 | a1' | |
| 5 |  |
939.47 | 259 | e' | |
| 6 |  |
939.47 | 259 | e' |
None of the above vibtrational frequencies is -ve, which indicates a successful optimisation.
The frequency analysis is the second derivative of the potential energy surface. If the curvature, i.e. the second derivative is +ve, there is a minimum of the curve. Therefore, the +ve vibrational frequencies obtained confirm that BCl3 is in its ground state. A -ve frequency would indicate a maximum, which would mean that BCl3 is in a high energy transition state.
Other aspects that confirm a successful optimisation of BCl3:
Low frequencies --- -8.7725 -4.0872 -4.0872 -0.0021 0.0050 0.0093
As explained in the previous section these low frequencies refer to the motion of the center of mass of the compound. As can be seen here these frequencies are close to 0 and very small and within the tolerated range of +/- 10cm-1. From this it can be seen that the optimised geometry of BCl3 obtained from the previous step must be very close to the absolute energy minima since at this bottom of the potential energy curve the curvature is 0 and hence the frequency for displacement at this point, i.e. the displacement of the mass center of BCl3 should be 0. Furthermore, compared to BH3 these low frequencies are not as -ve and closer to 0, which also indicates the better approximation due to the high level basis set used for BCl3.
Also, this higher basis set gives a better representation of the symmetry labels of the vibrations in the log-file. For BH3 vibrations were corrected (a" to a2" and a' to a1') using the charactertable.
Furthermore, the bonding analysis in BCl3 calculations was compared to BH3
      (Occupancy)   Bond orbital/ Coefficients/ Hybrids
---------------------------------------------------------------------------------
    1. (1.98682) BD ( 1) B   1 -Cl   2
               ( 29.19%)   0.5403* B   1 s( 33.33%)p 2.00( 66.67%)
                                           0.0000 -0.5774  0.0000 -0.8165  0.0000
               ( 70.81%)   0.8415*Cl   2 s( 10.14%)p 8.86( 89.86%)
                                          -0.3184  0.0000  0.9480  0.0000
    2. (1.98682) BD ( 1) B   1 -Cl   3
               ( 29.19%)   0.5403* B   1 s( 33.33%)p 2.00( 66.67%)
                                           0.0000 -0.5774 -0.7071  0.4082  0.0000
               ( 70.81%)   0.8415*Cl   3 s( 10.14%)p 8.86( 89.86%)
                                          -0.3184  0.8210 -0.4740  0.0000
    3. (1.98682) BD ( 1) B   1 -Cl   4
               ( 29.19%)   0.5403* B   1 s( 33.33%)p 2.00( 66.67%)
                                           0.0000  0.5774 -0.7071 -0.4082  0.0000
               ( 70.81%)   0.8415*Cl   4 s( 10.14%)p 8.86( 89.86%)
                                           0.3184  0.8210  0.4740  0.0000
    4. (2.00000) CR ( 1) B   1           s(100.00%)
                                           1.0000  0.0000  0.0000  0.0000  0.0000
    5. (0.36576) LP*( 1) B   1           s(  0.00%)p 1.00(100.00%)
                                           0.0000  0.0000  0.0000  0.0000  1.0000
Both BCl3 and BH3 are trigonal planar, therefore 1. - 4. are the same. In addition, now for BCl3 The vaccant orbital perpendicular to the plane of the molecule (5. LP*), i.e. is as was expected 100% p-hybridised. This shows that using a higher level basis set gave a better model of the bonding in this compound. This orbital was expect to be empty. However, as can be seen above an occupancy of 0.36576 was computed. This could be explained by π-donation from the LP in the 3p orbital on Cl into this vaccant p-orbital on B = 6x 2p(B)-3p(Cl) π-overlap. Due to the good size-energy match of the 2p and 3p orbitals this overlap is significant, as can be seen in the occupancy of LP*. Therefore, BCl3 is a weaker Lewis acid than BH3.
Addition: What are bonds
What are bonds?
Creating and optimising these structures it was observed that sometimes no bonds are drawn in the final structure seen in gaussview. This however doesn't mean that there is no bond. In gaussview a bond is simply defined by distance, i.e. a certain distance is set to be typical for specific bonds. If in the optimised structure the actual distance is longer than this value, the bond is not drawn in gaussview. By convention by a bond we understand the typical 2c-2e bond. This however, does not in fact represent reality as can be seen from looking at the MOs computed. However, the concept of 2c-2e bonds is useful (for mechanistic understanding), but in fact these bonds don't exist. In order to get an idea of the ideal electronic structure, MOs can be computed. These MOs are delocalised, the show the distrbution of electrons across space of the molecule, which is in contrast to the conventional idea of rigid 2c-2e bonds. MOs extend over all atoms in the molecule and the real electronic structure of a molecule is therefore essentially a total of all the orbital contributions. Based on this a bond can be thought of as a representation of the build up of high electron density in a certain area in the molecule.
Examination of a organometallic complex in Gaussview
In this exercise the two cis- and trans-isomers of Mo(CO)4(PPh3)2 were analysed. With the help of Gaussview and the gaussian calculation log-files the stability of each isomer and relative to each other was investigated. Further isomer-specific structural aspects were studied based on the IR-data computed. To simplify calculations Ph was replaced by Ph as for Ph calculations would take very long and be very expensive. Cl has an electronic structure that is very similar to Ph and is therefore a good approximation. The IR data was compared to experimental IR data from Year 2 Lab Expt5S.
Optimisation of cis- and trans-Mo(CO)4(PCl3)2
The ground state structures for both isomers were optimised in 2 steps. This was done to achieve a better fit of the lowest possible energy of the compounds.
Gaussview is limited in the sense that it can only make improvements based on an initial structure. The better the proposed geometry, the better the fit, i.e. the closer the final structure is to its ideal minima.
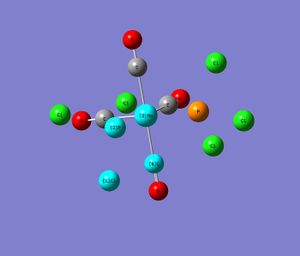
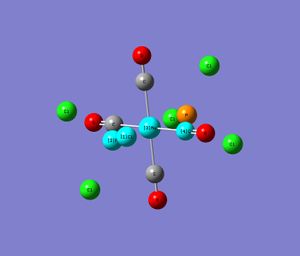
Therefore, in the first step a rough geometry of cis- and trans-compound was determined using a low level basis set and pseudo-orbitals in LANL2MB and additionally, setting the calculation to loose convergence (opt=loose was set in the "Additional keywords" box). This gave a good initial geometry. The following shows an image of the optimised compound in gaussview and the corresponding gaussian calculation summary data.
 |
|
 |
|
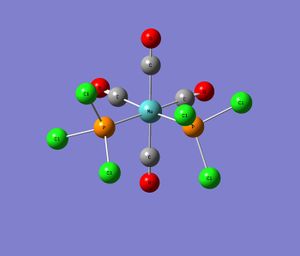
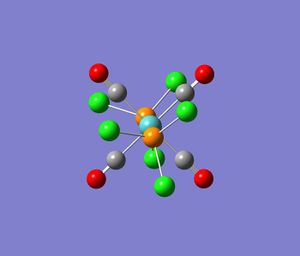
DOI:10042/to-3142 However, as mentioned above, the better the starting point, the more likely the minima will go to its lowest energy level. Hence, another optimisation was carried out using a more ideal orientation of the 2 isomers than the one obtained from the first optimisation calculation. Particular attention was paid to the positioning of the PCl3 groups. For the trans-compound the geometry was improved by eclipsing the 2 PCl3 groups. The group was moved so that one Cl on both sides was parallel to one Mo-C bond, i.e. the torsional angle between Cl-P-Mo-C(highlighted in the image above) was set to 0°. For the cis-compound the torsion between the Cl parallel to the axial CO group was set to 180° for the CO on the opposite plane of the molecule and to 0° wrt to the CO group on the same plane of the molecule (displayed in the image above). The orientation of these groups in the initial optimisation was measured and shown to vary significantly from this ideal conformation. After the first optimisation step, for the trans-compound the torsional angle is 16.9°, rather than 0° and for the cis-conformation it is 178.8° and 2.5°, respectively.
In addition, for the second optimisation better higher level pseudo-potentials and basis sets were used: LN2L2DZ. The electronic convergence was increased with the additional note of "int=ultrafine scf=conver=9".
This second optimisation using these improved cis- and trans-geometries gave following results.
 |
|
 |
|
In short, using a low level basis set gave a good initial guess of the rough geometry of the isomers. However, specifying the exact position of the PCl3 it was possible to reduce the total energy of both compounds further, giving a better approximation of the lowest possible ground state for each isomer. This higher accuracy is also indicated by the lower RMS value for both geometries. The calculations took significantly longer, due to the higher level pseudo orbitals and basis sets that were used.
All further calculations were based on this geometry obtained from the final optimisation.
The trans-compound was found to have an energy of -623.576 a.u..
The cis-compound was found to have an energy of -623.577 a.u.. This corresponds to an energy difference of 0.001041 a.u. or 2.733 kJ/mol. This was further examined in the following section.
Relative stability of cis- and trans-Mo(CO)4(PCl3)2
The 2 isomers are very close in energy. Based on the total energy computed the cis-isomer is slightly more -ve in energy, which would indicate that the cis-conformer is in a more stable ground state. However, the argument of the lowest energy for the most stable isomer cannot be applied in this case, since the energy difference between the 2 compounds is only 2.733 kJ/mol and thus within the experimental error of 10 kJ/mol in those calculations.
Furthermore, the RMS value for the optimisation of the trans-compound is an order of magnitude bigger than for the cis-compound, which is another reason why such a small difference in the energy data is not valid.
Instead, the dipole moment data was used to determine the more stable isomer. As a result of the orientation of the electronegative Cl-atoms of the PCl3 substituent, the cis-compound has a larger dipole moment that the trans-compound by 1.01 Debye. A low dipole moment is always favoured to achieve a stable state. Even though in the trns-conformation the 2 PCl3 groups are eclipsed relative to each other, based on the dipole moment the trans-compound is assumed to be more stable.
Furthermore, in the trans-conformation the destabilising repulsive interaction between the 2 PCl3 ligands, which have a high e-density due to the electronegative Cl (or e-rich and bulky aromatic Ph rings) is relieved. Steric effects are assumed to play an important role since the it was found that in the final cis-conformation the ideal octahedral geometry is distorted. The P-Mo-P angle was measured as 94.2°(lit: 94.8° [1] to reduce repulsive ligand-ligand interactions.
Another indication about the importance of steric effects is the elongation of the Mo-P bonds in the cis-conformer relative to the trans-conformer. In the cis-isomer the Mo-P bond is 2.51Å, 0.06Å longer than in the trans-confomer where Mo-P = 2.45Å. This difference is larger than the calculation error.
Based on these factors indicate the trans-conformer is assumed to be preferred due to relief of repulsive steric interactions.
Nevertheless, the energy difference is very small, indicating that cis and trans-conformer lie in equilibrium. Furthermore, thermal energy at RT, i.e. kbT at RT is 2.45kJ/mol, which would provide enough energy to cause this conversion between the 2 isomers.
Apart from the steric factors have limited extent and electronic factors have to be taken into account. Based on this the cis-conformation would be expected to be favoured since the number of mutually trans CO substituents is reduced. Furthermore, stabilising pi-stacking can be found in the cis-conformation only (refer to next section). Based on electronic arguments the cis-conformer is expected to be more stable.
However, the cis-trans equilibrium is assumed to be determined by other experimental conditions and entropy factors aside from electronic and steric effects.
Effect of tuning of the PR3 ligands
By tuning the PR3 ligand, this equilibrium can be shifted to one side.
The 2 main points considered are steric and electronic factors.
One possibility is to reduce the size of the R-groups on P and thus reduce the repulsive non-bonding interactions in the cis-conformation. PPh3 has a cone angle of 145° compared to e.g. PEt3 with 132°. Therefore, for PEt3 the cis-conformation is stabilised relative to PPh3. Furthermore, as mentioned above the number of trans- CO groups is reduced.
The other possibility is to increase attractive inter-ligand interactios between the 2 P-ligands, which can lead to a relative stabilisation of the cis-conformation. PPh3 could be altered to PPyPh2, and one of these P-substituents can then be protonated by HClO4 giving [MoCO4(PPyPh2)(P(2-PyHPh2)]+ (and ClO4-). Subseqeuntly, in the cis-conformation the 2 Py-rings are connected and stabilised by interligand H-bonding, which also leads to additional, stabilising cation-π bonds between the Ph-groups and the Py-cation. This gives a stabilising π-stacking of the Ph-rings in the cis-conformation.
Vibrational analysis cis- and trans-Mo(CO)4(PCl3)2
From the frequency calculations it was confirmed that the previous optimisation step was carried correctly. The energy of the compound obtained from the frequency analysis was the same as previously computed in the optimisation. Furthermore, no negative frequencies were obtained. An both calculation jobs run were fully converged. DOI:10042/to-3141 ... for cis DOI:10042/to-3140 ... for trans
However, for both compounds 2 vibrational modes were found to be at very low frequency.
| No. | form of vibration | frequency / cm-1 | Relative intensity | ||
|---|---|---|---|---|---|
| Cis | 1 |  |
rocking of the Cl-atoms on PCl3 | 10.76 | 0.0264 ≈ 0 |
| 2 |  |
rocking of Cl-atoms | 17.66 | 0.0075 ≈ 0 | |
| Trans | 1 |  |
rocking of the Cl-atoms
and distortion of Mo-CO plane |
4.96 | 0.0941 ≈ 0 |
| 2 |  |
rocking of Cl-atoms | 6.13 | 0.0000 ≈ 0 | |
As can be seen from the table above all 4 vibrations are of very low intensity and refer primarily the rotation of the Cl-atoms and in the case of vib#1 the Mo-C bonds.
The low frequency means that this rocking motion has a low energy barrier, and therefore doesn't require a large energy input and can therefore readily take place at RT, as kbT supplies enough activation energy for this motion. kbT at RT(298K) is 2.45kJ/mol.
Analysis of the CO stretches in both isomers
The CO stretches in both compounds were also analysed and compared to experimental data [2].
Only the cis-compound was expected to have 4 types of IR-active CO stretches. These involve a change in dipole moment and can therefore be detected by IR-spectroscopy.
In contrast to this, for the trans-conformer, only one peak corresponding to a CO stretch is IR-active and causes a change in dipole moment.
Also, the trans-conformer is the more symmetric compound, and hence fewer IR-active bands are expected.
| No. | form of vibration | frequency / cm-1 | Expt.frequency / cm-1 | Relative intensity | |
|---|---|---|---|---|---|
| Cis | 42 | stretch of COs trans to PCl3 | 1945.32 | 1830.3 | 763 |
| 43 | trans CO stretches | 1948.73 | 1888.94 | 1499 | |
| 44 | all 4 CO stretch | 1958.38 | 1889.1 | 633 | |
| 45 | all 4 CO stretch | 2023.35 | 2013.33 | 597 | |
| Trans | 42 | 4 CO stretches | 1950.46 | 1890.87 | 1475 |
| 43 | xxx | 1951.10 | 1942.94 (w) | 1467 | |
| 44 | xxx | 1977.37 | 2018.15 (vw) | 1 | |
| 45 | xxx | 2031.15 | 2069.25 (vw) | 4 |
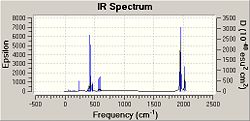
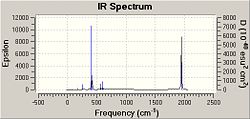
As can be seen, based on these Gaussian calculations in fact 4 CO stretches were computed for both compounds. This could be due to the likely distortion from ideal octahedral geometry due to the electron-density-wise large PCl3 substituents. In this case the symmetry selection rule can be broken.
As a result bands can be observed for the formally forbidden vibrational modes. Vib#44 and 45 are of very low intensity and are therefore expected to correspond to these weak "formally forbidden" bands.
Also, the allowed vibration is of eu symmetry, i.e. degenerate, which could indicate why there are 2 bands of higher intensity in the trans-conformer.
The likely distortion of the ideal octahedral symmetry can be caused by the rocking motions described earlier, which can readily take place at room temperature.
From the IR-data, the different bond length of the CO substituents in the cis-conformer was confirmed. The CO trans to PPh3 is 1.176Å and stretches at a lower frequency at #42 than the CO trans to CO in #43 for which C-O triple bond 1.173Å.
The experimental data was taken from Experiment 5 Spring 2009. In this experiment the presence of "formally forbidden" bands was also observed. All CO vibtrations were computed to take place in the region of 2070cm-1 - 1770cm-1, which is distinct for CO oscillations.
MINI project
Please refer to separate wiki-page, sent in with the same email
References
- ↑ Steric contributions to the solid-state structures of bis(phosphine) derivatives of molybdenum carbonyl. X-ray structural studies of cis-Mo(CO)4[PPh3-nMen]2 (n = 0, 1, 2): F. Albert. Cotton, Donald J. Darensbourg, Simonetta. Klein, Brian W. S. Kolthammer, Inorg. Chem., 1982, 21 (1), 294–299 DOI:10.1021/ic00131a055
- ↑ Identification of Stereochemical (Geometrical Isomers of [Mo(CO)4(L)2] by IR spectroscopy, Organic Synthesis Lab-Expt#5S, conducted 02/2009
Background reading:
- Explanation of MOs of BH3: Dr Patricia Hunt, Y2-"Molecular Orbitals in Inorganic Chemistry", Lecture 2,3, Autumn 2008
- Dimerisation: Dr Paul Lickiss, Y2-Main Group Chemistry, Spring 2009
- BCl3 bonding: Dr Robert Davies, Y1-Periodicity, Spring 2008
- Tuning of PR3 ligands in MoCO4PR3, Intramolecular hydrogen bonding and cation &pi-interactions affecting cis to trans isomerization in tungsten hexacarbonyl derivatives of 2-pyridyldiphenylphosphane and triphenylphosphane: Leeni Hirsivaara, Matti Haukkab and Jouni Pursiainena,Inorganic Chemistry Communications, 2004, 3(10), 508-510 DOI:10.1016/S1387-7003(00)00131-3
- The crystal and molecular structure of trans-tetracarbonylbis(triphenyl-phosphine)chromium(0) in a new unit cell: Is the trans conformer more stable than the cis?:Dennis W. Bennett, Tasneem A. Siddiquee, Daniel T. Haworth, Shariff E. Kabir and Farzana K. Camellia, Journal of Chemical Crystallography, 2004,34(6), 353-359 DOI:10.1023/B:JOCC.0000028667.12964.28

