Rep:Mod2:kc2109
Inorganic Computational Lab
Introduction
Chemistry is an experimental subject. That truism was self-evident historically but during the past three decades it has ceased to be completely valid. In many areas of chemistry, theoretical prediction of chemical properties can rival experimental measurement. The choice of whether to find the structure of a molecule, its bond lengths and bond angles, by experimental spectroscopy or x-ray crystallography or by computation may come down to one of convenience or cost. The ever decreasing cost of computing and increasing power and accuracy of hardware and software has stimulated chemists to explore the area of computational chemistry.
In this assignment the Gaussian programme has been used to explore the fascinating area of inorganic chemistry. The compounds dealt with have been widely used in industry like thallium bromide in semiconductors or boranes in laboratory synthesis. Thanks to computational methods, investigation of their properties becomes much more interesting and much more complex and fruitful analysis of reactions can be undertaken. A knowledge of the topic is important for anyone contemplating chemical research.[1]
It is absolutely crucial to define a few terms which will appear frequently throughout the assignment. Gaussian contains a set of procedures corresponding to different approximation methods, which are called different levels of theory. All calculations have been computed using Density Functional Theory or DFT. These theory-based methods ultimately derive from quantum mechanics research. The approach is to model electron configuration via general functionals of the electron density.
If we are interested in describing the electron distribution in detail, there is no substitute for quantum mechanics. Electrons are very light particles and cannot be described correctly using classical mechanics. In computational jargon, this means that electronic interactions will not be accounted for accurately using Molecular Mechanics (MM) method. The dynamics of many-electron systems is complex and requires sophisticated computational methods. A common simplification is to employ an independent-particle model which assumes than one electron is independent of others and only the most important interactions are considered. Hartree-Fock theory has acceptable accuracy. This is a branching point in computational techniques as the more approximations are invoked, the more closely one approaches semi-empirical methods, whereas additional solutions lead to convergence towards the exact solution of the Schrödinger equation. If solutions are generated without reference to experimental data, the methods are usually called ab initio, in contrast to semi-empirical models.
The mentioned DFT approach is an improvement on HF theory where the many-body effect of electron correlation is modelled by a function of electron density. It gives significantly better results than HF, however has, like all approximations, its limitations. In fact, there is no systematic approach to improving the results towards the exact solution.[2]
A basis set is a mathematical representation of the molecular orbitals within a molecule. The basis set can be interpreted as restricting each electron to a particular region of space. Larger basis sets impose fewer constraints on electrons and more accurately approximate exact molecular orbitals. In the true quantum mechanical world, electrons have a finite probability of existing anywhere in space which corresponds to the infinite basis set expansion. They obviously require more computational resources.
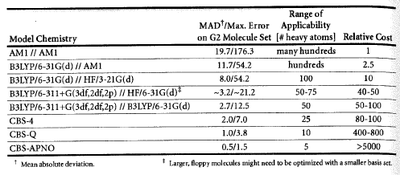
The choice between different basis sets is not as simple as one might think. The general strategy is to select the most accurate calculation that is computationally practical for a given size system. Table A (obtained from the same source) gives a basic solution as to which basis set is best applicable to a given compound. Gaussian offers a wide range of pre-defined basis sets which assign a group of basis functions to each atom within a system being studied to approximate its orbital. The theory and applicability of particular basis sets applied in the assignment will be explained on where appropriate.[3]
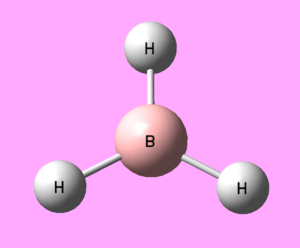
BH3 Molecule
Geometry Optimisation
Geometry optimisations usually attempt to locate minima on the potential energy surface, thereby predicting equilibrium structures of molecular systems. Optimisations can also locate transition structures but this is not the aim of this investigation.
At both minima and saddle points, the first derivative of the energy, or in other words, the gradient is equal to zero. Since the gradient is the negative of the forces, the forces must be zero too. A point on a potential energy surface (PES) where the forces are zero is called a stationary point. If an optimisation is to be successful, a stationary point will must be found. An optimisation is fruitful when the energies have converged to a minimum value.
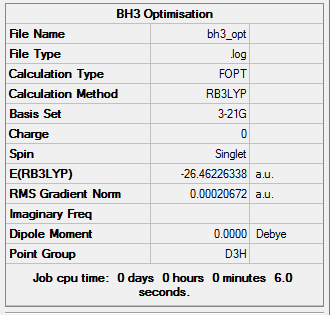
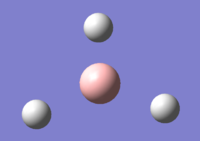
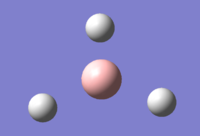
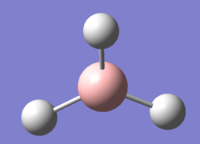
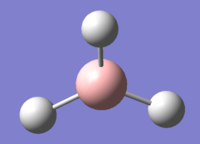
The optimisation of BH3, a molecule with trigonal planar geometry, was carried out using DFT method with the B3LYP functional employed. The basis set is 3-21G. Its advantages and limitations will be discussed in the Mini Project section. The structure of BH3 is presented in Figure 1.
 |
 |
 |
 |
|||||
| Optimisation Step 1 | Optimisation Step 2 | Optimisation Step 3 | Optimisation Step 4 |
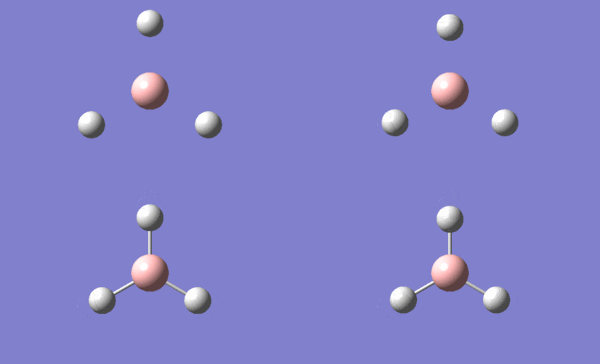
In Figure 5, the graphs serve as pieces of evidence for the successful energy optimisation. The energy has converged to a minimum value.
 |
 |
|||
| Energy Optimisation Curve | RMS Gradient Curve |
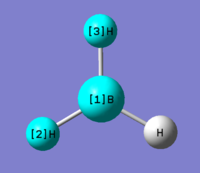
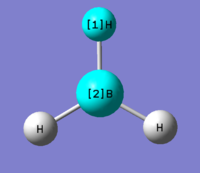
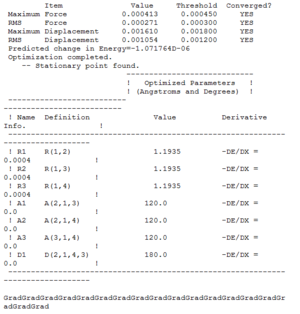
Figures 6-8 present the optimised bond lengths and angles. The B-H bond length, found to be 1.19 Å, which is in excellent agreement with literature data.[4] The same can be said about the H-B-H bond angle, which is perfectly 120°[5], like in all square planar compounds.
Natural Bond Orbitals Analysis
Natural bond orbital (NBO) methods encompass a suite of algorithms that enable fundamental bonding concepts to be extracted from Hartree-Fock or Density Functional Theory computations. NBO terminology and general mathematical formulations for atoms and polyatomic species are presented. NBO analyses of selected molecules that span the periodic table illustrate the deciphering of the molecular wavefunction in terms commonly understood by chemists: Lewis structures, charge, bond order, bond type, hybridization, resonance, donor–acceptor interactions.[6]
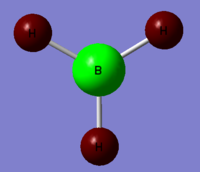
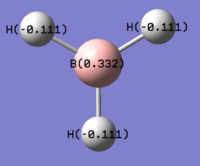
Presented in Figures 9 and 10 are is the numerical and pictorial representation of charge distribution in BH3. The brighter the red colour, the more negative the charge and the same goes for the green colour palette. The boron atom clearly represents the localisation of positive charge which is what is expected for Group 13 elements. Their striking feature is the electron deficiency and the resulting Lewis acidity of their neutral complexes. The electron deficiency arises from the ns2np1 electron configuration, which contributed up to a maximum of six electrons in the valence shell when three covalent bonds are formed.[7] The charge distribution is in good agreement with the Pauling electronegativity scale, as hydrogen is slightly more electronegative than boron (ΧH = 2.20, ΧB = 2.05).
|
|
|||
| NBO Charge Distribution for BH3 | NBO Charge Distribution for BH3 |
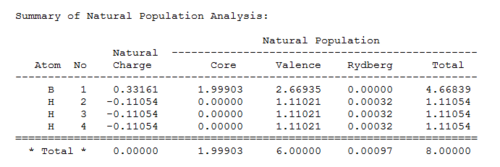
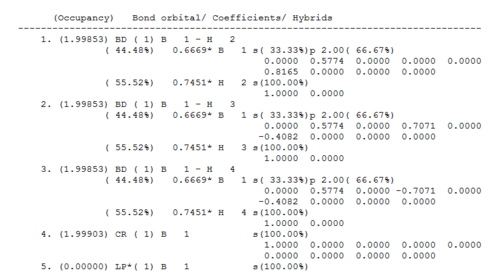
Very important data can be extracted from the log file obtained from natural population analysis. In the summary of natural population analysis the relative orbital contribution to the bond between B and H.
The NBO analysis partitions the electron density of the whole molecule out into atomic like orbitals, which are then used to form 2e-2c bonds. For example the first bond (BD) is between boron (atom 1) and hydrogen (atom 2) and 44.49% of the bond is contributed from the B orbitals which have a hybridisation of 33%s+66%p, while 55.51% of the bond comes from the H orbital which is 100%s. Thus the B has formed 3 sp2 hybrid orbitals which each interact with the sAO of one hydrogen atom. The last orbital shown (Orbital 5) is the boron lone pair 100% p orbital, which is the one sticking up out of the plane. This is formally unoccupied so it is starred. Orbital 4 is the core 1sAO of boron.[8]
|
|
|||
| Bond Orbital Coefficients | Summary of Natural Population Analysis |
Frequency Analysis
Energy calculations and geometry optimizations ignore the vibrations in molecular systems, In this way, these calculations use an idealized view of stationary nuclei. This is however not true. Vibrations are regular and predictable and each molecule has its own specific set of vibrations which give rise to characteristic vibration spectra, with the fingerprint region serving as the ultimate piece of evidence for compound identification.
Gaussian is an important tool in the hands of computational chemists as vibration spectra of molecules in their ground or excited states can be generated. As frequency analysis is valid only at stationary points, computing IR spectra on unoptimised structures leads to significant systematic errors.[3]
For the computed IR spectrum of BH3 and a thorough analysis of the stretching frequencies, please refer to Figure 11 and Table 1.
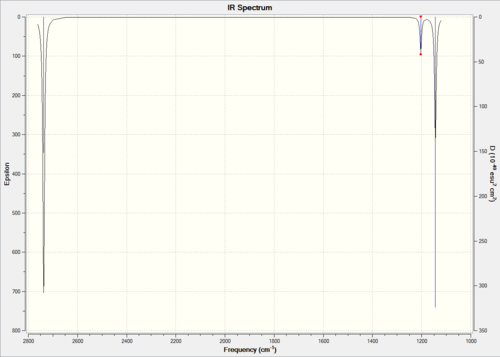
The important pieces of information are also the low frequencies. Each molecule has 3N-6 vibrational frequencies, the frequencies listed as low frequencies in the log file are the "-6", these are just the motions of the center of mass of the molecule, and should be much smaller than the first vibration listed, in this case 1144 cm-1. The better the method employed the closer to zero these six frequencies should be, we normally require them to be within 10cm-1. They are not that accurate in this case because a low level method was used.[8]
Molecular Orbitals of BH3
To obtain a molecular orbital diagram of BH3, one has to complete the following steps:
- determine the molecular shape: BH3 is trigonal planar,
- define the axial system,
- find all the symmetry elements of the point group of the molecule: in this case D3h,
- identify the chemical fragments: B and H3,
- determine the energy levels and symmetry labels of the fragment orbitals.
Once the above have been done, the information can be gathered and represented on a molecular diagram like the one in Figure 13. The LCAO molecular orbitals have been contrasted with those generated using computational methods. The structures generated by both approaches match very closely with regards to the lobes, bonding and antibonding interactions The specific contributions from the fragment orbitals represented by the relative sizes of the lobes are reflected in the computational model.
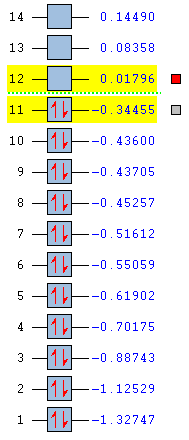
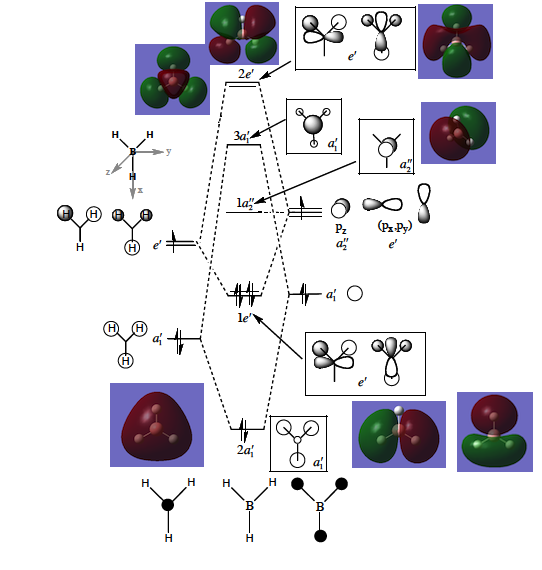
The relative placement of orbitals according to their energies in the LCAO approach diagram matches the energy levels represented in Figure 12 exactly. The first MO is the 2a1’ AO which is too low-lying to participate in bonding. The next level, of -0.52 Hartree is the 2a1’ MO, which has a greater contribution of the H3 fragment orbitals. The 1e’ is the doubly degenerate energy level of -0.36 Hartree is mostly boron based. The next orbitals are the LUMO at -0.075 Hartree and the LUMO+1 at 0.19 Hartee. These are the 2e’ and 3a1’ orbitals, respectively.
The highest occupied MO of BH3 is the doubly degenerate e’ MO. The LUMO is the non-bonding pz orbital on the B atom which has a2” symmetry. It is low in energy because boron is electropositive and non-bonding rather than highly antibonding. The low-lying LUMO accounts for the exceptional Lewis acidity of the compound and will accept electron density from higher energy HOMO of different molecules. Addition of extra electrons into the molecule does not destabilise the molecule as they are added to the non-bonding MOs.[9]
When analysing molecular orbitals, 3D models such as the Gaussian generated MOs provide much more insight into the topic and aid visualising the difficult concept of molecular orbitals and bonding in chemistry. It is however crucial to remember than MOs are simply mathematical creations rather than physical quantities. While energies or bond lengths are physical quantities, orbitals are not. Nevertheless, they provide excellent illustrations of bonding and reactivity.[3]
TlBr3 Molecule
Geometry Optimisation
Just like with BH3, the geometry of thallium bromide was optimised under a DFT/B3LYP method, however this time employing a LanL2DZ basis set. Most chemistry is based on the assumption that it is the valence electrons that dominate in bonding interactions, and so it is common to model the core electrons of an atom by a special function called a pseudo-potential (PP) or an effective core potential (ECP). Thallium and bromine are heavy atoms which exhibit some relativistic effect and it is hard to apply the Schrödinger equation to a system like ThBr3. To allow for such calculations one must only model the valence electrons and assume the remaining core electrons to be modelled as pseudo potentials.[8] PP should only be used on heavy atoms and if accurate results are necessary and the computational cost does not play a great role. The results of this optimisation are presented in Figure 14.
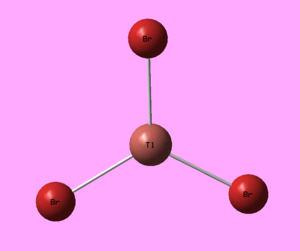
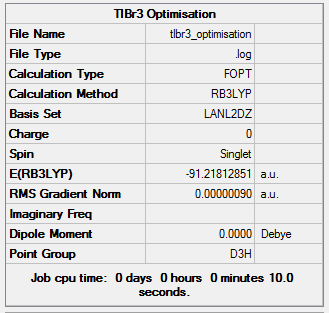
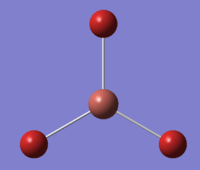
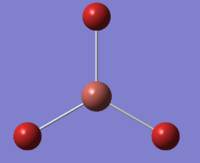
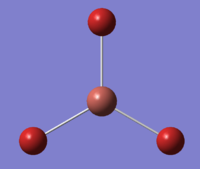
The optimisation procedure was a success as the system has converged to the lowest energy.
 |
 |
 |
||||
| Optimisation Step 1 | Optimisation Step 2 | Optimisation Step 3 |
 |
 |
|||
| Energy Optimisation Curve. | RMS Gradient Curve |
The symmetry of the molecule in the calculations was manually restricted to the D3h point group under a very tight tolerance. This was to ensure that the geometry remains the same and that further vibrational analysis is credible and accurate.
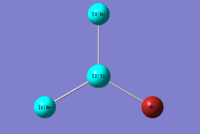
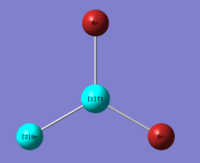
Figures 18-20 present the results of the undertaken geometry optimisation. The theoretical bond length obtained is 2.65 Å, in good agreement with the literature value of 2.51 Å[10] The bond angles of trigonal planar complexes and their dipole moments are expected to be 120° and 0 D, respectively and such results were obtained from the investigation.

Frequency Analysis
A frequency analysis is an extremely important piece of data speaking in favour or against a successful optimisation. If experimental stretching frequencies of functionalities in the system investigated are know, comparison of theoretical (computational) and literature values can tell whether the correct method, functional and basis set have been applied and within their limitations, how accurate the data are. Vibrational analysis is only valid if a stationary point has been find in the process of optimisation.
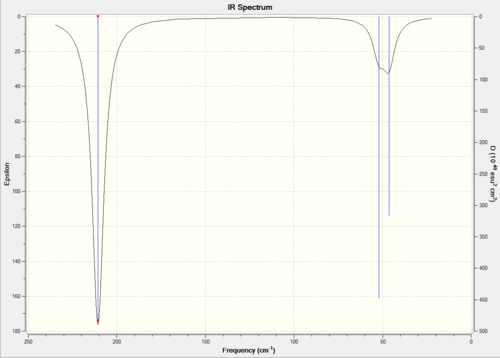
The IR spectrum of thallium bromide is shown in Figure 21. Apart from the main vibrations, 6 low frequencies were identified in the log file. These are:
Low frequencies --- -3.4213 -0.0026 -0.0004 0.0015 3.9367 3.9367
The first observable frequency is 46 cm-1, an order of magnitude greater than the lowest frequency recorded. The lower frequencies are not all positive, however as they are in the range of -10 to 0 cm-1, the method of frequency optimisation can be called relative good. The absence of negative frequencies is an indicator of structure optimisaiton and energy minimisation, however its usual presence is the result of overtones.
Since TlBR3 and BH3 share the same point group, their IR active stretching modes of vibration will be the same. What differs is the frequency magnitude.
What Is a Bond?
No concept is more important in chemistry than the concept of a bond. When one encounters many-body problems rather than idealised and far-from-reality isolated few atoms, one finds it difficult to specify when two particles are bound and when free. Two successful approaches are popular in literature, Hill's and Stillinger's. The former proposed that a bond is a pair of particles bound when their centre-of-mass total energy is negative. The negative energy definition neglects the rotational motion of the mentioned pair. This might be enough for the pair to form a bond even if the total translational energy is positive. Stillinger, on the other hand, proposed that two two particles are bound whenever their mass centres are closer than a certain characteristic distance, r.[11]
Historically, chemical bonding was long formulated in terms of interactions between atoms. It was recognized that electrons are the active agents in bond formation and that without quantum mechanics solution of many molecular systems would not be found. An alternative was found in molecular orbitals.[12] Quantum mechanics was applied to molecules so that an orbital description of a covalent bond could be developed. The simple picture of a covalent bond is that it comes about due to the sharing of electrons between atoms. The molecular orbital approach confirms this key idea bur enables a chemist to be more precise about why sharing leads to a lowering in energy.[13]
It was noticed a couple of times that Gaussview bonds may disappear even though a formal bond exists between two atoms. This is a consequence of interatomic distances which Gaussian considers too large to place a bond in between. An example of such "mysterious bond disappearance" will be presented in the following section.
Cis and Trans Isomers of Mo(CO)4L2
Just like in the case of relatively more simple molecules, BH3 and TlBr3, before any computation analysis is carried out, the structure of the compound under investigation must be optimised. With complex systems such as Mo(CO)4(PCl3)2 isomers the task requires employment of pseudo potentials. Such systems, involving elements from the lower part of the periodic table, like molybdenum, have a large number of core electrons. Although said to be unimportant in a chemical sense, it is necessary to approximate them using a large number of basis sets, otherwise the crucial valence electrons will not be properly accounted for. The function modelling the core electrons is called, as mentioned before, a pseudo potential.
Energy Optimisation
Loose Pseudo Potential Optimisation
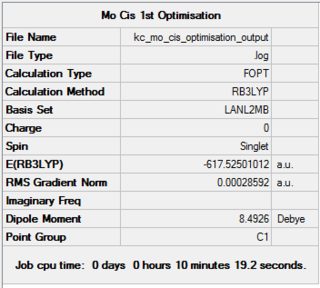
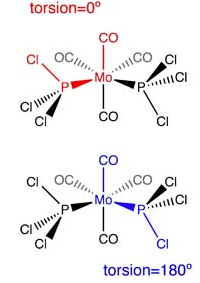
The first optimisation was loose and involved the application of LanL2MB pseudo potential. The goal was to get the rough geometry right and prepare the compounds for further optimisations. The molecules under investigation are the cis and trans isomers of Mo(CO)4(PCl3)2 isomers. The results of the very first optimisation are shown below, in Figure 22.
 |
 |
|||
| Loose Optimisation of Cis-Mo(CO)4(PCl3)2. DOI:10042/to-11958 | Loose Optimisation of Trans-Mo(CO)4(PCl3)2. DOI:10042/to-11951 |
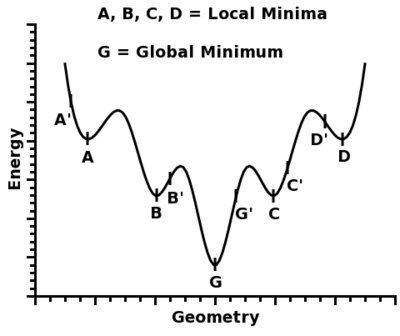
Although, as can be seen from the presented energy and RMS gradient, the structure has converged to its minimum, the pseudo potential used gives only rough optimisation. Most likely, a local minimum, rather than a global minimum, was found. This is shown in Figure 27.
Tight Pseudo Potential Optimisation
The loosely optimised isomers were then optimised once more, this time applying a higher level basis set, LanL2DZ. Prior to that, the geometry of the metal complexes was manually modified:
- Cis isomer: The dihedral angles shown in Figure 22 were set to be, as outlined, 0 and 180°. Two chlorine atoms on one of the phosphorus substituents eclipse both axial carbonyls. Setting the carbonyl ligand to be fixed and rotating the entire phosphorus group helps achieve the pre-optimised structure efortlessly.
- Trans isomer: The dihedral angle shown in the same Figure was set to equal 0. All of the P-Cl bond on one side eclipse their counterparts on the other side. The Cl-P-Mo-P-Cl torsion is 0. For a quick and efficient manual pre-optimisation, it helps to keep the Mo centre with its carbonyl substituents fixed and rotate the PCl3 groups.
Such minor modifications before optimisation help cut the time needed for the system to converge to a minimum.
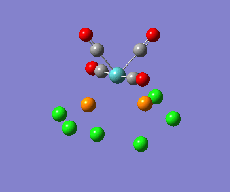
The optimisation progress for both isomers can be tracked in Figures 28-31.
 |
 |
 |
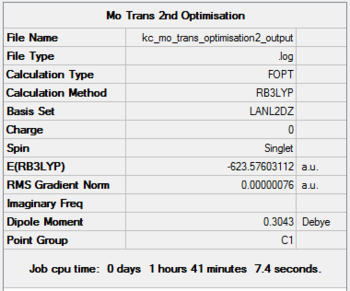 |
It can be seen than on applying a tighter optimisation basis set (LanL2DZ), there is noticeable drop in the energy of formation, as shown in the summary sections. The drop is from -1620000 kJ/mol to -1636000 kJ/mol for both cis and trans isomers, going from the loose to the tight optimisation using pseudo potentials.
The expected point group of the cis isomer is C2v, however the summary suggests it to be C1. A possible reason for this discrepancy was the neglect of point group restriction prior to any calculations. This is done by clicking on Edit button in Gaussview, choosing the Point Group Tab and clicking on Enable Point Group Symmetry. After setting it to C2v and choosing a very tight tolerance, optimisation can be carried out.
Unfortunately, the same scenario applies to the trans isomer, which has D4h symmetry.
Optional Energy Optimisation
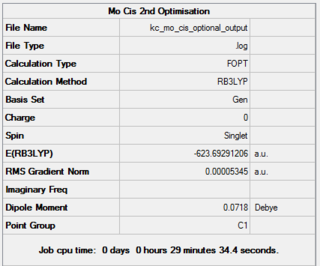
An optional optimisation was carried out using d-orbital interactions. Even the LanL2DZ pseudo-potential and associated basis set are not quite good enough, the phosphorous atom still has only a minimal basis (that is valence s and p orbital functions) however, P likes to be hypervalent, and to use its low-lying dAOs.[8] The results of this additional optimisation are shown in Figures 32 to 35.
 |
 |
 |
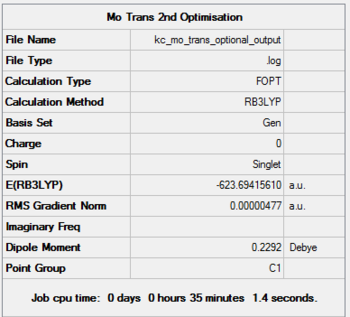 |
Comparison of the 3 sets of results for different levels of optimisation give interesting conclusions. The structure hit his minimal energy during the d-orbital optimisation for both isomers. Although the energy differences between the tight and optional optimisations are in the range of 3kJ/mol, it has been observed that out of the two isomers, the trans isomer is the most thermodynamically stable structure.
Bond Length Analysis
The bond lengths for both complexes are presented in Tables 3 and 4 below.
| No | Bond Type | LanL2DZ Optimisation
Bond Length [Å] |
dAOs Modified LanL2DZ Optimisation
Bond Length [Å] |
Literature Bond
Length [Å][15] |
|---|---|---|---|---|
| 1 | Mo-C (axial) | 2.01 | 2.02 | 1.97 |
| 2 | Mo-C (equatorial) | 2.06 | 2.05 | 2.02 |
| 3 | Mo-P | 2.51 | 2.48 | 2.58 |
| 4 | C-O (axial) | 1.17 | 1.17 | 1.15 |
| 5 | C-O (equatorial) | 1.18 | 1.18 | 1.13 |
| 6 | P-Cl | 2.24 | 2.12 | - |
Only the tight and optional optimisations were included in the analysis. In general, both sets of data correlate very well with experimental values. In the case of both C-O and Mo-C bond lengths, the values are even the same. The most valuable comparison includes bonds made to phosphorus. In the case of Mo-P, the tight basis set seems to provide more, although only slightly, accurate values. An obvious trend for Mo-P and P-Cl bonds is than on using the dAO modified LanL2DZ pseudo potential, there is a significant decrease in bond lengths. This is clearly due to the introduction of d orbitals in the basis set which causes contraction in the mentioned bond lengths. Very unfortunately, no data for the P-Cl bond length were found.
| No | Bond Type | LanL2DZ Optimisation
Bond Length [Å] |
dAOs Modified LanL2DZ Optimisation
Bond Length [Å] |
Literature Bond
Length [Å][16] |
|---|---|---|---|---|
| 1 | Mo-P | 2.44 | 2.42 | 2.50 |
| 2 | Mo-C | 2.06 | 2.06 | 1.85 |
| 4 | C-O | 1.17 | 1.18 | 1.16 |
| 6 | P-Cl | 2.24 | 2.12 | - |
Only the tight and optional optimisations were included in the analysis. In general, again, both sets of data correlate well with experimental values. The major discrepancy is in the Mo-C bond length, which is about 0.21 Å shorter in reality. It can be said that in general, the tight pseudo potential represents the experimental data slightly better. The same trend for Mo-P and P-Cl bonds is observed for both basis sets. Very unfortunately again, no data for the P-Cl bond length were found.
On comparing the axial and equatorial Mo-C bond lengths in the cis complex, it can be observed that latter is shorter. This is because of the trans effect which PCl3, a poor σ donor and a good π acceptor. Such a ligand greatly accelerates substitution of a group that lies in the trans position because as it competes for backdonation with other attached ligands, it weakens the bond trans to it. This means that the equatorial C-O bond is longer than its axial counterpart. Consequently, the Mo-P and Mo-C bonds gets stronger and shorter. The effect is only visible in the case of the metal phosphine.
In the trans isomer, the PCl3 groups are in axial positions and are not able to exert such great influence on the equatorial CO bond lengths. This is however not supported by the data as the Mo-C bond lengths exactly the same as in the cis isomer.
Frequency Analysis
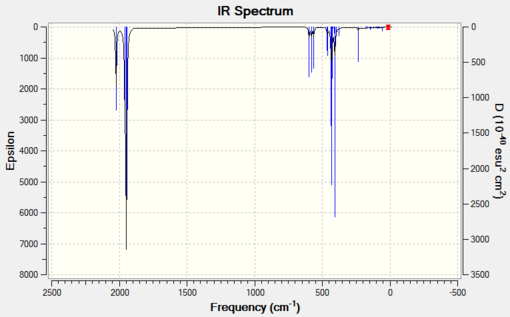
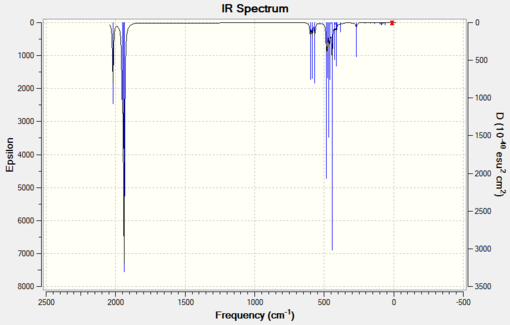
Now it is high time to compare the IR spectra, generated using the same basis sets as for bond length analysis.
 |
 |
The IR stretching frequencies for the cis complex presented in Table 5 are in quite good agreement with experimental data. They are never higher or lower by more than 100 cm-1. The dAOs modified LanL2DZ gives more, however only slightly, accurate results than the unmodified LanL2DZ.
The cis isomer is ideally of C2v symmetry. The CO stretches are presented in Figure X. Each operations of the C2v point group are performed on the arrows and the character contributing to the total reducible representation is obtained by taking the trace of the transformation matrix in each case. It turns out that each of the species in Figure X are infrared active since they all transform of the components of the dipole moment operator.
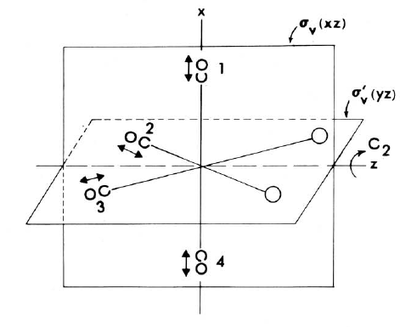

The A1 vibrations are totally symmetrical and therefore none of the arrows change sign when the symmetry operations are performed. The stretches for the B1 vibration should change signs upon C2 rotation and reflection in the σv' plane. Those for the B2 vibration change upon C2 rotation and σv reflection. Since the two A1 modes are of the same symmetry, they are strongly coupled. Symmetry forbids however coupling between B1 or B2 with each other or with the A1 vibrations.[17]
| No | Vibrational Mode | Animation | Description | LanL2DZ Optimisation Frequency [cm-1] [Intensity] | dAOs Modified LanL2DZ Optimisation Frequency [cm-1] [Intensity] | Literature Frequency [cm-1][18] |
|---|---|---|---|---|---|---|
| 1 | Scissor Bend of PCl3 |  |
IR inactive mode | 11 [0] | 12 [0] | - |
| 2 | Twist of PCl3 |  |
IR inactive mode | 18 [0] | 20 [0] | - |
| 3 | B2 |  |
Asymmetric stretch of equatorial CO ligands | 1945 [764] | 1938 [1605] | 1869 |
| 4 | B1 |  |
Asymmetric stretch of axial CO ligands | 1949 [1497] | 1942 [813] | 1896 |
| 5 | A1 |  |
Symmetric stretch of equatorial carbonyls | 1958 [632] | 1953 [588] | 1924 |
| 6 | A1 |  |
Symmetric stretch of axial carbonyls | 2023 [599] | 2019 [545] | 2026 |
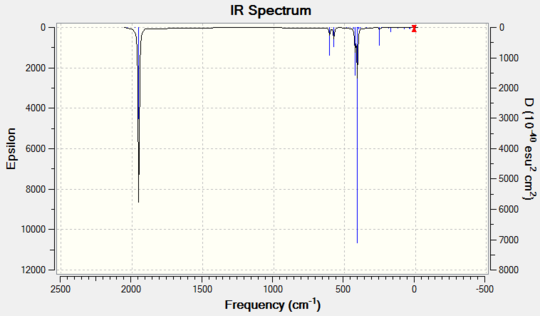
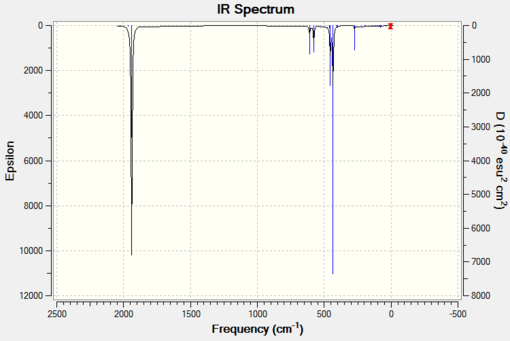
The experimental and theoretical data agree reasonably well in the case of the trans isomer. Just like in the cis isomer, the d-orbital modified pseudo potential generates more accurate frequencies.
 |
 |
| No | Vibrational Mode | Animation | Description | LanL2DZ Optimisation Frequency [cm-1] [Intensity] | dAOs Modified LanL2DZ Optimisation Frequency [cm-1] [Intensity] | Literature Frequency [cm-1][19] |
|---|---|---|---|---|---|---|
| 1 | Bend of PCl3 |  |
IR inactive | 5 [0] | 5 [1] | - |
| 2 | Bend of PCl3 |  |
IR inactive | 6 [0] | 7 [1] | - |
| 3 | Eu |  |
Asymmetrical CO stetches | 1950 [1476] | 1939 [1605] | 1886 |
| 4 | Eu |  |
Asymmetrical CO stretches | 1951 [1467] | 1940 [1606] | 1866 |
| 5 | B1g |  |
4 Asymmetrical CO stretches | 1977 [1] | 1967 [6] | 1933 |
| 6 | A1g |  |
Totally symmetrical CO stretches | 2031 [4] | 2025 [5] | 2050 |
The trans complex, on the contrary, is ideally of D4h symmetry. The reducible representation consists of the following: A1g + B1g + Eu. The Eu mode is the only infrared active, however perturbation by the PCl3 group remove the symmetry and the A1g and B1g gain slight allowance and show up as weak bands. This is reflected by their intensity.[17]
Mini Project: Pi-Backbonding in Carbonyl Complexes and Carbon-Oxygen Stretching Frequencies
Introduction
Carbon monoxide is a very common ligand in organometallic chemistry, where it is known as a carbonyl group. It is specifically useful in stabilising very low oxidation states, with many compounds, e.g. FeCO5 having the metal in the zero oxidation state.
A simple picture of the bonding of CO to a metal atom is to treat the lone pair on the carbon atom as a Lewis σ base (an electron-pair donor) and the empty CO antibonding orbital as a Lewis π acid (an electron pair acceptor), which accepts π-electron density from the filled d orbitals on the metal atom. The bonding contribution is made up of two parts: a σ bond from the ligand to the metal atom and a π bond from the metal atom to the ligand. This type of bonding is often called π-backbonding. The concept is illustrated in Figure 42.
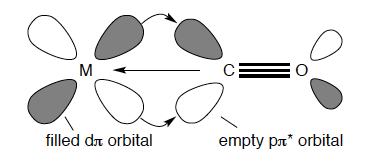
The sigma bonding to a d-metal carbon is not particularly strong as CO is not appreciably nucleophilic. However, as many stable carbonyl complexes are known in organometallic chemistry, the π-backbonding must be strong and the stability of such compounds arises mainly from the π-acceptor properties of carbon monoxide. A very important piece of evidence to support this concept is the fact that stable carbonyls are only formed with metals that have filled d orbitals of energy suitable for donation into the π* antibonding CO orbital. CO does not exists as compounds with elements of the s and p blocks. It is crucial to note that this interesting bonding interaction is synergistic, that is mutually enhancing. The backbonding from the metal sinks electron density onto the CO which in turn increases the ability and strength of σ bond formation to the metal.[7]
An excellent tool to examining the degree of backbonding in carbonyl complexes is IR spectroscopy. The stretching frequency of the carbonyl ligands serve as a qualitative measure of the CO bond strength. The stronger the metal-carbon bond through extensive backbonding into the antibonding CO orbital, the weaker the CO bond itself becomes. As electron density is being placed into the antibonding orbital, the bond order decreases and the bond becomes weaker and longer.
Molecular modelling is a common tool being employed nowadays to demonstrate various chemical principles within the undergraduate chemistry syllabus. Computational techniques give an excellent insight into the concepts and together with laboratory experiments provide a chemist with a broad spectrum of valuable data which allows for profound analysis and conclusions. As with previous excercises, the data obtained in the Mini Project have been computed using GaussView 5. Specific job types, methods, basis sets and other technicalities will be justified where appropriate.
The Mini Project is an investigation of the effect of the metal centre and the number of surrounding carbonyl ligands on the stretching frequency of CO in different metal-carbonyl complexes in comparison with free CO. The molecules involved are CrCO6, FeCO5 and NiCO4. Any computed data is, wherever possible, contrasted with literature data in order to check for the accuracy of the employed basis sets.
- In each case, the molecule was drawn and converted into a three-dimensional structure using the building command.
- The geometry of the structure was optimised using DFT with the hybrid B3LYP functional and the following basis sets to ensure that optimal results are obtained:
- for CO: 3-21G and 6-311G(d,p) basis sets,
- for metal-carbonyls: 6-31G and then combined 6-311G(d,p) and LanL2DZ.
- The vibrational spectrum was calculated for the optimised geometry for each molecule and basis set employed.
- NBO charge distribution analysis was carried out on each molecule.
- Molecular orbitals were generated for carbon monoxide.
Geometry Optimisation
Minimal basis sets contain the minimum number of basis functions needed for each atom. In the case of carbon, these are:
C: 1s, 2s, 2px, 2py, 2pz.
Minimal basis sets use fixed size atomic-type orbitals. The first way that a basis set can be made larger is to increase the number of basis functions per atom. Split valence basis sets such as 3-21G or 6-31G have two or more sizes of basis functions for each valence orbital. Carbon can this time be represented:
C: 1s, 2s, 2s’, 2px, 2py, 2pz, 2px’, 2py’, 2pz’, where the primed and unprimed orbitals differ in size.
These basis sets allow orbitals to change size but not change shape. The first optimisation for CO involved the 3-21G basis set. It’s usually used for elements from H to Xe or very large molecules and is not very computationally expensive. Its limited accuracy makes it appropriate only for preliminary calculations. It is much more flexible than the STO-3G basis set since there are twice as many valence functions that can combine freely to form a molecular orbital.
The next step was to use the 6-311G(d,p) basis set. Split valence basis sets can be enhanced by consideration of orbital shape. Polarized basis sets remove this limitation by adding orbitals with angular momentum beyond what it required for the ground state to the description of each atom[3], which is arguably the most popular split-valence basis sets developed by John Pople. It was originally aimed at elements C through F, however was later extended to the first and second row of the periodic table.[21] It is a much better representation of each function used in comparison with 3-21G. It is slightly more computationally demanding than 3-21G, however the difference is negligible for a small system like the CO molecule.
The small 3-21G basis set is, although available for transition metal, too inaccurate to be used in the assignment. Initial geometry optimisation for the carbonyl complexes was performed using the 6-31G basis set, which is arguably the most popular split-valence basis sets developed by John Pople. It was originally aimed at elements C through F, however was later extended to the first and second row of the periodic table.[21] It is a much better representation of each function used in comparison with 3-21G. It is slightly more computationally demanding than 3-21G, however the difference is negligible for a small system like the CO molecule. According to Mitin et al, however, as demonstrated by a number of calculations, the existing basis set performs poorly for many transition metals, especially those towards the end of the series like cobalt, copper or nickel. The reason for this lies primarily in the fact that the basis set lacks a sufficiently diffuse component.
For each carbonyl complex, a mixed basis set was applied. 6-311G(d,p) set was used on C and O atoms which means that d functions were added to these. The letter p denotes p functions added to hydrogen atoms, if present in the system investigated. It is common to use this set for elements ranging from H to Kr. LanL2DZ (Los Alamos National Laboratory basis set of double-zeta quality) was employed on the metal centre as it is particularly useful when dealing with heavy elements.
All geometry optimisation results for each molecule follow.
CO Molecule
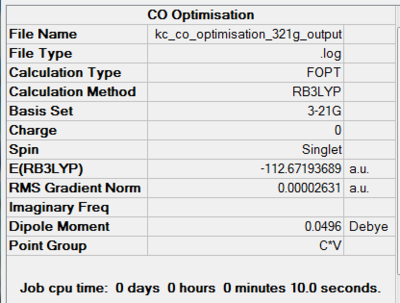
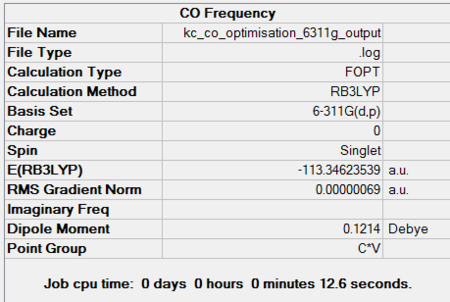
Carbon monoxide is a linear molecule with C∞v point group. This has been confirmed by geometry optimisation using both basis sets. The computed dipole moments are 0.0496 D and 0.1214 D using 3-21G and 6-311G(d,p), respectively. The literature dipole moment is given as 0.125 D[22] and hence agrees very well with the second basis set calculations. In case of the split-valence basis set there is a large discrepancy in the result, arising from loose optimisation conditions. Optimisation components are available under summaries in Figures 43 and 44.
 |
 |
|||
| 3-21G Optimisation Summary for CO DOI:10042/to-11952 | 6-311G(d,p) Optimisation Progress for CO DOI:10042/to-11954 |
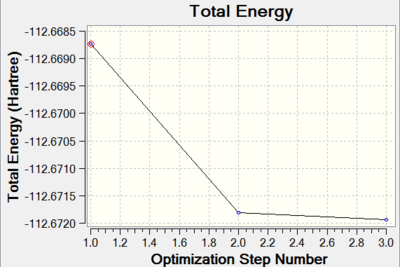
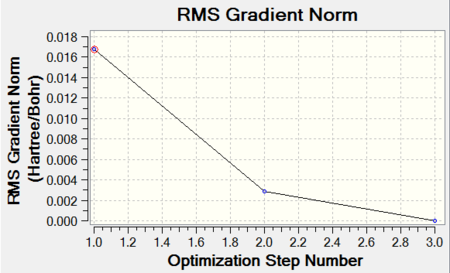
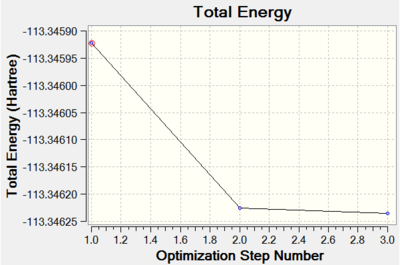
From graphs in Figures X and X, it can be seen that the structures were minimised within 3 optimisation steps which suggests a reasonably low energy initial structure. Unfortunately it is not possible to compare the energies of formation computed because of apparent differences between the basis sets applied.
 |
 |
|||
| Energy Optimisation Curve | RMS Gradient Curve |
 |
 |
|||
| Energy Optimisation Curve | RMS Gradient Curve |
CrCO6 Molecule
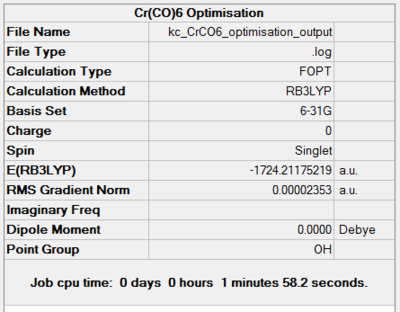
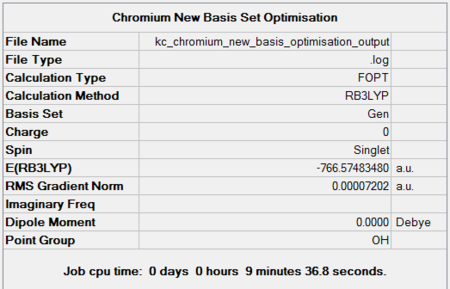
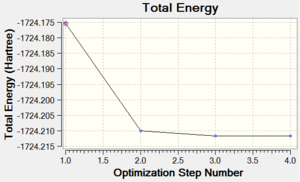
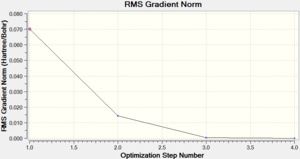
Chromium hexacarbonyl is a neutral homoleptic organometallic complex with octahedral geometry. It has 18 valence electrons and a dipole moment of 0, confirmed by both 6-31G and Mixed Basis Set (MBS) optimisations. The point group is Oh, computed correctly by Gaussian. Convergence to the lowest energy involved only 4 optimisations steps, as shown in Figures 46 and 47. It took about 8 more minutes to optimise the structure using MBS.
 |
 |
|||
| 6-31G Optimisation Summary for CrCO6. DOI:10042/to-11940 | 6-311G(d,p) and LanL2DZ Optimisation Progress for CrCO6. DOI:10042/to-11946 |
 |
 |
 |
||||
| Energy Optimisation Curve | Optimisation Progress | RMS Gradient Curve |
 |
 |
 |
||||
| Energy Optimisation Curve | Optimisation Progress | RMS Gradient Curve |
FeCO5 Molecule
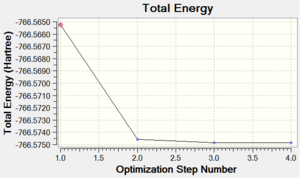
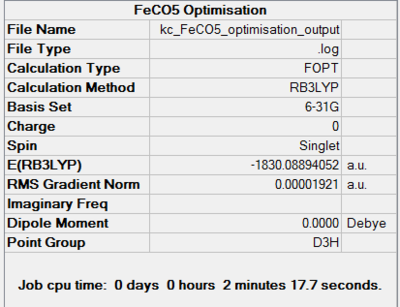
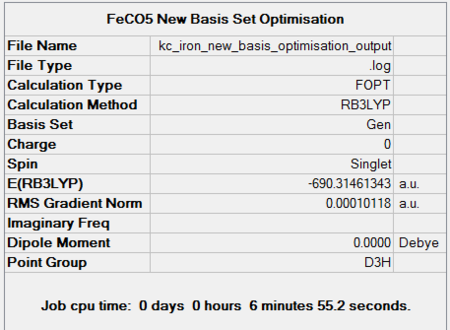
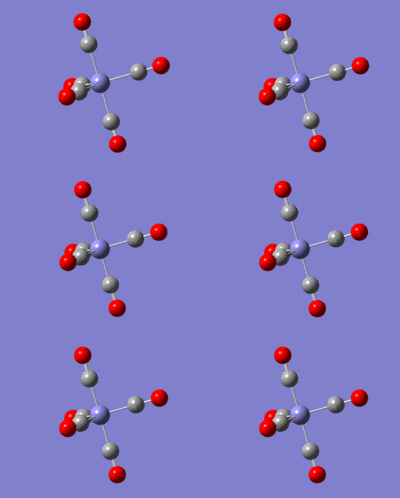
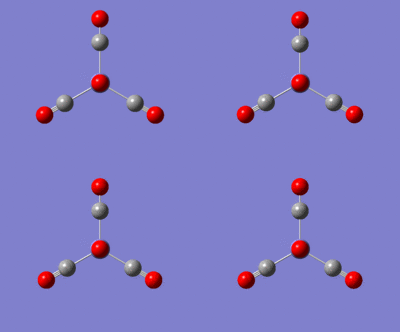
Iron Pentacarbonyl is another homoleptic organometallic complex with 18 valence electrons. It has trigonal bypiramidal geometry. Interestingly, it is, together with nickel tetracarbonyl, a liquid at room temperature and pressure. FeCO5 is formed in a reaction of iron with carbon monoxide at high temperatures and pressures. Like in the case of CrCO6, the point group, D3H, was confirmed by both basis set optimisations. Its dipole moment is, as expected, 0.
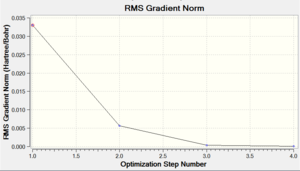
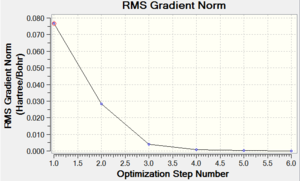
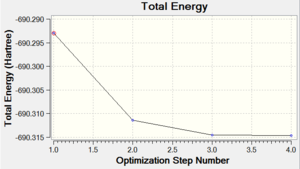
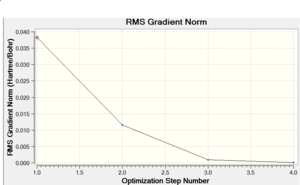
It took 6 steps to optimise the geometry using 6-31G basis set and only 4 using MBS. The energies converged to the minimum very smoothly. The "loose" optimisation took about 4 minutes shorter than MBS.
 |
 |
|||
| 6-31G Optimisation Summary for FeCO5 DOI:10042/to-11941 | 6-311G(d,p) and LanL2DZ Optimisation Progress for FeCO5DOI:10042/to-11947 |
 |
 |
 |
||||
| Energy Optimisation Curve | Optimisation Progress | RMS Gradient Curve |
 |
 |
 |
||||
| Energy Optimisation Curve | Optimisation Progress | RMS Gradient Curve |
NiCO4 Molecule
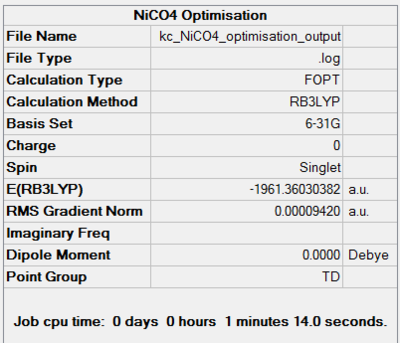
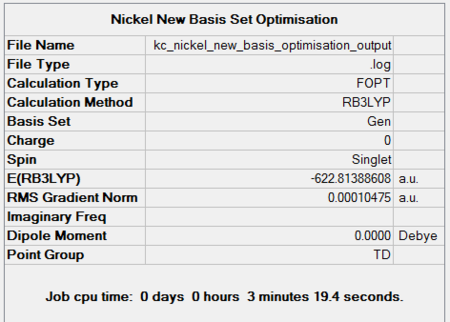
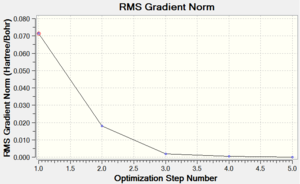
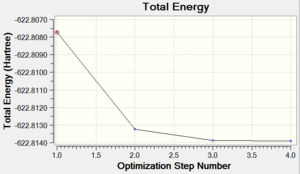
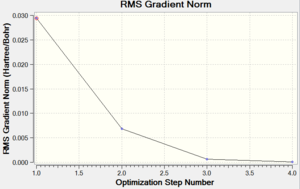
The last homoleptic carbonyl discussed in the Mini Project is nickel tetracarbonyl, a tetrahedral 18 electron complex. It is synthesised in the direct combination of nickel and carbon monoxide at room temperature and pressure. It is in fact the only carbonyl complex formed so readily. Like all other mononuclear carbonyls, it is volatile and toxic which means it has to be handled with extreme care. The point groups and zero dipole moments were predicted correctly using the chosen optimisation techniques. Both progresses of energy convergence are shown in Figures 52 and 53.
 |
 |
|||
| 6-31G Optimisation Summary for NiCO4DOI:10042/to-11942 | 6-311G(d,p) and LanL2DZ Optimisation Progress for NiCO4 DOI:10042/to-11948 |
 |
 |
 |
||||
| Energy Optimisation Curve | Optimisation Progress | RMS Gradient Curve |
 |
 |
 |
||||
| Energy Optimisation Curve | Optimisation Progress | RMS Gradient Curve |
Bond Angles and Lengths
CO Molecule
The 3-21G basis set optimisation predicted the CO bond length to be 1.15 Å. This is in fairly reasonable agreement with the literature value of 1.13 Å[23]. The 6-311G(d,p) optimisation results is however in excellent agreement, as an exact value of 1.12 Å was obtained.
Metal Carbonyl Complexes
The solid-state structures of nickel tetracarbonyl and iron pentacarbonyl are known with limited precision in spite of their importance as prototypical metal carbonyls and as synthetic precursors in organometallic chemistry. The lack of precise studies compared to those run on chromium hexacarbonyl is a consequence of the low melting point, high vapour pressures and toxicity. The crystal structure of chromium hexacarbonyl has been refined with an accurate and extensive X-ray data set collected at 11 K.
Each CrCO6 molecule is a near-regular octahedron. The relevant Cr-C bond, lengths for example, differ by only 0.005 Å. The computational data obtained for Cr-C axial and equatorial bonds under both 6-31G and MBS is in excellent agreement with crystallography data. The difference is only 0.01 Å, for the split-valence basis set. Both Cr-C bond types are the same, according to Gaussian calculations.
In the case of CO bonds, the bond length of the axial ligand is equal to the bond length of the equatorial ligands. The values are 1.17 and 1.14 Å for the loose and tight optimisations, respectively. In this case, the latter is much more accurate when compared to experimental data. The agreement is perfect. The full set of results is shown in Table 7.
| No | Bond Type | 6-31G Optimisation Bond Length [Å] | 6-311G(d,p) and LanL2DZ Optimisation
Bond Length [Å] |
Literature Bond Length [Å][24] |
|---|---|---|---|---|
| 1 | Cr-C (axial) | 1.91 | 1.92 | 1.92 |
| 2 | Cr-C (equatorial) | 1.91 | 1.92 | 1.92 |
| 3 | C-O (axial) | 1.17 | 1.14 | 1.14 |
| 4 | C-O (equatorial) | 1.17 | 1.14 | 1.14 |
The FeCO5 molecule also contains metal-C equatorial and axial bonds. These are however different only by 0.01 Å. The results of both basis sets are in very good agreement with literature, the pseudo potential MBS being slightly better.
Both axial and equatorial CO bond lengths differ more significantly for the 6-31G optimisation, however MBS has again proved to be excellent in predicting the geometry of iron pentacarbonyl. The results are in table 8 below.
| No | Bond Type | 6-31G Optimisation Bond Length [Å] | 6-311G(d,p) and LanL2DZ Optimisation
Bond Length [Å] |
Literature Bond Length [Å][25] |
|---|---|---|---|---|
| 1 | Fe-C (axial) | 1.81 | 1.82 | 1.81 |
| 2 | Fe-C (equatorial) | 1.80 | 1.81 | 1.80 |
| 3 | C-O (axial) | 1.17 | 1.14 | 1.12 |
| 4 | C-O (equatorial) | 1.17 | 1.14 | 1.14 |
In the case of nickel tetracarbonyl the bond lengths are still in good agreement with crystallography data, however for the Ni-C bond length it is the loose optimisation which works better. MBS, on the contrary, predicts the C-O bond length almost flawlessly.
| No | Bond Type | 6-31G Optimisation Bond Length [Å] | 6-311G(d,p) and LanL2DZ Optimisation
Bond Length [Å] |
Literature Bond Length [Å][25] |
|---|---|---|---|---|
| 1 | Ni-C | 1.81 | 1.86 | 1.82 |
| 3 | C-O | 1.16 | 1.14 | 1.13 |
Although not presented in a tabulated form, bond angle analysis has also been carried out. In the octahedral CrCO6 complex, all the C-Cr-C bond angles are perfectly 90°. The axial O-C-Cr-C-O angle is, as expected, 180°.
In the case of FeCO5, there are three different types of bond angles. These are the equatorial C-Fe-C, computed to be perfectly 120° (square planar geometry of the equatorial ligands), axial O-C-Fe-C-O, which is 180° and the C-Fe-C, between the axial and equatorial ligands, found to be 90°, as predicted from the complex's trigonal bipyramidal geometry.
The C-Ni-C angles in the tetrahedral NiCO4 complex are 109.5°, as predicted by crystallography.
The literature source is the same as in the case of bond length.
Frequency Analysis
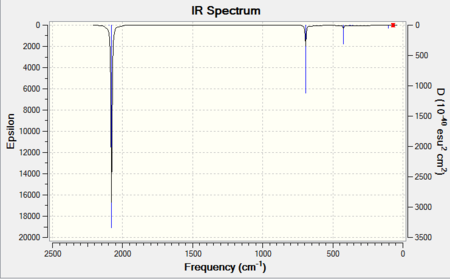
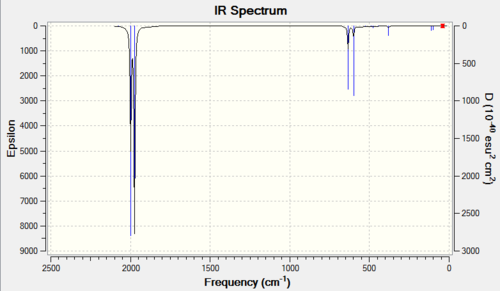
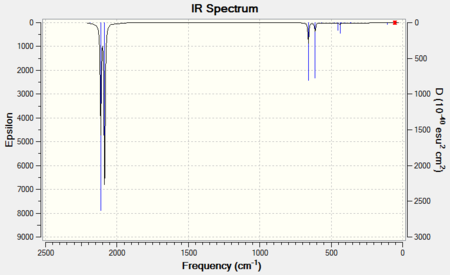
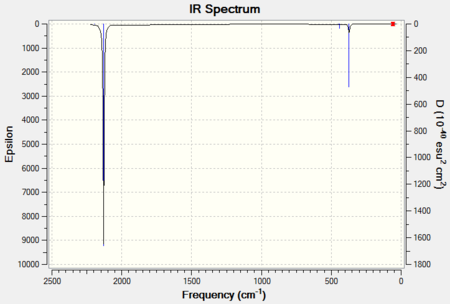
Infrared spectroscopy is a common tool in determining the arrangement of atoms in metal carbonyls. Most CO stretching bands occur in the region of 1700-2100 cm-1, where generally no other organic group bands appear.
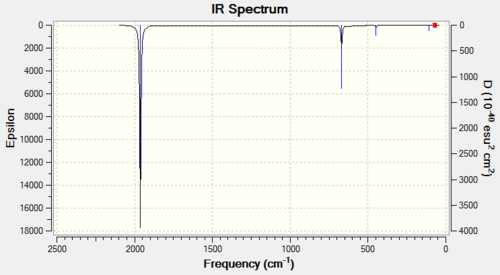
Group theory allows a chemist to predict the number of active CO stretches in IR spectra. If the CO ligands are not related by a centre of inversion or a threefold or higher axis of symmetry, a molecule with n CO groups will have n CO bands. Highly symmetric molecules like chromium hexacarbonyl will exhibit only one band. Only one band is also expected for nickel tetracarbonyl and 2 for iron pentacarbonyl.[7] In the case of chromium hexacarbonyl, there are 33 degrees of vibrational freedom,of whom 12 comprise four T1u modes and 21 others. The symmetries of CO stretching modes are A1g, Eg and T1u, however only T1u is IR active.
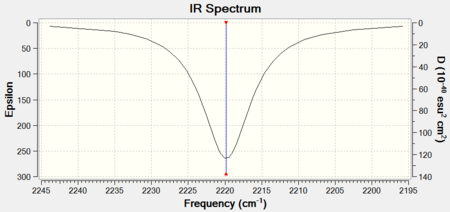
The computed frequencies for free CO (Table 10) do not agree very well with experimental data. The 3-21G basis set gave a more accurate CO stretching frequency, 56 cm-1 lower than the literature one. In the case of the 6-311G(d,p) basis set the difference is 77 cm-1. The spectra are presented underneath the tables, in Figures 55 and 56.
The calculated MBS stretching frequencies for metal carbonyls were generally higher than the experimental ones and those computed using 6-31G were consistently lower. The υco values for the MCOn series of complexes are reported in Table 11 along with literature values. As one moves across the first row of transition metals (from Cr to Ni), one expects an increase in the π donation to each CO since the metal is becoming more electron rich (increasing d-occupancy) and there are fewer CO ligands to share the donated electron density. However the results suggest the opposite. Instead, the dominant factor is the corresponding increase in effective nuclear charge and electronegativity values across the first row of transition metals. Consequently, the π-donor ability of the metal decreases and thus one observes an increase in the stretching frequencies of CO.[20]
The trends are the same for both sets of generated results, however in all cases but iron pentacarbonyl, MBS provides a little bit less accurate stretching frequencies. The values never exceed 100 cm-1 Values calculated at the Hartree-Fock level result in overestimates of about 10-12% due to the neglect of electron correlation. Therefore, it is usual to scale frequencies by an empirical factor of 0.8929. Frequencies computed with methods others than HF are also scaled down similarly to eliminate systematic errors. The scaling factors differ for different basis sets.[3]
It has been shown that while the bond length of CO agrees perfectly with literature, there is a signficant discrepancy in the IR stretching values. The less accurate 3-21G has proved to produce much more accurate bond lengths. Since the same basis sets were applied for CO and CO in metal carbonyls (6-311G(d,p)), it might be that it does not account for the coupling of vibrational modes. This is most likely why the 6-311G(d,p) and MBS computed frequencies for CO and carbonyls, respectively, give consistenly higher theoretical values.
| No | Vibrational Mode | Animation | Description | 3-21G Optimisation Frequency [cm-1] [Intensity] | 6-311G(d,p) Optimisation Frequency [cm-1] [Intensity] | Literature Frequency [cm-1] |
|---|---|---|---|---|---|---|
| 1 | C-O Stretch | 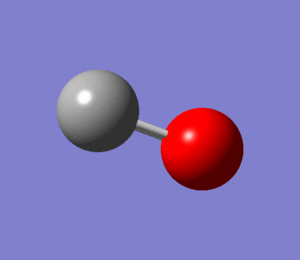 |
Stretching | 2087 [47] | 2220 [76] | 2143[26] |
| No | Molecule | Vibrational Mode | Animation | Description | 6-31G Optimisation Frequency [cm-1]
[Intensity] |
6-311G(d,p) and LanL2D2 Optimisation Frequency [cm-1]
[Intensity] |
Literature Frequency [cm-1][20] |
|---|---|---|---|---|---|---|---|
| 1 | CrCO6 | T1u | 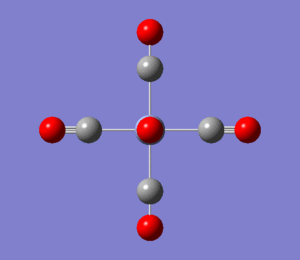 |
C-O Stretch | 1963 [1730] | 2079 [1742] | 2000 |
| 2 | FeCO5 | E' and A2" | 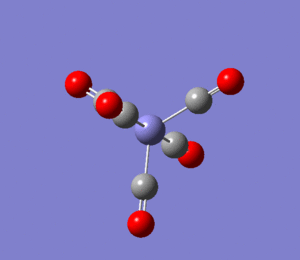 |
C-O Stretch | 1975 [1180]
and 1999 [1399] |
2086 [1182]
and 2114 [1395] |
2074 and 2138 |
| 3 | NiCO4 | T2 | 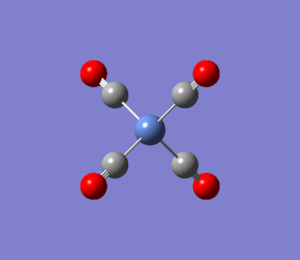 |
C-O Stretch | 2009 [954] | 2130 [885] | 2058 |
CO IR Spectra
There is, of course, only one band present in both spectra.
 |
 |
|||
| 6-31G IR Spectrum for CrCO6 DOI:10042/to-11953 | 6-311G(d,p) and LanL2DZ IR Spectrum for CO DOI:10042/to-11955 |
CrCO6 IR Spectra
The single predicted band is clearly present in both spectra.
 |
 |
|||
| 6-31G IR Spectrum for CrCO6 DOI:10042/to-11943 | 6-311G(d,p) and LanL2DZ IR Spectrum for CrCO6 DOI:10042/to-11949 |
FeCO5 IR Spectra
The two predicted bands are clearly visible in both spectra.
 |
 |
|||
| 6-31G IR Spectrum for FeCO5 DOI:10042/to-11944 | 6-311G(d,p) and LanL2DZ IR Spectrum for FeCO5 DOI:10042/to-11950 |
NiCO4 IR Spectra
The single predicted band is clearly present in both spectra.
 |
 |
|||
| 6-31G IR Spectrum for NiCO4 DOI:10042/to-11945 | 6-311G(d,p) and LanL2DZ IR Spectrum for NiCO4 DOI:10042/to-11951 |
Charge Distribution Analysis
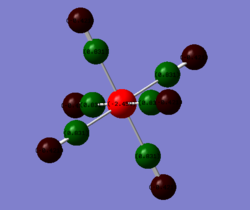
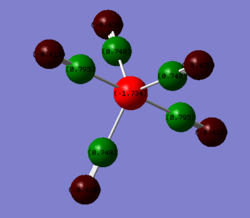
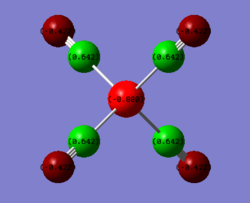
The charge distrbition for each of the four investigated molecules is shown in Figure 59. Bright green colour indicates highly positive charge and bright red highly negative charge. As expected, the metal centres have much more electron density because of their location in the periodic table. On moving from chromium hexacarbonyl to nickel tetracarbonyl the metal centre becomes lighter red and which corresponds to less electron density localised on the atom. This is, as explained earlier, because of the shielding effect of the increasing nuclear charge on going across the period. Polarisation of the M-C bond must change accordingly, hence as the metal centre poorer in electron density, the charge distribution on the carbon gradually approaches negative values. The oxygen atom in turn receives more electron density. The CO bond gets stronger and since energy is directly proportional to frequency, the CO stretching frequency increases.
In comparison with the free CO molecule, the carbon atom is much less electron positve than in the carbonyl complex and the oxygen atom has more electron density. The difference in the actual electronegativity values by Linus Pauling (χC = 2.55, χO = 3.44) corresponds quite well to the difference between the numbers in the NBO analysis: C = 0.466, O = 0.466). The dipole moment of CO, as mentioned earlier is 0.155 D It has the negative end of its dipole on the carbon atom even though the electronegativity difference suggests the opposite. The reversal in the dipole moment can be related to the polarisation of the 5σ MO which moves electron density toward the C atom and into the lobe pointing out and away from the C (more about MOs in the next section).[9]
 |
 |
 |
 |
|||||
| Free CO | CrCO6 | FeCO5 | NiCO4 |
MO Analysis for CO
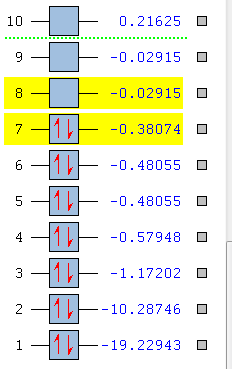
The molecular orbital energy level diagram is given in Figure 60 and the pictorial orbtials are presented in Figure 6. There are a few things to note about the MO diagram:
- There are 10 valence electrons in CO, giving the electronic configuration: 3σ2 4σ2 1π4 5σ2. The 3σ2 electrons are much lower-lying than 4σ2.
- The energy of the O 2s atomic orbital is lower in energy than the corresponding orbital in C.
- The 2p level in O is of lower energy than the one in C.
- The 2s-2p energy separation in O is greater than in C.
The above remarks are consequence of electronegativity difference between the atoms. The result is that the more electronegative of the two which contributes most to a bonding MO because electrons are much more likely to be found on an element with a greater affinity for negative charge. Analogously, antibonding orbitals exhibit a much greater contribution from the less electronegative element.[27]
The LCAO approach MO orbitals are contrasted against Gaussian generated MOs. In Figure X, levels 1, 2 and 3 are the low-lying 1s atomic orbitals of O and C as well as 2s O which do not overlap.
The degenerate pair of 1π MOs (levels 5 and 6) are bonding and have a large contribution from the oxygen atom, for reasons described above. They are formed by the superposition of two p orbitals. The highest occupied molecular orbital (HOMO) is 5σ (level 7) and it is a weakly bonding orbital. It’s major contributor is C. The lowest unoccupied molecular orbital (LUMO) is the doubly degenerate 2π* orbital, mainly C2p in character. The contributions are represented by the relative sizes of orbitals.[13]
A full sigma orbital largely localised on the carbon atom and two empty pi orbitals with mainly oxygen contribution are an ideal illustration of backbonding: the HOMO lone pair of electrons is donated by CO to the metal, resulting in formation of a sigma, while the LUMO antibonding pi orbital acts as an acceptor of electron density from the metal orbitals that exhibit a local pi symmetry (like t2g orbitals in octahedral metal complexes), to the ligand, with the resultant pi bond formation. The HOMO-LUMO gap is large and corresponds to the difference of 0.41 Hartree or 1082 kJ/mol. Metals with high lying HOMOs are able to form a stable bond with the carbonyl.[7]
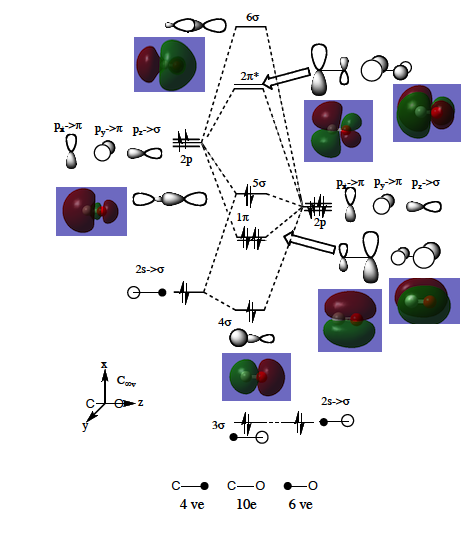
Why is CO such a good pi acceptor ligand in organometallic chemistry? Can it be a good π donor? The scheme in Figure 62 provides answers to these important questions.
First of all, there is a very good overlap between the large 2π* degenerate orbitals on C and metal dAOs. The antibonding carbonyl orbital can accept electron density because of the correct orbital shapes and sizes. The reverse situation is less favourable as the 1π degenerate set of orbitals is not capable of overlapping with the metal d orbitals. Formally the dAO is filled and the π* frontier orbital empty. On forming the molecular orbitals, the electrons are shared over both components and hence some of the electrons end up in the anitbonding orbital of CO. This is why the ligand is called a good π-acceptor.[9]

Conclusions
The assignment allows to investigate factors that affect (among many) the degree of π backbonding in metal carbonyl complexes, bond lengths and angles in popular inorganic compounds, their IR stretching frequencies, MO diagrams and charge distributions. The computational skills gained in the investigation help understand the concept of chemical bonding. Bearing in mind how important computers are for a chemist nowadays, the inorganic computational module has definitely provided a much deeper understanding of the topics covered and the knowledge gain will definitely help in the future, whether at an undergraduate or even higher level.
References
- ↑ Grant, G. H.; Richards, W. G.; Computational Chemistry, Oxford Science Publications, 1995, pp 1-4.
- ↑ Jensen, F.; Introduction to Computational Chemistry, John Wiley & Sons, Ltd, 2007, 2nd edition, pp 80-82.
- ↑ 3.0 3.1 3.2 3.3 3.4 Foresman, J. B.; Frisch, E.; Exploring Chemistry with Electronic Structure Methods, Gaussian, Inc., 2nd edition, 1996.
- ↑ Schuurman, M. S.; Allen, W. D.; Schaefer H. F.; J. Comput. Chem., 2005, 26, 1106-1112 DOI:10.1002/jcc.20238
- ↑ Jonas, V.; Frenking, G.; Reetz, M. T,; J. Am. Chem. Soc., 1994, 116, 8741-8753. DOI:10.1021/ja00098a037
- ↑ Glendening, E. D.; Landis, C. R.; Weinhold, C.; Advanced Review, 2011, 2, 1-42. DOI:10.1002/wcms.51
- ↑ 7.0 7.1 7.2 7.3 Atkins, P.; Overton, T.; Rourke, J.; Weller, M.; Armstrong, F.; Inorganic Chemistry, Oxford University Press, 4th edition, 2006.
- ↑ 8.0 8.1 8.2 8.3 Dr Patricia Hunt, Computational Chemistry Lab, Notes, 2012, Imperial College London.
- ↑ 9.0 9.1 9.2 9.3 9.4 9.5 Dr Patricia Hunt, Molecular Orbitals in Inorganic Chemistry, Lecture Notes, 2012, Imperial College London.
- ↑ Blixt, J.; Glaser, J.; Mink, J.; Persson, I.; Persson, P.; Sandstroem, M.; J. Am. Chem. Soc.; 1995, 117, 5089-5104. DOI:10.1021/ja00123a011
- ↑ Zurek, W. H.; Schieve, W. C.; J. Chem. Phys., 1980, 73, 4061-4065. DOI:10.1063/1.440637
- ↑ Mulliken, R. S.; Ann. Rev. Phys. Chem., 1987, 29, 1-30.
- ↑ 13.0 13.1 Keeler, J; Wothers, P.; Chemical Structure and Reactivity, Oxford University Press, 2008, pp 131-132.
- ↑ http://www.sparkle.pro.br/tutorial/geometry
- ↑ Cotton, F. A.; Darensbourg, D. J.; Klein, S.; Kolthammer, B. W. S.; Inorg. Chem., 1982, 21, 294-299.
- ↑ Hogarth, G.; Norman, T.; Inorganica Chimica Acta. 1997, 254, 167-171.
- ↑ 17.0 17.1 Darensbourg, M. Y.; Darensbourg; J. Chem. Educ.; 1970, 47, 33-35.
- ↑ Ardon, M.; J. Chem. Educ., 2002, 79, 1249-1251.
- ↑ Darensbourg, D.; Inorg. Chem., 1979, 18, 14-17.
- ↑ 20.0 20.1 20.2 Montgomery, C. D.; J. Chem. Educ., 2007, 84, 102-105. DOI:10.1021/ed084p102
- ↑ 21.0 21.1 Mitin, A. V.; Baker, J.; Pulay; P. J. Chem. Phys., 2003, 118, 7775-7782. DOI:10.1063/1.1563619
- ↑ Scuseria, G. E.; Miller, M. D.; Jensen, F.; Geertsen, J.; J. Chem. Phys., 1991, 94, 6660-6664. DOI:10.1063/1.460293
- ↑ Glocker, G.; J. Phys. Chem., 1958, 62, 1049-1054. DOI:10.1021/j150567a006
- ↑ Figgus, B. N.; Sobolev, A. N.; Acta Cryst., 2004, E60, i93-i94.
- ↑ 25.0 25.1 Braga, D,; Grepioni, F.; Orpen, A. G.; Organometallics, 1993, 12, 1481-1483
- ↑ Lamberti, C.; Bordiga S.; Geobardo, F.; Zecchina, A.; Otero Areán, C.; J. Chem. Phys., 1995, 103, 3158-3166.DOI:10.1063/1.470249
- ↑ Housecroft, C, E.; Sharpe, A. G.; Inorganic Chemistry, Pearson Prentice Hall, 3rd edition, 2008, pp 48-49.


