
Rep:Mod2:jib09
Computational Analysis of BH3
Aims
The aim is to use Gaussian Quantum Mechanical calculations to optimized the geometry of BH3 molecule, determine its modes of vibration and predict its Molecular Orbitals.
Structure Optimization
Using the program GaussView a molecule of trigonal planar Boron trihydride (BH3) was drawn and its B-H bond lengths were set to 1.5 A. The method used for the optimization is the Density Functional Theory (DFT) using the B3LYP hybrid functional and the basis 3-21G.
The results of the optimisation are summarised below:
Summary:
File type: .log
Calculation Type: FOPT
Calculation Method: RB3LYP
Basis Set: 3-21G
E(RB+HF-LYP): -26.46226438 a.u.
RMS Gradient Norm: 0.00000294 a.u.
Imaginary Freq:
Dipole Moment 0.0000 Debye
Point Group: D3H
The complete results are referenced as a .log file[1]
The optimisation generated a (BH3) molecule with an optimised B-H bond length of 1.19A and a bond angle of 120⁰. This bond angle is in accordance with a trigonal planar molecule and is in good agreement with literature. The point group is also correctly assigned to D3H with a dipole moment of zero (given that the molecule is symmetrical a zero dipole moment is expected).
Apart from the data agreeing with literature it can also be seen that the optimisation is a correct one given that the gradient is very small (less than 0.001). This indicates that a stationary point was found in the first derivative of energy against internuclear distance. The .log file was also checked to make sure all the parameters converged successfully:
Item               Value     Threshold  Converged?
Maximum Force            0.000090     0.000450     YES
RMS     Force            0.000059     0.000300     YES
Maximum Displacement     0.000352     0.001800     YES
RMS     Displacement     0.000230     0.001200     YES
Predicted change in Energy=-4.580915D-08
Optimization completed.
   -- Stationary point found.
                          ----------------------------
                          !   Optimized Parameters   !
                          ! (Angstroms and Degrees)  !
--------------------------                            --------------------------
! Name  Definition              Value          Derivative Info.                !
--------------------------------------------------------------------------------
! R1    R(1,4)                  1.1945         -DE/DX =   -0.0001              !
! R2    R(2,4)                  1.1945         -DE/DX =   -0.0001              !
! R3    R(3,4)                  1.1945         -DE/DX =   -0.0001              !
! A1    A(1,4,2)              120.0            -DE/DX =    0.0                 !
! A2    A(1,4,3)              120.0            -DE/DX =    0.0                 !
! A3    A(2,4,3)              120.0            -DE/DX =    0.0                 !
! A4    L(2,4,3,1,-2)         180.0            -DE/DX =    0.0                 !
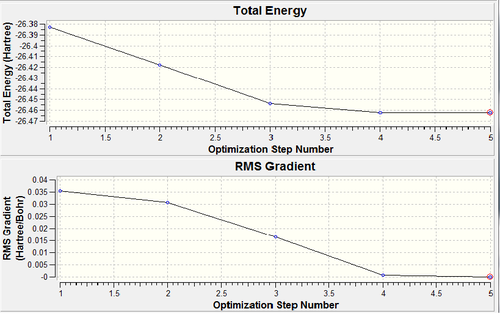
Each parameter converged successfully and every bond length and bond angle is satisfactory. The graphs below show each step in the optimisation. The first graph shows how the energy of the molecule changed after each step (5) in the optimisation, also the root mean squared gradient is shown.

Frequency Analysis
A frequency analysis is run to make sure that the stationary point found in the optimisation is a minimum, as opposed to a maximum which would be a transition state. The analysis was run with the same method and basis set, the summary of the results [2] are shown below:
File Type: .log
Calculation Type: FREQ
Calculation Method: RB3LYP
Basis Set: 3-21G
E(RB+HF-LYP): -26.46226438
RMS Gradient Norm: 0.00000294
Imaginary Freq: 0
Dipole Moment : 0.0000 Debye
Point Group: D3H
As can be seen the total energy obtained is the same as in the optimisation, which indicates that there is no change in geometry, also there are no negative vibrational frequencies indicating that the molecule is in the ground state. The analysis also generated a predicted IR spectrum which is shown below:
Figure 2. Predicted IR spectrum

The predicted IR spectrum shows 3 peaks, but BH3 has 6 vibrational modes. The vibrational modes of the BH3 molecule are discussed and displayed in the Table below:
| no. | Frequency/ cm | Description | Symmetry D3H point group | Form of Vibration | |
| 1 | 1146.03 | Umbrella motion:All 3 H move symmetrically above and below the boron centre. The boron is also slightly displaced up and down. | A2 |  | |
| 2 | 1204.86 | Scissor motion: Two H move in a concerted manner inwards and outwards, with the remaining H and Boron slightly displaced up and down. | E' |  | |
| 3 | 1204.86 | Rocking motion: Two H undergo a rocking motion with a constant angle between the bonds, the remaining H has a motion opposed to the rocking. | E' |  | |
| 4 | 2591.65 | Symmetric Stretch: All H's stretch symmetrically in the plane of the molecule. | A1' |  | |
| 5 | 2730.07 | Asymmetric Stretch:A H stretch in as the other stretch out. | E' |  | |
| 6 | 2730.07 | Asymmetric StretchTwo H's stretch along their bonds as the other H counters this motion by stretching | E' |  |
The discrepancy between the predicted IR spectrum and the modes of vibration can be rationalised by the fact that there are two sets of degenerate stretching frequencies at 1204 and 2730 cm-1 which only generate one peak each.Also, the symmetric stretching mode (A1) which has a predicted frequency of 2591 cm-1 will not be seen in the IR as it does not generate a change in dipole moment as it vibrates.
DOI:10042/to-12002