Rep:Mod2:jg1208 backup
James Gammerman (jg1208): Inorganic Chemistry Computational Laboratory
Introduction
Computational chemistry, sometimes called theoretical chemistry, or molecular modeling, is a field that can be said to be both old and young. It is old in the sense that its foundation was laid with the development of quantum mechanics in the early part of the twentieth century. It is young, however, insofar as arguably no technology in human history has developed at the pace that digital computers have over the last 35 years or so. With the digital computer as their ‘instruments’, computational chemists have taken advantage of this progress to develop and apply new theoretical methodologies at a similarly astonishing pace [1]
This project explores the applications of these methodologies to the realm of inorganic chemistry, in particular a method known as density functional theory (DFT)
The report consists of investigations into the optimal geometry and vibrational analysis of BH3, TlBr3 and the cis/trans isomers of Mo(CO)4PCl2. This is followed by a mini-project, which investigates pi-backbonding in metal-carbonyl complexes.
Background Information
Unlike other methods such as molecular mechanics, density functional theory allows for determination of electron distribution in a molecule, so that behaviour such as nucleophilicity and electrophilicity can be investigated.
Similar to ab initio and semi-empirical methods, DFT makes calculations based on the Schrodinger equation. However, it differs from the other two because DFT doesn’t calculate a wavefunction, but rather it derives the electron distribution (electron density function) directly (a functional is a function of another function). It calculates this using basis sets.
A basis set is a set of mathematical functions, normally representing atomic orbitals (AOs) - initially these AOs were used in the Hartree-Fock method (an ab initio method) and were represented as Slater orbitals, which corresponded to a set of functions which decayed exponentially with distance from the nuclei. Later, Frank Boys realised that the Slater orbitals could themselves be approximated as a linear combination of Gaussian orbitals. These Gaussian basis functions are much easier to compute, because they reduce the 4-centre integrals found in Slater orbitals to finite sums of 2-centre integrals and then 1-centre integrals. These are around 5 orders of magnitude quicker to solve than Slater orbitals, so Gaussian basis functions are much cheaper to use [2]
There are a number of different types of basis set:
- Minimal Basis Sets
These contain the minimum number of basis functions (i.e. AOs) needed for each individual atom. E.g. For H: 1s; For C: 1s, 2s 2px etc.
An example of this is STO-3G, which represents three Gaussian functionals (known as primitives) per Slater Type Orbital. [3]
- Split Valence Basis Sets
These are are larger basis sets and can be used for more complex systems - it increases the number of basis functions per atom. Examples include 3-21G and 6-31G, which have two basis functions of different sizes for each valence orbital. e.g. For the first orbital of H: 1s and 1s'. 3-21G is the simplest basis set which gives reasonable results. In this project is was used to loosely optimise molecules to a first approximation until bigger basis sets could be used.
- Polarised basis sets
Split valence basis sets allow orbitals to change size, but not shape. Polarised basis sets add in orbitals with angular momentum beyond that needed to describe the ground state which removes this limitation. For example, polarised basis sets add d functions to carbon atoms, and even add p functions to hydrogen atoms! Two examples which will appear in this project are 6-31G** and 6-311G**.
6-31G* is a significant improvement on 3-21G due to the added polarisation of atoms, and is considered the best compromise of speed and accuracy. It has become the most popular basis sets [4]
6-311G* is a further improvement as it adds more flexibility to the basis set.
- LACVP basis sets
To understand these we must define the term pseudopotential. Pseudopotentials are a special function that extend the basis set by modeling the core electrons of an atom - these simplify the calculation and allow chemists to focus on the valence electrons which dominate in bonding interactions.
The LACVP series of basis sets is a combination of the 6-31G basis set with the LANL2DZ pseudopotential. Specifically the atoms H-Ar in the periodic table can be described with the 6-31G (or 6-31G*, 6-311G** etc) basis set while the heavier atoms are modeled using the LANL2DZ basis set. This was first employed in this project during the optimisation of TlBr3
Choosing which basis set to use is a key issue when performing computational calculations in chemistry, and this will be discussed throughout the project.
Geometry Optmisation of BH3
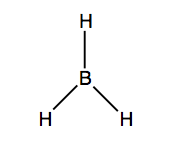
A BH3 molecule (Fig 1) was drawn on GaussView and all bond lengths were set to 1.5 angstroms. The geometry of the molecule was then optimised using the 3-21G basis set. As discussed above, this basis set gives the most reasonable quick calculation, so it was performed using the Gaussian program rather than the SCAN supercomputer. This DFT optimisation calculation employs the Born-Oppenhemier approximation, which solves the Schrodinger equation for the electronic distribution (or density) by moving the nuclei to different positions and measuring the energy in each place.
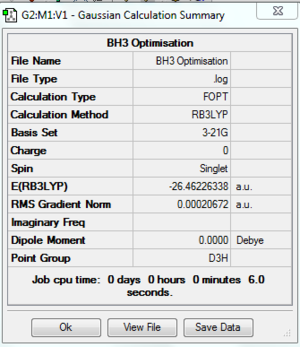
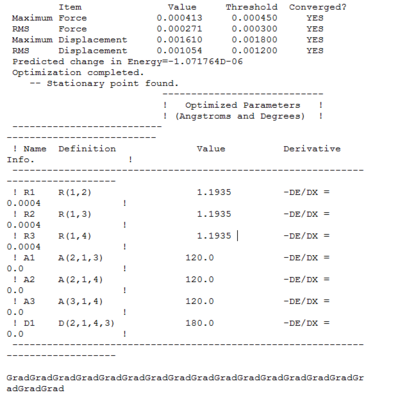
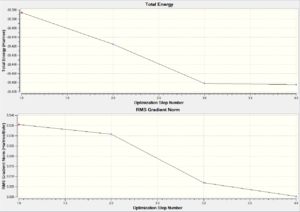
A summary of the optimisation is shown in Fig.2. To verify that the optimisation did indeed converge, the output text file from Gaussian is shown in Fig. 3 and the optimisation plots showing total energy and RMS gradient are shown in Fig. XXX
 |
 |
 |
 |
| ||||
| Optimisation 1st Stage | Optimisation 2nd Stage | Optimisation 3rd Stage | Optimisation 4th Stage |
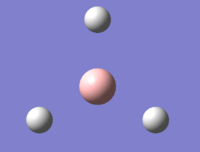
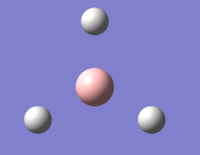
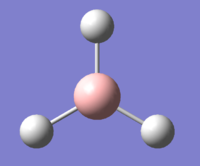
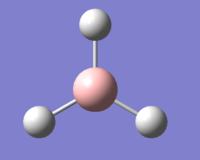
In the first two structures, the molecule appears to have no bonds. This is because GaussView only includes bonds that are shorter than some pre-determined length. Bearing in mind that the molecule is being optimised from a length of 1.5 angstroms to 1.19, it is understandable that GaussView includes bonds in the final two structures.
A jmol visualisation of the optimised BH3 molecule can be found
Finally, an animation of the optimisation was captured, and this is shown in Fig. XXX
[[File:Jg BH3 Optimisation Movie.gif|centre|400px]|thumb|right|Figure XXX: Visualisation of BH3 optimisation]]
However, As mentioned above the second derivative of energy d2E/dR2 must be found to check that we have indeed found a minimum. This is done using vibrational analysis.
Vibrational Analysis
The vibrational modes of BH3 can be calculated in a similar way to the optimisation. Again, DFT was used with the BLYP functional and 3-21G basis set to keep the calculations quick and reasonably accurate.
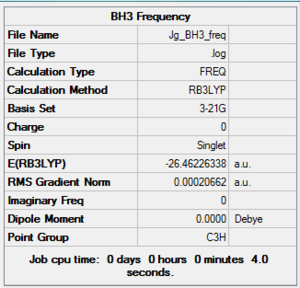 |
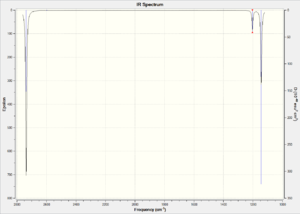 |
| Vibrational Form | Frequency | Intensity | Animation | Symmetry Label | |
|---|---|---|---|---|---|
| 1 | Wagging (out of plane) - The three hydrogens move down the z-axis, while the boron heads in the opposite direction | 1144 cm-1 | XXX |  |
A2 |
| 2 | Scissoring (in-plane) - the hydrogens move up and down in a concerted manner, increasing and decreasing the H-B-H angle | 1203 cm-1 | XXX |  |
E' |
| 3 | Rocking (in-plane) | 1203 cm-1 | XXX |  |
E' |
| 4 | Symmetric Stretch | 2598 cm-1 | XXX |  |
A1' |
| 5 | Asymmetric Stretch | 2737 cm-1 | XXX |  |
E' |
| 6 | Asymmetric Stretch | 2737 cm-1 | XXX |  |
E' |
Molecular Orbital Diagram
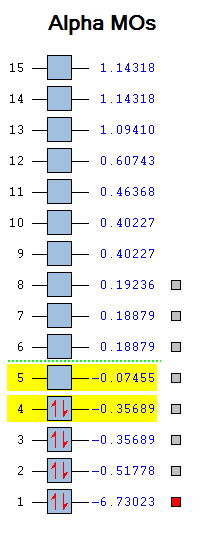 |
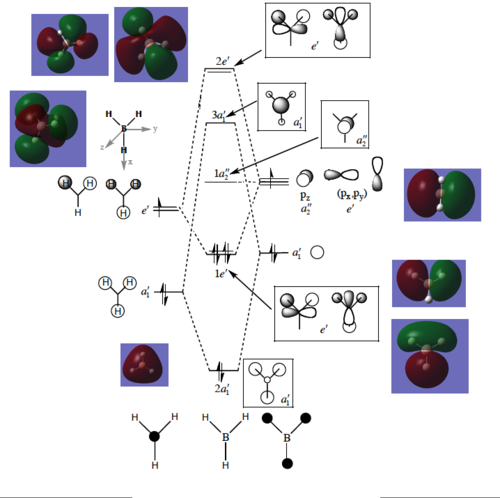 |
|||
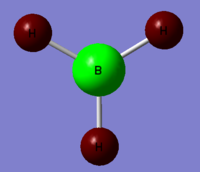
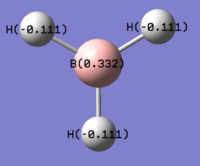
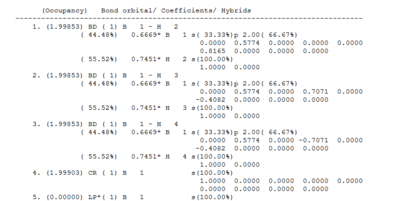
| Charge Distribution for BH3 | Bond Coefficient Data from Output File |
Natural Bond Orbital Analysis
FIX THIS PART!!

|
|
|
||||
| Charge Distribution for BH3 | Quantified Charge Distrbution for BH3 | Bond Coefficient Data from Output File |
TlBr3 Analysis
[insert general structure]
Geometry Optimisation

The log file for the optimised molecule can be found here: File:JG TLBR3 OPTIMISATION.LOG
The optimised TlBr3 molecule can be visualised as a jmol by clicking
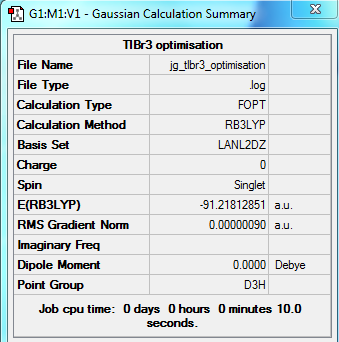
Summary of optimisation & optimisation plots side by side:
 |
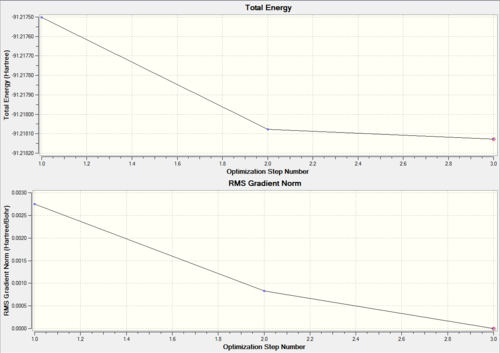 | |||
| Summary of Optimisation | Plots3 |
 |
 |
 |
| |||
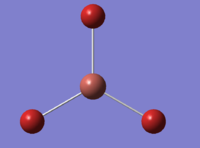
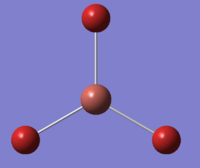
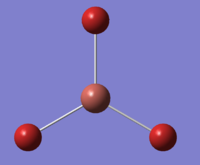
| Optimisation 1st Stage | Optimisation 2nd Stage | Optimisation 3rd Stage |
Frequency Analysis
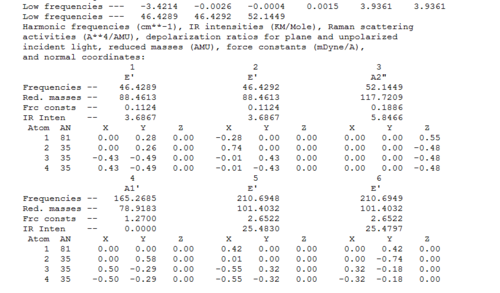
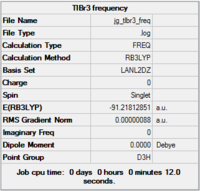
Here is the log file: File:JG TlBR3 FREQ.LOG
 |
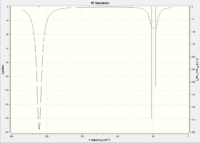 | |||
| Summary of Optimisation | Plots for TlBr3 |
| No | Vibrational Mode | Animation | Description | Frequency [cm-1] | Literature Frequency [cm-1] | Intensity | Symmetry Label |
|---|---|---|---|---|---|---|---|
| 1 | Scissoring (in-plane) |  |
XXX | 46 | XXX | XXX | e' |
| 2 | Rockign (in-plane) |  |
XXX | 46 | XXX | XXX | e' |
| 3 | Wagging (out of plane) |  |
XXX | 52 | XXX | XXX | a2" |
| 4 | Symmetric Stretch |  |
XXX | 165 | XXX | XXX | a1' |
| 5 | Asymmetric Stretch |  |
XXX | 210 | XXX | XXX | e' |
| 6 | Asymmetric Stretching |  |
XXX | 210 | XXX | XXX | e' |
Cis and Trans Isomerism of MO(CO)4(PPh3)2
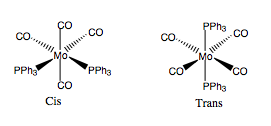
Optimisation using 6-31G
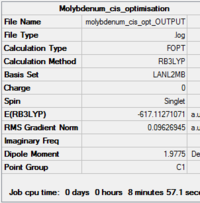 |
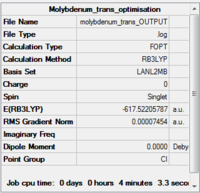 | |||
| Summary of loose optimisation of cis isomer | Summary of loose optimisation of trans isomer |
This optimisation was performed using the SCAN supercomputer, and the log files can be found here:
Cis: DOI:10042/to-11970
Trans: DOI:10042/to-11971
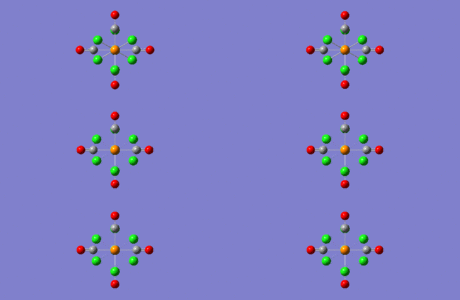
Visualisations of the optimised cis molecule can be found by clicking , and for the optimised trans molecule by clicking
 |
 |
Optimisation using pseudopotentials
 |
 | |||
| Summary of loose optimisation of cis isomer | Summary of loose optimisation of trans isomer |
 |
 |
The log files of the optimisation can be found here:
Cis: DOI:10042/to-11972
Trans: DOI:10042/to-11973
Visualisations of the optimised cis molecule can be found by clicking , and for the optimised trans molecule by clicking
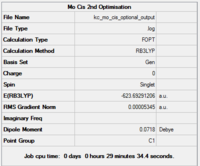
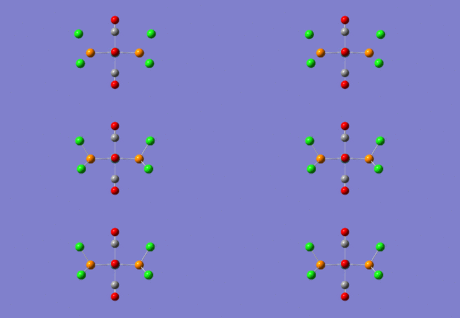
Optimisation using d-orbital-adjusted basis set (optional)
All from KC!
 |
 |
|||
| ... | ... |
 |
 |
Geometry: Bond Angles & Lengths
| Cis Isomer | |||||||||
| Bond | Literature Length /Å | Loose Optimisation Length/ Å | LanL2DZ Optimisation Length /Å | dAO-modified LanL2DZ Optimisation Length/ Å | Angle | Literature Angle | Loose Optimisation Angle | LanL2DZ Optimisation Angle | dAO-modified LanL2DZ Optimisation Angle |
| Mo-C axial | XXX | XXX | XXX | XXX | Cl-P-P-Cl | XXX | XXX | XXX | XXX |
| Mo-C equatorial | XXX | XXX | XXX | XXX | C-Mo-C axial | XXX | XXX | XXX | XXX |
| Mo-P | XXX | XXX | XXX | XXX | C-Mo-C equatorial | XXX | XXX | XXX | XXX |
| C-O axial | XXX | XXX | XXX | XXX | P-Mo-P | XXX | XXX | XXX | XXX |
| C-O equatorial | XXX | XXX | XXX | XXX | Mo-P-Cl | XXX | XXX | XXX | XXX |
| P-Cl | XXX | XXX | XXX | XXX | Cl-P-Cl | XXX | XXX | XXX | XXX |
| Trans Isomer | |||||||||
| Bond | Literature Length /Å | Loose Optimisation Length/ Å | LanL2DZ Optimisation Length /Å | dAO-modified LanL2DZ Optimisation Length/ Å | Angle | Literature Angle | Loose Optimisation Angle | LanL2DZ Optimisation Angle | dAO-modified LanL2DZ Optimisation Angle |
| Mo-C axial | XXX | XXX | XXX | XXX | Cl-P-P-Cl | XXX | XXX | XXX | XXX |
| Mo-C equatorial | XXX | XXX | XXX | XXX | C-Mo-C axial | XXX | XXX | XXX | XXX |
| Mo-P | XXX | XXX | XXX | XXX | C-Mo-C equatorial | XXX | XXX | XXX | XXX |
| C-O axial | XXX | XXX | XXX | XXX | P-Mo-P | XXX | XXX | XXX | XXX |
| C-O equatorial | XXX | XXX | XXX | XXX | Mo-P-Cl | XXX | XXX | XXX | XXX |
| P-Cl | XXX | XXX | XXX | XXX | Cl-P-Cl | XXX | XXX | XXX | XXX |
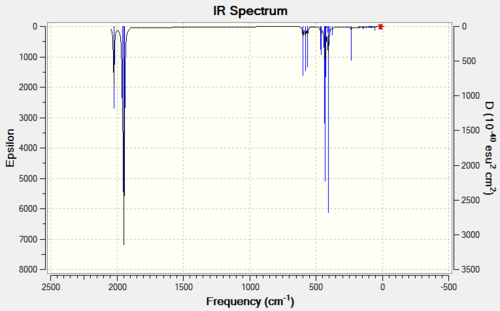
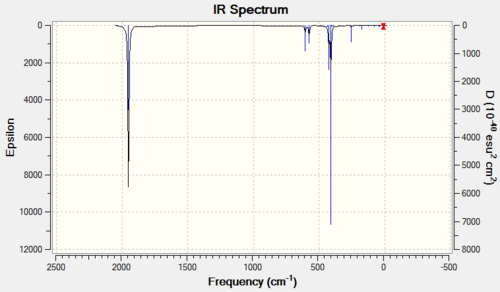
Vibration Analysis
THIS IS ALL KC!!
 |
 |
INSERT TABLE FOR CIS!!!
 |
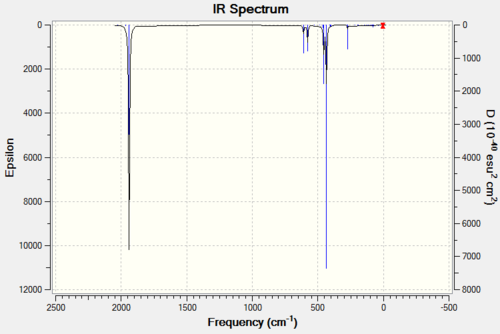 |
INSERT TABLE FOR TRANS!!!
Mini-Project: Investigating the effect of pi-backbonding on carbonyl ligands in a metal complex
Introduction
Since Ludwig Mond reported in 1888 that carbon monoxide (CO) reacts with crude nickel powder (the only metal to do so) to give a colourless, volatile compound C4NiO4, carbon monoxide has remained a curious and obscure ligand for chemists due to its versatility in coordinating to metal centres [5]
The carbon monoxide ligand, known as a carbonyl group, is particularly adept at stabilizing very low oxidation states: many carbonyl complexes such as Fe(CO)5 have the metal ion with an oxidation state of zero.
The bonding of CO to a metal centre can be described as follows. We picture the lone pair of the carbon atom as a Lewis sigma base (or electron-pair donor) and the empty antibonding orbital of the CO as a Lewis pi acid (or electron-pair acceptor), which receives pi-electron density from the filled d-orbitals on the metal atom. We can therefore picture the bonding in this molecule to consist of two contributions: a sigma bond from the ligand to metal atom and a pi bond from the metal atom to ligand. This type of pi-bonding is sometimes referred to as pi-backbonding. [6]
PIC PIC PIC PIC
Carbon monoxide is not very nucleophilic, suggesting that sigma bonding to the d-metal atom is weak. Since many d-metal carbonyl complexes are very stable, the pi-backbonding contribution must be very strong, so we can conclude that the stability of these complexes comes predominantly from the pi-accepting ability of CO. This theory is corroborated by the fact that stable carbonyl complexes exist only for metals with filled d-orbitals with an energy suitable for donation to the CO antibonding orbital. The bonding of CO to a metal d atom can be described as being synergistic: the pi backbonding from the metal to the CO increases the electron density on the CO, which in turn increases the ability of the OC to form a sigma bond to the metal atom.
A more formal description of the bonding can be derived from the molecular orbital diagram of CO, which is discussed later in this mini-project.
What happens when the carbonyl group is bonded to different metal centres? The aim of this mini-project is to explore this question, with reference to three compounds: Free carbon monoxide (for comparison), V(CO)6 and Cr(CO)6.
The latter two have metals which are adjacent moving from left to right in the periodic table – one might therefore expect an increase in pi donation to the CO as the metals become more electron-rich. However, experiments have shown [7] that the opposite is in fact true: the dominant factor is the increase in nuclear charge and electronegativity values across the first period of the transition metals. This lowers the pi-donor ability of the metal centre, which in turn lowers the bond order of the M-C bond and increases νCO. Can DFT confirm this? If it can, which basis set is the 'best' (i.e. gives the value closest to experimental results)?
To investigate find out, the bond lengths and vibrational spectroscopy of these molecules were computed using various basis sets and compared with literature.
Basis set selection
As discussed in the background information, there are a many kinds of basis sets, and the more accurate ones often require more time (and money!) to be used.
For the metal complexes, the 6-31G basis set was chosen as it is a popular set which offers a good compromise in terms of speed and accuracy. The LanL2DZ is an effective core basis set which is better for heavier, inorganic atoms such as vanadium and chromium, so it is interesting to see how it compares to 6-31G.
For free CO, the 3-21G basis set was used to loosely optimise the molecule. It is the poorest of the basis sets, so was compared with 6-31G, which allows for polarisation of atoms, and 6-311G(d,p), which is a more flexible basis set.
Optimisation of Geometry
CrCO6
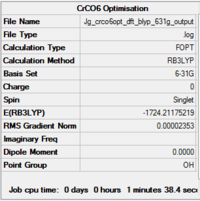
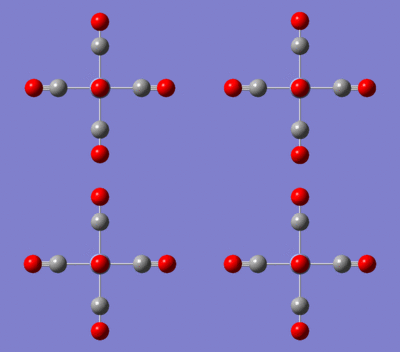
The molecule was first optimised using the 6-31G basis set, then using LanL2DZ.
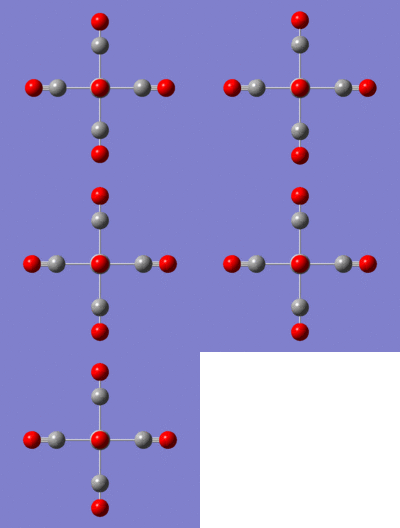
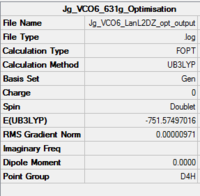
The summaries of the optimisations are shown in Fig. XXX... It should be noted that the molecule was restricted to Oh symmetry, which is the point group of monoloeptic hexacarbonyls [6]
 |
 |
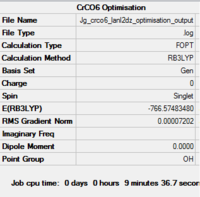 | ||||
| Summary of loose optimisation of CrCO6 using 6-31G DOI:10042/to-11974 | Animation of Optimisation of CrCO6 using LanL2DZ | Summary of tighter optimisation of CrCO6 using LanL2DZ DOI:10042/to-11980 |
The LanL2DZ optimised molecule can be visualised by clicking
V(CO)6
 |
 |
 | ||||
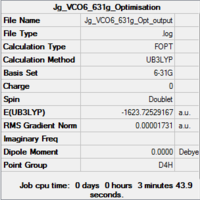
| Summary of loose optimisation of VCO6 using 6-31G DOI:10042/to-11974 | Film of Optimisation of VCO6 using LanL2DZ | Summary of tighter optimisation of VCO6 using LanL2DZ DOI:10042/to-11980 |
The LanL2DZ optimised molecule can be visualised by clicking
Free CO
| Summary of loose optimisation of Free CO using 3-21G DOI:10042/to-11978 | Summary of optimisation of VCO6 using 6-31G DOI:10042/to-11982 | Summary of optimisation of Free CO using 6-311G DOI:10042/to-11983 |
The LanL2DZ optimised molecule can be visualised by clicking
Bond Lengths
The bond lengths of the molecules were obtained from the output files of the two optimisations for comparison with literature. Pictures of the relevant sections of the output files are shown in Fig.XXX and the bond lengths are compiled and compared in Table XXX.
CrCO6
The bond lengths for the two sets are shown in Fig XXX
 |

| |||
| Bond lengths/angles of CrCO6 using 6-31G | Bond lengths/angles of CrCO6 using LanL2DZ |
VCO6
The bond lengths for the two sets are shown in Fig.XXX
 |
 |
|||
| Bond lengths of VCO6 using 6-31G | Bond lengths of VCO6 using LanL2DZ |
Free CO
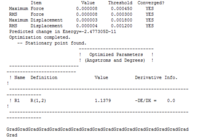
The bond lengths for the three basis sets used are shown in fig.XXX
 |
 |
 |
||||
| Bond lengths/angles of Free CO using 3-21G | Bond lengths/angles of Free CO using 6-31G | Bond lengths/angles of Free CO using 6-311G |
Discussion of Bond Lengths
|
| ||||||
| Bond Length Analysis of CO | Bond Length Analysis of Cr(CO)6 | Bond Length Analysis of V(CO)6 |
The results provide an interesting insight into the accuracy of the basis sets.
For Free CO, as expected the 6-311G(d,p) basis set gave the best result, with a value within 0.02 angstroms of the literature. However, contrary to expectations the 6-31G set gave a worse value than the 3-21G set.
For the metal complexes the results differ: The LanL2DZ basis set is designed to be better suited to heavier metal atoms than 6-31G, and this is shown for the Cr(CO)6 molecule, in which LanL2DZ predicts all the bond lengths closer to the literature values. However, for V(CO)6 the LanL2DZ comes up short for the V-C bonds. We would not expect this, as it is the metal-carbon bonds which LanL2DZ should describe best! The answer to this problem can be found in the optimisation summaries: Unlike Cr(CO)6, when V(CO)6 was optimised the molecule was not subjected to restricted Oh geometry. Examination of the summary reveals that the optimised molecule has a point group of D4H. It is most likely this error in the method of optimisation that explains the unusually poor values for bond length obtained by the LanL2DZ basis set.
Further investigation would involve repeating this calculation, and also using other basis sets such as 6-311++G** which provides more diffuse functions, and 6-311++G(2df,2pd) which improves polarisation further.
SAY MORE HERE!!!.
Vibration Analysis
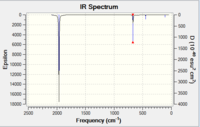
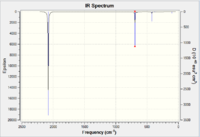
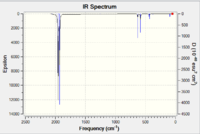
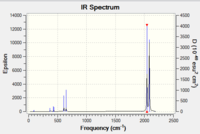
Most CO stretching bands occur in the range 2100-1700cm-1 and a prediction can be made about the number of active CO stretches in the IR and Raman spectra using group theory. If the CO ligands are not related by a centre of inversion or a threefold or higher symmetry axis, a molecule with N CO ligands will have N CO stretching absorption bands [6]. However, the hexacarbonyl complexes have a centre of inversion so we can predict that the computed spectra should have one main band in the region 2100-1700cm-1 - where it is exactly depends on the identity of the metal centre, and this will give us more information about the degree of pi-backbonding in the complexes.
Cr(CO)6
The output file of the optimisation was used to calculate the vibrational modes of the molecule using the SCAN supercomputer.
 |
 |
|
 |

| ||||
| IR Spectrum of CrCO6 using 6-31G DOI:10042/to-11975 | Table of main vibrational stretches using 6-31G | IR Spectrum of CrCO6 using LanL2DZ DOI:10042/to-11984 | Table of main vibrational stretches using LanL2DZ |
VCO6
 |
 |
| ||
| IR Spectrum of V(CO)6 using 6-31G DOI:10042/to-11977 | IR Spectrum of V(CO)6 using LanL2DZ DOI:10042/to-11986 |
Free CO
 |
 |
| ||
| IR Spectrum of Free CO using 3-21G DOI:10042/to-11977 | IR Spectrum of V(CO)6 using 6-311G(d,p) DOI:10042/to-11986 |
Discussion of Results

Table XXX gives some rather surprising results. It shows that for both the metal complexes, the basis set which gave the value closest to literature was in fact 6-31G, not LanL2DZ, which is supposed to be better suited to heavier atoms.
As predicted in the introduction, the computed spectra show that complexes with metals further to the right in the periodic table give higher v(CO)s. This is due to their higher electronegativity and nuclear charge, which reduces their tendency to donate their pi electrons to the metal in backbonding.
Free CO, which obviously has no pi backbonding into the carbon pi* orbital, naturally has a higher v(CO), and as expected it is found that the 6,311G(d,p) basis set gives a much more accurate value than 3-21G - within 8cm-1 of the literature value.
Molecular Orbital Diagram of CO
The molecular orbitals of the CO molecule can be computed in the same way as for BH3 earlier in this report. Before construction of the diagram, we should note that 1) Oxygen is more electronegative than carbon, so its s and p orbitals are lower down and 2) the energy separation between 2s and 2p is greater in oxygen than in carbon. The MOs were calculated using the 6-311G(d,p) basis set in density functional theory by adding the key words "pop=full" into the Gaussian calculation. The final MO diagram showing combination of the AOs of C and O is given in Fig.XXX, along with a comparison of the computed MOs calculated in this experiment and in literature [8]
 |
 |
 |
| |||
| Molecular Orbital Diagram of CO, with Calculated Orbitals Superimposed | Experimental Computational Calculations of Molecular Orbitals | Literature Computational Calculations of Molecular Orbitals |
The diagram is best explained by Housecroft and Sharpe [8] As we can see, the ground state configuration of CO is 1σ22σ21π43σ2
The 1σ orbital is mostly located on oxygen and is nonbonding [8]. The 2σ orbital is bonding. The 1π orbitals mostly consist of the doubly degenerate pair of bonding pi orbitals, with mainly C2p orbital character. The HOMO in CO is 3σ and is predominantly C2pz in character, largely nonbonding and located on the C atom. The LUMO is the doubly degenerate pair of antibonding pi orbitals, with mainly C2p orbital character.
This combination of frontier orbitals - a full sigma orbital largely localised on carbon and a pair of empty pi orbitals - is one reason why metal carbonyls are such a characteristic feature of the metals: in d-metal carbonyls, the HOMO lone pair orbital of CO participates in the formation of a σ bond and the LUMO antibonding pi orbital participates in the formation of pi bonds to the metal atom.
Conclusion
DFT has been used to explore the effect of pi-backbonding in metal carbonyl complexes. It has been shown that, in accordance with theory, the vibrational frequency of free CO is highest of all as there is no pi backbonding from a metal ion, and the vibrational frequency of the CO ligands in the complexes moves higher in wavenumber/frequency moving right across the third period as the metals become more electronegative and pi-backbond less to the CO.
Various basis sets have been compared for the three molecules with some predicted, and some unpredicted results. SAY MORE HERE!!
- ↑ Cramer C.J.; Essentials of Computational Chemistry - Theories and Models; 2nd Ed.; John Wiley & Sons; p.1
- ↑ Young D.C. ‘Computational Chemistry: A practical guide for applying techniques to real-world problems’, John Wiley & Sons, Inc.; 2001, 336
- ↑ Foresman J.B; Frisch E.; Exploring Chemistry with Electronic Structure Methods, 2nd Ed.; 1996, 97
- ↑ http://www.wavefun.com/support/sp_compfaq/Basis_Set_FAQ.html
- ↑ Hill. A.F.; Organotransition Metal Chemistry, RSC Texts, 2002, 42
- ↑ 6.0 6.1 6.2 Atkins. P; Shriver & Atkins Inorganic Chemistry; 5th Ed.; 2010, 541
- ↑ Montgomery C.D.; J. Chem. Ed.; Jan 2007, 84, 1, p.102
- ↑ 8.0 8.1 8.2 Cite error: Invalid
<ref>tag; no text was provided for refs namedHousecroft

