Rep:Mod2:jc808
Inorganic Computation Chemistry: Module 2
Molecular analysis of BH3 and TlBr3
Optimising a molecule of Borane
Using Gaussview V.5 a single BH3 was created and had all three bond lengths increased to 1.5Å. This structure was submitted to Gaussian with the following commands:
•Method: B3LYP
•Basis Set: 3-21G
•Calculation: OPT
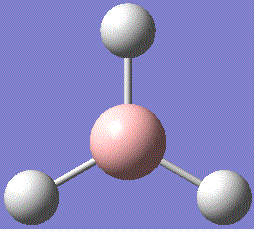
Fig. 1: Structure of BH3
The returned .log files was opened to give the optimised structure and the following summary. There are several things to note from the summary. Firstly, that it had returned bond lengths of 1.194Å, close to the original value and a literature[1] value of 1.19Å found by a similar calculation. Secondly, the bond angle is 120°, which is to be expected for a trigonal planar molecule with three identical substituents i.e. D3h symmetry. Also, the fact that there is a dipole moment of 0D shows that the molecule is symmetric in all directions. The energy of -26.46226438 a.u. does not have any relation to a thermodynamic property, but can be used to compare to other calculations.
| File Type | .log |
| Calculation Type | FOPT |
| Calculation Method | RB3LYP |
| Basis Set | 3-21G |
| Final Energy / a.u. ± 3.81x10⁻³ | -26.46226438 |
| Final Energy / kJ mol-1 ± 10.0 | -69476 |
| RMS Gradient Norm / a.u. | 0.00000285 |
| Dipole Moment / Debye ±0.01 | 0.00 |
| Point Group | D3h |
| Job Time / s | 31.0 |
| Final B-H Bond Length / Å ± 0.01 | 1.19 |
| Final H-B-H Bond Angle / o ± 0.1 | 120.0 |
The RMS gradient is very low and so the calculation should be complete. This can be proved visually by opening the optimisation result and checking that the energy stays constant for the last two steps, as shown below:

Fig. 2: Total Energy and RMS gradient graphs for BH3 optimisation
It can be seen that the energy has reached a minimum and that the RMS gradient is close to zero, meaning no change.
This can be confirmed further by checking the .log file. The important information is shown below:
       Item               Value     Threshold  Converged?
Maximum Force            0.000006     0.000450     YES
RMS     Force            0.000004     0.000300     YES
Maximum Displacement     0.000022     0.001800     YES
RMS     Displacement     0.000015     0.001200     YES
Predicted change in Energy=-1.886451D-10
Optimization completed.
   -- Stationary point found.
                          ----------------------------
                          !   Optimized Parameters   !
                          ! (Angstroms and Degrees)  !
--------------------------                            --------------------------
! Name  Definition              Value          Derivative Info.                !
--------------------------------------------------------------------------------
! R1    R(1,2)                  1.1944         -DE/DX =    0.0                 !
! R2    R(1,3)                  1.1944         -DE/DX =    0.0                 !
! R3    R(1,4)                  1.1944         -DE/DX =    0.0                 !
! A1    A(2,1,3)              120.0            -DE/DX =    0.0                 !
! A2    A(2,1,4)              120.0            -DE/DX =    0.0                 !
! A3    A(3,1,4)              120.0            -DE/DX =    0.0                 !
! A4    L(2,1,4,3,-2)         180.0            -DE/DX =    0.0                 !
--------------------------------------------------------------------------------
The first set of information tells us that the calculation has arrived at a stationary point and further calculation would result in only a small change in energy. The R values in the next set of information refer to bond lengths and the A values are bond angles. This shows that the calculation has reached the values quoted above with zero derivative, meaning no change. Note that the value A4 corresponds to the sum of all bond angles and as the result is 180° it can be deduced that the molecule is trigonal planar.
Molecular Orbitals of BH3
The previously optimised BH3 file was re-opened in Gaussian and a new calculation setup begun. This time, the job type was set to energy and the Full NBO type selected before being submitted to the SCAN cluster with the following heading:
'# opt b3lyp/6-31g geom=connectivity pop=full
Once complete, the MOs can be visualised.
BH3 molecular orbital analysis .log file
| Molecular orbital | 8 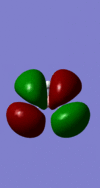 |
7  |
6  |
5 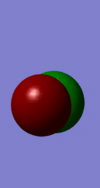 |
4  |
3 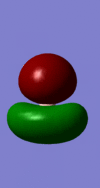 |
2  |
1  |
| Energy / a.u. | 0.1793 | 0.1793 | 0.1660 | -0.0682 | -0.3529 | -0.3529 | -0.5152 | -6.7664 |
| Occupied | No | No | No | No | Yes | Yes | Yes | Yes |
These MO representations can be added to an MO diagram[2] generated by the LCAO approach.

Fig. 3: MO diagram of BH3 with overlaid calculated orbitals
The orbitals predicted by the LCAO approach are highly simplified and assume that the atomic orbitals retain their original shape. However, the more accurate results given by the calculation match very closely to the predicted in both energy ordering, shape, location and phase. This shows that MOs calculated in this method can give very reliable results that are closer to the real situation than that predicted by the LCAO approach. For larger molecules with complex orbital interactions, computatinal methods hold an advantage over LCAO.
NBO analysis of BH3
Loading the .log file from the population analysis can then be used to visualise the charge distribution of BH3.
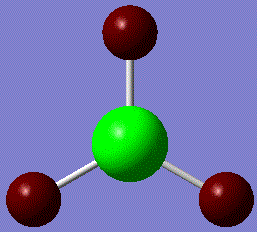
Fig. 4: charge distribution of BH3
The above picture shows areas of high positive charge (green) and negative charge (red). The above distribution is to be expected as the boron atom is Lewis acidic and readily accepts electrons.
Alternatively, the charges can be displayed numerically. It is found that boron shows +0.096 while the hydrogens each have -0.032. This sums to zero as the molecule does not have an overall charge. This is confirmed in the .log file text as it give the same ratio of charges.
Further information can be found in the .log file:
 (Occupancy)   Bond orbital/ Coefficients/ Hybrids
---------------------------------------------------------------------------------
    1. (1.99852) BD ( 1) B   1 - H   2
               ( 45.37%)   0.6736* B   1 s( 33.33%)p 2.00( 66.67%)
                                           0.0000  0.5774  0.0000  0.0000  0.0000
                                           0.8165  0.0000  0.0000  0.0000
               ( 54.63%)   0.7391* H   2 s(100.00%)
                                           1.0000  0.0001
    2. (1.99852) BD ( 1) B   1 - H   3
               ( 45.37%)   0.6736* B   1 s( 33.33%)p 2.00( 66.67%)
                                           0.0000  0.5774  0.0000  0.7071  0.0000
                                          -0.4082  0.0000  0.0000  0.0000
               ( 54.63%)   0.7391* H   3 s(100.00%)
                                           1.0000  0.0001
    3. (1.99852) BD ( 1) B   1 - H   4
               ( 45.37%)   0.6736* B   1 s( 33.33%)p 2.00( 66.67%)
                                           0.0000  0.5774  0.0000 -0.7071  0.0000
                                          -0.4082  0.0000  0.0000  0.0000
               ( 54.63%)   0.7391* H   4 s(100.00%)
                                           1.0000  0.0001
This summarises the three bonds found in the molecule. Each bond is made up of a 45.37% contribution from boron and 54.63% from hydrogen. Also, the boron atom consists of 33.33% s-character and 66.67% p-character, meaning sp2 hybridisation. Confirming the trigonal planar geometry.
Vibrational analysis and confirming minima
The original optimisation .log file was opened and submitted for a Gaussian frequency calculation with the following heading:
'# freq b3lyp/3-21g geom=connectivity pop=(full,nbo)
| File Type | .log |
| Calculation Type | FREQ |
| Calculation Method | RB3LYP |
| Basis Set | 3-21G |
| Final Energy / a.u. ± 3.81x10⁻³ | -26.46226438 |
| Final Energy / kJ mol-1 ± 10.0 | -69476 |
| RMS Gradient Norm / a.u. | 0.00000294 |
| Imaginary Freq | 0 |
| Dipole Moment / Debye ± 0.01 | 0.00 |
| Point Group | D3h |
| Job Time / s | 13.0 |
The fact that the energy is identical to that found in the original optimisation implies that the same geometry has been kept.
The .log file gives vibrational frequencies of the BH3 molecule of 1146, 1205, 2593, 2731 cm-1 (note 1205 and 2731 cm-1 each have two degenerate vibrations). This compares quite well the a literature[3] values of 1140 and 1220 cm-1 found in a gas phase spectrum, considering the low level method used in the calculation.
Gaussian can animate the vibrations. (Note all of the diagrams below are viewed along the z-axis)
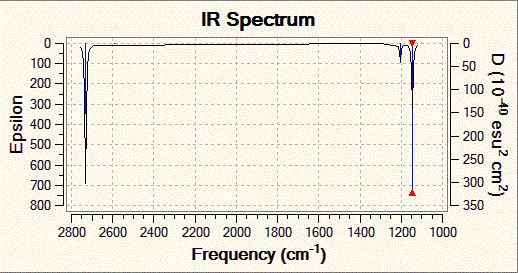
Fig. 5: Infrared spectrum of BH3
Despite the six vibrational frequencies identified by Gaussian and the 3N-6 rule, the accompanying spectrum only displays three peaks. There are two reasons for this. Firstly, there are two doubly degenerate frequencies meaning that vibrations 2 and 3, and 5 and 6 are overlapped. Secondly, as the above table shows, vibration 4 has zero intensity. Looking at the stretch, all three hydrogen-boron bonds stretch equally. This cancels out the dipole moment and so this particular stretch is not visible in infrared spectroscopy.
Thallium Bromide Optimisation
Using Gaussview, a molecule of square planar TlBr3 was created and constrained to the D3h symmetry with a very tight tolerance (0.0001). This molecule was then submitted to Gaussian using the following method:
'# opt b3lyp/lanl2dz geom=connectivity

Fig. 6: Structure of TlBr3
Once complete, the summary was opened:
TlBr3 geometry optimisation .log file
| File Type | .log |
| Calculation Type | FOPT |
| Calculation Method | RB3LYP |
| Basis Set | LANL2DZ |
| Final Energy / a.u. ± 3.81x10⁻³ | -91.21812851 |
| Final Energy / kJ mol-1 ± 10.0 | -239493 |
| RMS Gradient Norm / a.u. | 0.002750 |
| Dipole Moment / Debye ± 0.01 | 0.00 |
| Point Group | D3h |
| Job Time / s | 31.0 |
| Final Tl-Br Bond Length ± 0.01 / Å | 2.65 |
| Final Br-Tl-Br Bond Angle ± 0.1 / o | 120.0 |
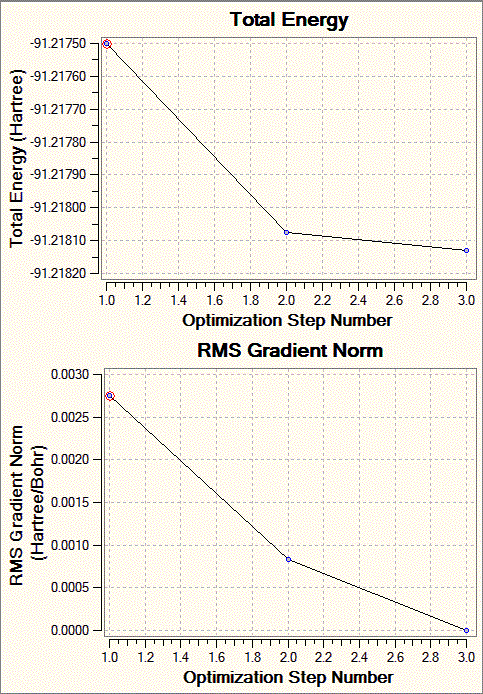
Fig. 7: Total Energy and RMS gradient graphs for TlBr3 optimisation
It can be seen that the gradient is not as close to zero as for the BH3 optimisation, but still around an acceptable level.
A literature[4] value of 2.512Å was found. This compares quite well with that calculated above, 2.65Å. The small discrepancy is likely due to the fact that the above study was conducted in aqueous solution. When complexed to the thallium, the oxygen of water donates electrons. This higher electon density allows stronger bonds to be made to the bromine and therefore shorter bonds.
Vibrational analysis of Thallium Bromide
The .log file for TlBr3 was submitted to a Gaussian calculation with the following heading:
'# freq b3lyp/lanl2dz geom=connectivity pop=(full,nbo)
This of course is the same method as used for the optimisation. This ensures that the results will be comparable. The results are tabulated below:
| File Type | .log |
| Calculation Type | FREQ |
| Calculation Method | RB3LYP |
| Basis Set | LANL2DZ |
| Final Energy / a.u. ± 3.81x10⁻³ | -91.21750131 |
| Final Energy / kJ mol-1 ± 10.0 | -239491 |
| RMS Gradient Norm / a.u. | 0.00275 |
| Imaginary Freq | 0 |
| Dipole Moment / Debye ± 0.01 | 0.00 |
| Point Group | D3h |
| Job Time / s | 19.0 |
Again, the gradient is considerably higher than others performed, but still low enough that it can be assumed the energy is reaching a minimum. The fact that it has a similar energy to the previous optimisation means that the geometry has not changed considerably.
The calculated frequencies can be displayed as previously and are summarised below:
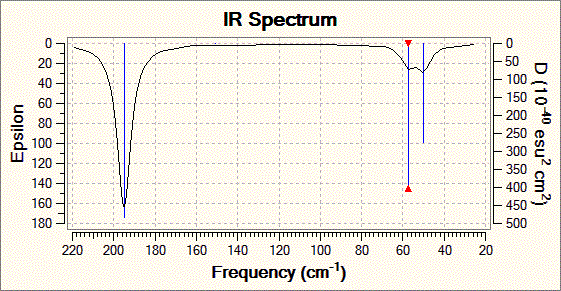
Fig. 8: Infrared spectrum of TlBr3
The "low" frequencies are given are given in the .log file: Low frequencies -0.0008, -0.0004, -0.0003, 18.6824, 19.5013, 19.5013. These do not show up in the spectrum and consist of very low energy vibrations of the whole molecule. Of course negative energies do not make sense, but it can be assumed that to the level of the calculation a value of down to -10cm-1 is acceptable. The fact that all the low frequencies are above (or close to) zero proves that the minimum found on the energy surface is a true minimum. If the low frequencies were much below zero, this would mean that the calculation had only arrived at a false minimum and further and more accurate optimisation is needed.
Isomers of Mo(CO)4(PPh3)2
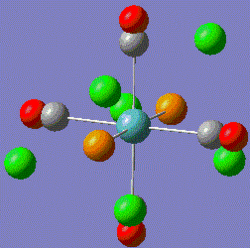
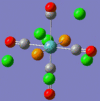
Both the cis- and trans- isomers of Mo(CO)4(PCl3)2 were submitted to the SCAN cluster for geometry optimisation using the B3LYP method and the LANL2MB basis set. The returned summaries and structures are shown below:
 |
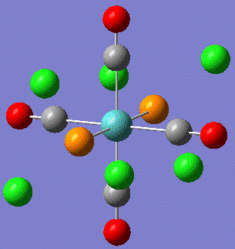 |
Fig. 9: Cis and Trans geometries of the molybdenum complex
|
|
| Cis-complex optimisation .out file | Trans-complex optimisation .out file |
Note that the energies are almost identical and can be considered to have minimised as the gradient is very low. There is a large difference in the dipole moment. The trans-complex has a dipole moment of 0D as the effect of each PCl3 group will cancel each other out. The cis-complex will has a dipole moment of 8.6244D directed between the two PCl3 groups.
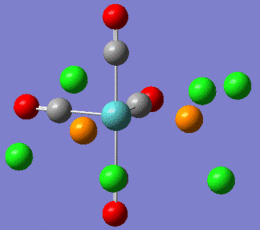
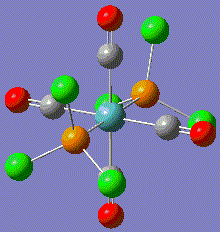
Using the Modify Dihedral tool in Gaussian, new geometries were set with one of the P-Cl bond from each group having a 0° angle to one of the Mo-C bonds. These new geometries are shown below:
 |
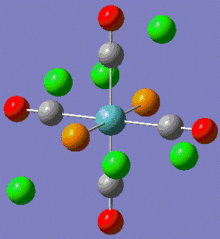 |
Fig. 10: Modified geometries of both complexes
Note that the returned geometries do not show bonds between the phosphorous and chlorines, this does not mean that there is not a bond between these atoms. A bond consist of favourable attraction between the electrons and nuclei of adjacent atoms, resulting in an overall lowering of energy. The convention of drawing a line between two atoms is simply to help us visualise the interactions between atoms. Gaussian draws a bonding line when the two atoms occupy positions within the sum of the van der Waals radii of the two atoms. However, elecronic effects from the rest of the molecule, for example back bonding to carbonyls, can weaken the Mo-P bond resulting in lengthening above the sum of radii. Gaussian will therefore not draw a bond, but this does not mean that one does not exist. Both modified isomers were resubmitted to the SCAN cluster, this time with the LANL2-DZ basis set. The DZ stands for double zeta and is a much better basis set and pseudo-potential. The additional keywords: "int=ultrafine scf=conver=9" were also added.
| cis-complex modified geometry .out file | trans-complex modified geometry .out file |
 |
 |
|
|
This shows that the orignal optimisation only achieved a false minimum on the energy surface. By selecting a geometry that is known to be closer to the real minimum, a more accurate result has been obtained.
A literature value[5] of 2.5106Å was found for the molecule Mo(CO)5(pfepp) where (pfepp) is (pentafluoroethyl)diphenylphosphine. Of course this is not the same molecule as analysed, but it shows that the bond lengths calcuated are realistic and match to 2 significant figures. The same journal referenced other similar molecules and bond lengths, Mo(CO)5(PMe)3 = 2.5082Å[6], Mo(CO)5(P(CH2CH2CN)3 = 2.506Å[7] again showing that the calculated figure is realistic.
Frequency analysis of Mo(CO)4(PCl3)2
The above optimised geometries were submitted to the SCAN cluster for a frequency analysis using the same method, basis set and additional keywords as above.
|
|
| cis-complex frequency analysis .out file | trans-complex frequency analysis .out file |
As, the energies have not changed significantly from the previous optimisation, it appears that there is not significant change in geometry. The low frequencies can be found in the results file of each isomer. The lowest were as follows:
Cis-Mo(CO)4(PCl3)2: -1.9481, -0.0006, -0.0001, 0.0004, 0.9491, 1.4458
Trans-Mo(CO)4(PCl3)2: -3.4399, -2.6744, 0.0004, 0.0008, 0.0009, 2.0765
The fact that these are all close to or just below zero means that the optimisation has in fact found a minima on the energy surfaces and not a maxima. If a more accurate method had been used for these calculations, the negative values would not be found. However, for the purpose of this study, the accuracy is sufficient to continue.
The lowest energy vibrations that could be visualised were as follows:
Cis-Mo(CO)4(PCl3)2: 10.8, 17.69, 41.99.
Trans-Mo(CO)4(PCl3)2: 0.77, 1.25, 37.81
All these vibrations consist of very subtle rocking of the whole molecule centred around the molybdenum. The fact that these have a very low wavenumber also means that they have a very low energy. At room temperature it can be assumed that these vibrational energy levels will be populuated and this is the molecular motion that can be expected.
Gaussview was used to visualise the higher energy calculated vibrations as well as the spectrum. A study[7] examining the stretching modes of many similar group 6 metal carbonyls was found and is compared to those calculated in the tables below.
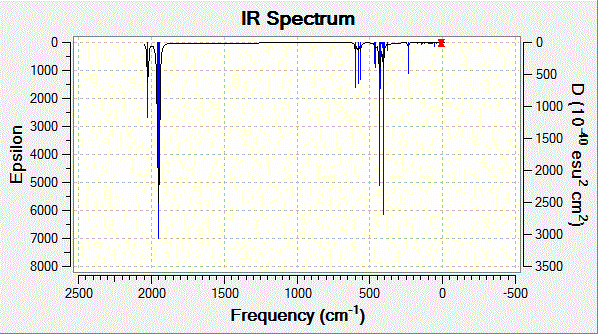
Fig. 11: Infrared spectrum of cis-complex
| Vibration | Frequency / cm-1 ± 10% | Intensity | Literature[7] / cm-1 |
 |
1945 | 762 | 1986 |
 |
1949 | 1500 | 1994 |
 |
1959 | 634 | 2004 |
 |
2024 | 597 | 2072 |
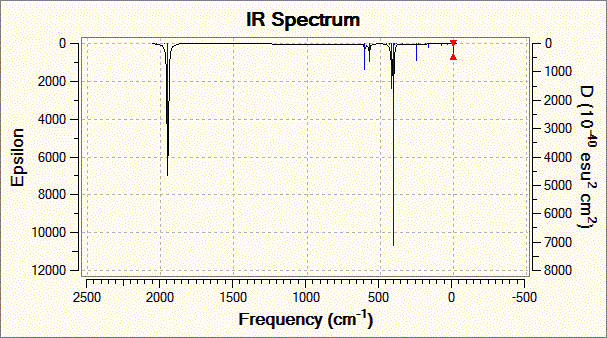
Fig. 12: Infrared spectrum of the trans complex
| Vibration | Frequency / cm-1 ± 10% | Intensity | Literature[7] / cm-1 |
 |
1950 | 1473 | 1896 |
 |
1951 | 1470 | 1896 |
 |
1977 | 1 | N/A |
 |
2031 | 4 | N/A |
The calculation for the trans-complex yielded four carbonyl stretching frequencies while the journal only gave two. This can be attributed to the fact that the last two frequencies involve highly symmetrical stretches and as such any dipole moment is cancelled out. This of course excludes them from IR spectroscopy and as such exhibit very low intensities. So low that they would probably not be visible on an analogue spectrum.
The calculated and literature frequencies are close and fit within the experimental error of 10%. This is a shortcoming with the method used. The metal-carbonyl bond is very complex and many different factors can affect the π-backbonding and therefore the strength of the bond. Looking at the molecule being studied, the electronegative trichloro phosphine groups will reduce the electron density on the metal available for back-donation to the carbonyl π*-orbital. This would increase the strength of the carbon-oxygen bond and will be most prominant for carbonyls trans to the phosphine. For this reason, Gaussian under-estimates the strength of the cis-complex carbonyl vibrations. The calculation also assumes harmonic oscillations when in reality the vibrations are anharmonic.
However, this done not mean that the analysis is without use. For example, the calculation predicts a degenerate pair of vibrations for the trans-complex, which is also found on the literature. Also, knowing the experimental error of 10% allows us to see whether the calculated frequencies are at least close to real values
Mini Project
Optimisation of each borazine derivative
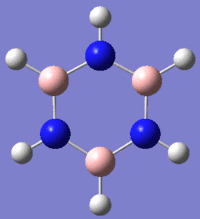
Each of the borazine structures was drawn using Gaussview. These structures were then submitted to Gaussian using the following method:
'# opt b3lyp/lanl2mb geom=connectivity
The fact that the structure is a ring means that the geometry is constrained and therefore are not a variety of geometries possible. I felt that this meant a low level calculation could be used. Also, Gaussian should be powerful and fast enough and using it would ease congestion on the SCAN cluster. The results are summarised below:
 |
 |
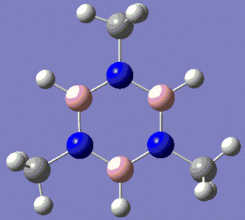 |
Fig. 13: Borazine and its derivatives, B-trichloro borazine and N-trimethyl borazine
|
|
|
| Borazine initial geometry optimisation .log file | B-trichloro substituted borazine initial geometry optimisation .log file | N-trimethyl substituted borazine initial geometry optimisation .log file |
| Measurement | Borazine | Lit. Borazine[8] | B-trichloro Substituted Borazine | Lit. B-trichloro Substituted Borazine[9] | N-trimethyl Substituted Borazine | Lit. N-trimethyl Substituted Borazine[10] |
| B-N bond length / Å | 1.433 ± 0.01 | 1.436 ± 0.004 | 1.428 ± 0.01 | 1.413 ± 0.010 | 1.434 and 1.442 | 1.44 |
| B-H/Cl bond length / Å | 1.171 ± 0.01 | 1.258 ± 0.020 | 1.907 ± 0.01 | 1.760 ± 0.015 | 1.171 ± 0.01 | 1.212 |
| N-H/C bond length / Å | 1.042 ± 0.01 | 1.050 ± 0.020 | 1.044 ± 0.01 | 0.84 | 1.508 ± 0.01 | 1.47 |
| N-B-N bond angle / ° | 116.475 ± 0.1 | 117.7 ± 2.0 | 119.875 ± 0.1 | 119 ± 1.0 | 118.008 ± 0.1 | - |
| B-N-B bond angle / ° | 123.525 ± 0.1 | 121.1 ± 2.0 | 120.125 ± 0.1 | 121 ± 1.0 | 121.992 ± 0.1 | - |
Firstly, literature values for the bond angles for the N-trimethyl borazine could not be found. However, the literature values for the other two molecules compare very well to those calculated and for most lengths and angles fit within the expected error.
It can be seen that there is slight widening of B-N-B bond angle above 120° while the N-B-N bond angle is slightly less than 120°. A likely explanation for this is that although the structure shows delocalisation, the electronegativity of nitrogen draws slightly more electron density towards it and so has close to a formal lone pair. As such this forces the bond angle to open slightly because of electron repulsion.
It can be seen that the chloro substituted compound has the shortest bond lengths, implying greater double bond character and hence delocalisation. The methyl substituted compound has the longest bonds and so is closer to single bond and localised lone pairs on the nitrogens.
Charge Distribution of Borazine Derivatives
The optimised geometries of each borazine derivative can have the charge distribution shown visually as well as numerically.
 |
 |
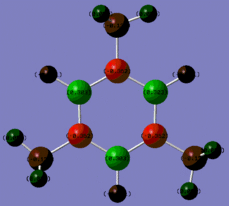 |
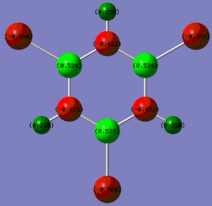
Fig. 14: Charge distribution of borazine and its derivatives
The colour scheme above runs from red (negative charge) to green (positive charge) with black being intermediate (neutral) The above images show that for borazine, there is the expected charge distribution with positivity on boron and negativity on nitrogen. This is due to the lone pair of electrons on nitrogen and the empty p-orbital on boron. The addition of the chlorine atoms to the molecule results in an increase of positivity on each boron. Chlorine is highly electronegative and so inductively withdraws electron density away from the ring towards the halogen. Methyl groups are known to be electron donating and so we would expect the nitrogens on the methyl substituted molecule to be more negative. However, this is not the case.
A similar calculation on benzene would show even electron density throughout the ring. As such, benzene is relatively inreactive as there is no build up of positive or negative charge for attack to take place. Conversely, borazine and its derivatives have highly localised charge, meaning incoming nucleophiles are directed strongly to the boron, while electrophiles will approach the nitrogen. As such it has been shown that the chloro-substituted borazine can be synthesised[11] simply by adding hydrogen chloride, while the methyl-substituted borazine can be achieved[12] with methyl bromide.
MO Analysis of Borazine Derivatives
Each optimised molecule was submitted to the SCAN cluster for MO analysis with the following heading:
'# b3lyp/lanl2mb pop=(nbo,full) geom=connectivity
Once complete, the returned formatted checkpoint file was opened and the molecular orbitals visualised.
 |
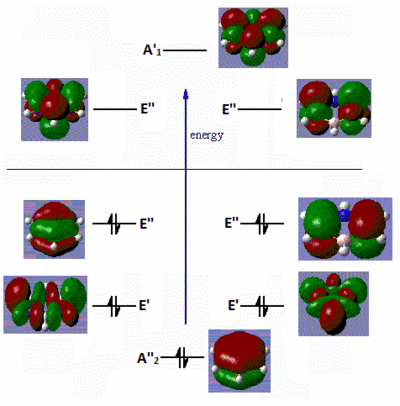 |
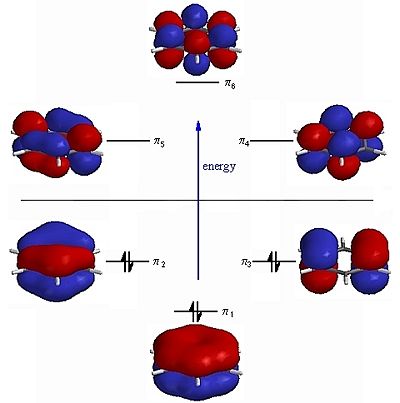
Fig. 15: Frontier molecular orbitals of benzene and borazine
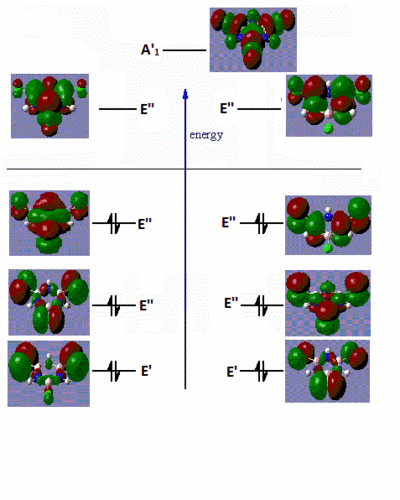
It can be seen that there are many similarities between the MOs of benzene and borazine. The six frontier molecular orbitals of benzene have almost exact matches in the borazine diagram. The only difference are the E' molecular orbitals. These degenerate orbitals are likely found at a lower energy in the benzene MO diagram. The large difference in the boron and nitrogen electronegativies would mean that the borazine frontier MO diagram would not fit the expected shape for an aromatic molecule. This rule only fits for aromatic rings of the same atom.
The MO diagrams of the substituted molecules were generated:
 |
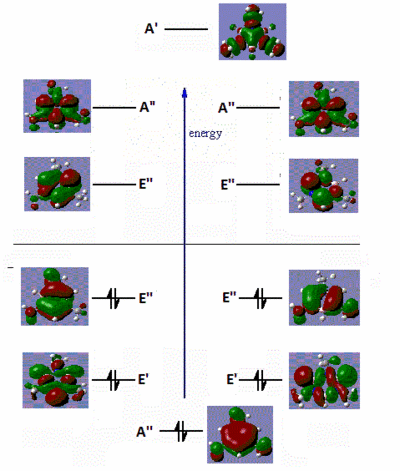 |
Fig. 16: Frontier molecular orbitals of B-trichloro borazine and N-trimethyl borazine
There are very little similarities between the substituted molecules and borazine or benzene. This shows how great the effect of electron-donating or withdrawing groups have on the electron distribution of a molecule. The B-trichloro borazine shows a lot of electron density focused on the chlorine atoms while the N-trimethyl borazine has most of the density on the ring. This fits with the expected trend of halo atoms being electron-withdrawing and alkyl groups being electron-donating. The orbitals on the benzene also show quite high symmetry. Conversely, the borazine and substituted derivatives show orbitals with high aysmmetry. The lobes are either strongly centred on certain atoms or extend far out of the ring. This is further evidence to borazines high reactivity relative to benzene. Areas of sterically inhindered high and low electron density mean that attacking species have no problem transferring electrons.
Vibrational Analysis of Borazine Derivatives
The optimised geometries for each molecule was submitted to the SCAN cluster with the following instructions:
'# freq b3lyp/lanl2mb geom=connectivity pop=(full,nbo)
The returned .out files did not match very closely to literature values. The molecules were therefore re-optimised and re-submitted for frequency analysis.
The most important vibrations are summarised below:
Borazine frequency analysis .out file

Fig. 17: Infrared spectrum of borazine
| Vibration | Calculated Frequency / cm-1 ± 10% | Intensity | Literature[14] Frequency / cm-1 |
| Degenerate asymmetric stretching of the nitrogen-hydrogen bonds | 3753 | 19.8 | 3460 |
| Degenerate asymmetric stretching of the boron-hydrogen bonds | 3056 | 33.6 | 2496 |
| Degenerate stretching of boron-nitrogen bonds with concerted hydrogen wagging | 1606 | 384.8 | 1425 |
| Concerted bending of boron-nitrogen bonds and all hydrogen atoms | 1010 | 311.3 | 745 |
B-trichloro borazine frequency analysis .out file
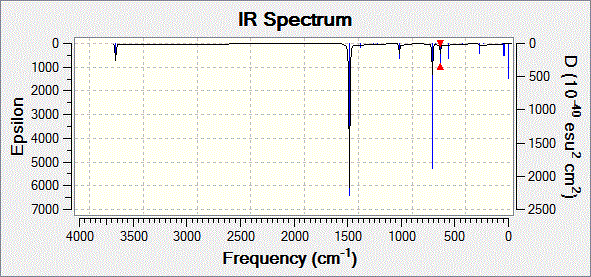
Fig. 18: Infrared spectrum of B-trichloro borazine
| Vibration | Calculated Frequency / cm-1 ± 10% | Intensity | Literature[15] Frequency / cm-1 |
| Single,double symmetric and double asymmetric stretching of nitrogen-hydrogen bonds | 3757, 3756 and 3755 | 83.1, 54.9 and 138.1 | 3450 to 3416 |
| Degenerate stretching of the boron-nitrogen bonds | 1582 | 908.0 | 1438 |
| Degenerate bending of two of the nitrogen-hydrogen bonds | 1116 | 63.0 | 1031 |
| Concerted bending of all boron-nitrogen bonds | 734 | 63.5 | 743 |
N-trimethyl borazine frequency analysis .out file
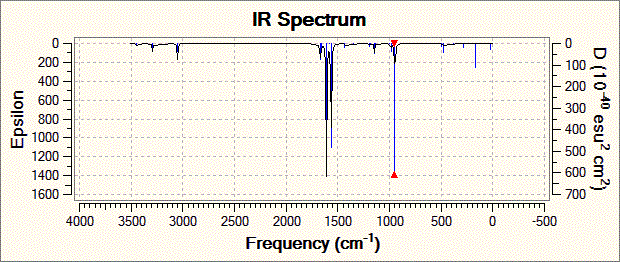
Fig. 19: Infrared spectrum of N-trimethyl borazine
| Vibration | Calculated Frequency / cm-1 ± 10% | Intensity | Literature[16] Frequency / cm-1 |
| Degenerate stretching of boron-hydrogen bonds | 3050 | 28.1 | 2943 |
| Stretching of boron-nitrogen bonds with concerted bending of carbon-hydrogen bonds | 1610 | 202.4 | 2484 |
| Degenerate concerted stretching of nitrogen-carbon bonds with bending of carbon-hydrogen bonds | 1564 | 189.1 | 1460 |
| Concerted bending of all boron-nitrogen bonds | 947 | 144.6 | 1064 |
The journals referenced above gave the characteristic frequencies for each molecule and the specific vibration that corresponds to it. This allowed the matching frequency to be found in the calculated results. The calculated and literature results do not match very closely. This could have been an issue with the geometry optimisation. However, the constrained structure of the ring means that it is not possible that there is an alternative geometry and therefore a false minimum on the potential energy surface. It is therefore more likely that it is a shortcoming with the computation. The borazine molecule contains a lone pair on each of the nitrogens and an empty p-orbital on the boron. This means that there are a lot of possible resonance forms spanning between lone pairs and empty p-orbitals, localised single and double bonds or complete delocalisation. Where on this scale the molecule lies in subject to many factors, not least of which, the substituents on the ring. The computation may not fully take into account all these factors and predict incorrect bond strengths, and thus vibrational frequency.
It should be noted that the calculation found many more vibrations than those shown above and in the spectra. Borazine and B-trichloro borazine had 30 vibrations each, while N-trimethyl borazine had 57. However, the high symmetry of the borazine ring means that many of the vibrations are symmetric and have zero net dipole. This of course means that they are not IR active.
Conclusion
The project has shown that computational methods can accurately predict the molecular orbitals and electron density of borazine and its derivatives. These results can be used to come to conclusions about the reactivity and aromaticity of the molecule. However, the complex electronic properties of borazine means that the calculation struggles with vibrational analysis. The calculated frequencies did not closely match literature values, even though they correspond to the same vibrations. However, knowing this limitation does not reduce the usefulness of computational analysis.
References
- ↑ Sang Soo Han, Jeung Ku Kang, and Hyuck Mo Lee, ChemJ. Chem. Phys., 2005, 123, pp. 123-131
- ↑ MO diagram provided by Patricia Hunt's 2nd year Tutorial problem
- ↑ Kentarou Kawaguchi, J. E. Butler, Chikashi Yamada, S. H. Bauer, Tatsuya Minowa, Hideto Kanamori, and Eizi Hirota, J. Chem. Phys., 1987, 87, p. 2438: DOI:10.1063/1.453135 10.1063/1.453135
- ↑ Julius Glaser and Georg Johansson, Acta Chemica Scandinavica A, 1982, 36a, p. 125-135: DOI:10.3891/acta.chem.scand.36a-0125
- ↑ Jason D. Palcica, Russell G. Baughmanb, Misha V. Golynskiyb, Sara B. Frawleya and R. Gregory Peters, J. Organomet. Chem., 2005, 690 (2), pp. 534-538: DOI:10.1016/j.jorganchem.2004.09.034
- ↑ M.S. Davies, M.J. Aroney, I.E. Buys, T.W. Hambley and J.L. Calvert, Inorg. Chem., 1995, 34, pp. 330-336
- ↑ 7.0 7.1 7.2 7.3 F.A. Cotton, D.J. Darensbourg and W.H. Ilsley, Inorg. Chem., 1981, 20, pp. 578-583 Cite error: Invalid
<ref>tag; name "Cotton" defined multiple times with different content - ↑ J.H. Callomon, E. Hirota, K. Kuchitsu, W.J. Lafferty, A.G. Maki and C.S. Pote, Structure data of free polyatomic molecules, 1976, Landolt-Bornstein, New Series, Group II, Vol. 7, 702
- ↑ D. L. Coulson, J. L. Hoard, J. Am. Chem. Soc, 1952, 74, pp. 1742–1750
- ↑ M.F. Guest, I.H. Hillier and I.C. Shenton, Tetrahedron, 1975, 31, pp. 1943-1947
- ↑ Stock, A.; Wiberg, E.; Martini, H., Ber., 1930, vol. 63, p. 2927-2937
- ↑ Neiss, M. A.; Porter, R. F., Journal of Physical Chemistry, 1972, vol. 76, p. 2630-2636
- ↑ Image courtesy of Dr. Ian Hunt, Department of Chemistry, University of Calgary
- ↑ Christophe Duriez, Eric Framery, Bérangère Tour, Pascaline Toutois, Philippe Miele, Michel Vaultier and Bernard Bonnetot, Journal of Organometallic Chemistry, 2002, 657, 1-2, pp. 107-114
- ↑ José Antiono Perdigon-Melon, Aline Auroux, David Cornu, Philippe Miele, Bérangère Toury and Bernard Bonnetot, Journal of Organometallic Chemistry, 2002, 657, 1-2, pp. 98-106
- ↑ Yasunori Yamamoto, Kazuo Miyamoto, Junko Umeda, Yasutaka Nakatani, Tetsuya Yamamoto and Norio Miyaura, Journal of Organometallic Chemistry, 2006, 691, 23, pp. 4909-4917


