Rep:Mod2:em207
Edward Moore Module 2
Part 1 BH3 and BCl3
BH3
Geometry optimisation
Firstly the calculation for optimisation of the structure of BH3 was set up as follows and run
# opt b3lyp/3-21g geom=connectivity

BH3 optimization

0 1
ie, an optimisation of the type FOPT and method b3lyp calculation was run with the 3-21g basis set
From the output file the new optimised geometry was opened and the bond length and bond angles abstracted along with the output file and summery.
| Parameter | BH3 |
|---|---|
| Bond length/angstroms | 1.18 |
| Bond angle/degrees | 120 |
| Energy/au | -26.46 a.u. |
| Gradient/a.u. | 0.00004507 |
| Dipole Moment/Debye | 0.00 |
| Point Group | D3H |
| Elapsed calculation time\s | 14.0 |
Molecular orbital’s and NBO
In this section the molecular orbital’s of the BH3 molecule were calculated through Gaussian using the following input code.
# b3lyp/3-21g pop=(nbo,full) geom=connectivity

BH3 MO analysis

0
| The output molecular orbital’s were then used to compose a Molecular orbital diagram (see below). The orbitals were studied quantitatively using NBO analysis from the output log file. This gave the charge distribution on the molecule (0.018 on H and -0.053 on B). The type of bonding in the molecule of BH3 was then investigated, from the above log file. From this it could be said that the Hydrogen atoms were bonding through the 1s atomic orbital’s with the Boron Sp2 hybrid (s=33.33% and p=66.66%) to from a bond which has 44.49% boron character and 55.51% hydrogen character. |
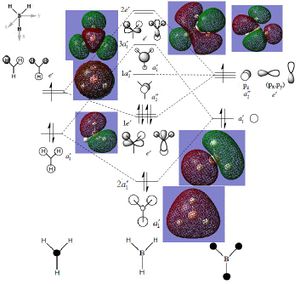 |
| It can be seen from the above diagram that the MO approach gives a better description of the delocalised electrons that the LCAO, however it can also be seen from the LCAO approach gives a better description of the contribution atomic orbital’s to the molecular orbital, however the MO approach gives a quantitative analysis of this through the NBO method which can be abstracted from the log file. It can therefore be said that both methods have their merit but the MO approach is generally more accurate and better for analysis. |
Vibration analysis
The following input into Gaussian was made
# freq b3lyp/3-21g geom=connectivity pop=(full,nbo)

BH3 frequency analysis

0 1
This yielded the following output log file from which it can be seen that the energy matches exactly the one obtained in the initial geometry optimisation. Therefore the results obtained are valid. The vibrations obtained are shown below:
| Vibration number | Vibration mode | Frequency cm-1 | IR intensity | Symmetry D2H point group |
|---|---|---|---|---|
| 1 | 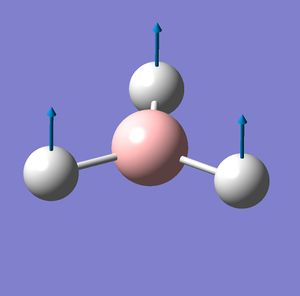 |
1146 | 93 | E' |
| 2 | 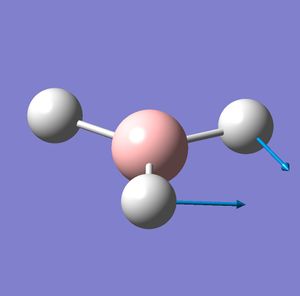 |
1205 | 12 | E |
| 3 | 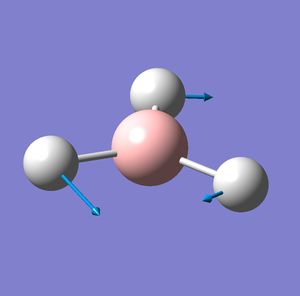 |
1205 | 12 | E' |
| 4 | 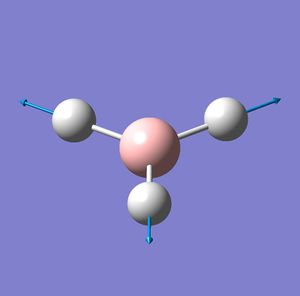 |
2592 | 0 | A1' |
| 5 | 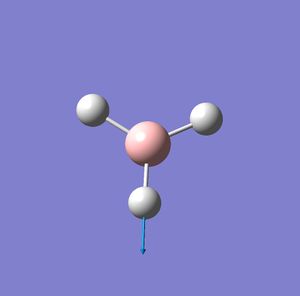 |
2730 | 104 | E' |
| 6 | 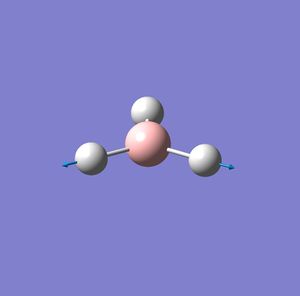 |
2730 | 104 | E' |
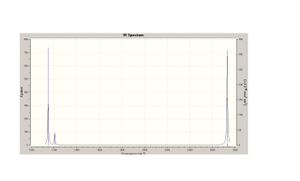
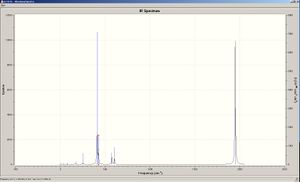
The vibration spectra was then obtain via Gaussian and is below. 4 do not show up on these spectra as there is no change in dipole moment therefore making it IR inactive. With regard to the degenerate vibrations these are not observed on the IR spectra as they are have the same values and are overlapping on the graph.
BCl3
These optimisations were also run in Gaussian using the code bellow ie, an optimisation of the type FOPT and method b3lyp calculation was run with a different basis set LANL2MB, this was used as it can take into consideration the extra number of electrons associated with the Chlorine atoms, returning the following log file
# opt b3lyp/lanl2mb geom=connectivity

BCl3 optimization

0 1
The same method must be used for both calculations within the B-Cl model as one will create in effect an exited state form if the basis set is changed half way through and therefore the calculation will fail they will also work to differing degrees of accuracy and therefore making comparisons between steps invalid. Frequency analysis must be carried out so that the molecule is at the right absolute geometry so that further calculations are correct, ie so that the molecule is at a minimum energy and not at a transition state if this is true the vibration values are returned are positive, this was done using the code below.
# freq b3lyp/lanl2mb geom=connectivity

BCl3 frequency analysis

0 1
From the results it was seen that the vibration values returned were indeed positive and therefore it could be said that the geometry obtained was indeed the structure. The vibrations returned were the type, in mode and symmetry as the BH3 214, 214, 377, 417, 939 and 939 cm-1 (see the log file for further information).
| Properties of BCl3 | Numerical Value calculated | Numerical value literature[1] |
|---|---|---|
| Bond length/Angstroms | 1.87 | 1.75 |
| Bond Angle/degrees | 120.0 | 120.0 |
It can be said also that gauss view does not input some bonds as the 'bonds' in gauss view are determined by preset length parameters for two given atom pairs and not by quantum or other such values, which is why B-H or B-Cl may not visually be represented by a bond. A bond is an attractive interaction between two nuclei which may be either covalent or ionic in nature which will be permanent but which strength will remain constant but the length may vary around an equilibrium or average value due to changing conditions.
The symmetry of the ground state may be said to be D3H as can be seen from the summery file. From the log file it can be said that Gaussian will assign the symmetry labels after probing the geometric configuration.
The elapsed time for the calculations was 9.0 and 16.0s for the optimisation and frequency calculations respectively, this was completely acceptable time for the calculations to run within withthe given time constraints.
Part 2 Cis and Trans MO(CO)4L2
Geometry optimisations
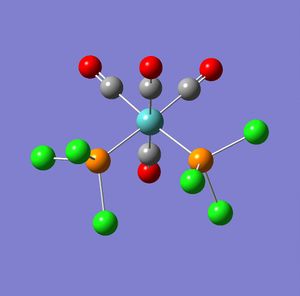
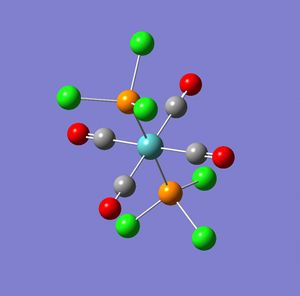
In this section firstly the structures were optimised in Gaussian (using the input code as below) to give the following output logs for the cis and trans isomers.
# opt=loose b3lyp/lanl2mb geom=connectivity

(cis/trans) MO(CO)4L2 1st op

0 1
Next the molecules were manipulated as in suggested in the script the result of the above calculations were submitted to scan by using the following code:
# opt b3lyp/lanl2dz geom=connectivity int=ultrafine scf=conver=9

(cis/trans) MO(CO)4L2 2nd op

0 1
The results were obtained and published as DOI's for both the cis and the trans. From the summery of the output text file the following information was obtained:
From the above information it can be seen that the cis isomer has a more negative energy, -623.577 compared with -623.5776, implying a greater stability of the cis over trans. However this is a very small difference in energy and stability. However it may be seen that there is a large difference in dipole which will favour the trans over the cis isomer. This is further enforced by the fact that when considering the larger phenyl ligands compared with the smaller chloride ligands, there will a greater influence of sterics favouring the trans over the cis as this will minimise sterics. Therefore it can be concluded that although the energy of the cis isomer is less than that of the trans isomer the trans isomer will be more stable due to the reduced dipole and sterics and is therefore likely to be the thermodynamic product. This may be seen though the literature[2] in which the trans is said to be the more thermodynamically stable product when compared to the cis isomer, from further literature[3] it can also be said that the cis is the kinetic product (as it forms faster than the trans isomer).
Frequency analysis
Next the fully optimised molecule was input into Gaussian to calculate the vibrational frequencies and modes for the cis and trans isomers. This was done using the code described below.
# freq b3lyp/lanl2dz geom=connectivity int=ultrafine scf=conver=9

(cis/trans) MO(CO)4L2 frequencies

0 1
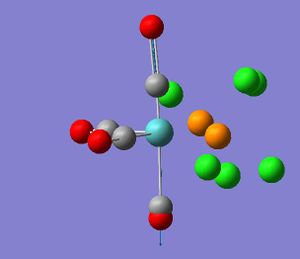
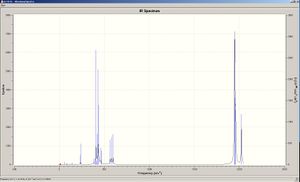
This gave the following results for the cis and trans, from which the following information was collated as bellow. It can also be said that from the data there are several low frequency values but at room temperature these will not need a great amount of energy and can therefore be said to be ground state vibrations.
| Diagram | Computed Frequency | Literature Frequency | Point group symmetry | IR Intensity |
|---|---|---|---|---|
 |
1945 | 1986 | B2 | 763 |
 |
1949 | 1994 | B1 | 1499 |
 |
1958 | 2004 | A12 | 633 |
 |
2023 | 2072 | A11 | 598 |
 |
| Picture | Computed Frequency | Literature Frequency | Point group symetry | IR Intensity |
|---|---|---|---|---|
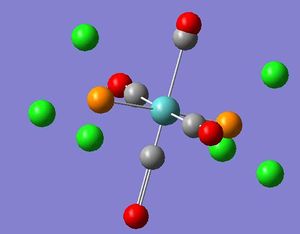 |
Eu | 1950 | 1896 | 1475 |
 |
EU | 1951 | 1896 | 1467 |
 |
B1g | 1977 | - | 1 |
 |
A1g | 2031 | - | 4 |
 |
From the above results it can be said there is a good corollary between the calculated and literature values and the computed values. However it can be seen that there are no literature values for the B1g of trans and A1g. This will be because the intensity of these modes of vibration are too low to be detected. This therefore implies there is a greater accuracy of computed values than the literature values. It can also be seen that the values of the cis vibrations are generally higher in energy and, therefore frequency than the corresponding cis vibrations, this is because the energy of the trans complex is more stable and therefore requires more energy for a given vibration mode.
Mini project Fuels for the future and Ammonia borane
With the constant pressure for a shift toward 'green energy' the forerunner for taking over form the internal combustion engine is the hydrogen fuel cell. However the main problem with the use of the fuel cell is storage of the hydrogen currently, as at room temperature it is a gas and therefore does not endear itself towards storage. However one suggestion is to use ammonia borane (H3BNH3) due to its high hydrogen content and it is a stable solid at room temperature. Large scale synthesis of ammonia borane are available[4]. In this mini project the structure will be investigated and proved.
Optimisations
There are two main structural isomers of ammonia borane the staggered and eclipsed, so the structure of these were investigated. This was done through first optimising the structures using the a low basis set (3-21G) for both the staggered and eclipsed, checking that the returned structure was a minimum through frequency analysis for both the staggered and eclipsed. Next the staggered and eclipsed were then subjected to further optimisation at a higher basis set (6-311G)with a frequency analysis again conducted for both staggered and eclipsed. Finally an NBO analysis for both staggered and eclipsed was conducted to allow the bonding present to be probed, this same process was also conducted for ethane.
| | | | |
Following the above calculations it can be seen from the final optimisation summaries of the staggered and eclipsed that the energy of the staggered is equal to that of the eclipsed to the given accuracy (-83.25 to 2 decimal places). However it can be predicted that if the calculation were able to go to a high enough degree of accuracy that the staggered would be more stable than the eclipsed this will be because of a greater sterics clash, due to an increase in the Van Der Waal interactions between the syn- periplanar hydrogen’s, therefore making the eclipsed conformer less stable than the staggered rotomer. It can also be argued that as the dipole is less in the staggered compared with the eclipsed structure that the staggered will again be preferred to the eclipsed molecule. It can also be seen from the ethane calculations that the energies’ are again very similar in value the staggered being -79.86 au and the eclipsed being -79.85 au. It can therefore be said that the reason that the ammonia borane is more stable is due to the fact that resonance stabilisation structure of the B-N bond exist (ie as formal charges with a sigma bond or as a dative bond), this stabilises the overall structure therefore making the ammonia borane more stable than ethane. It can also be seen from the MO's computed bellow and the NBO analysis here that there is a greater.
Bonding present in staggered Ammonia Borane vs Ethane
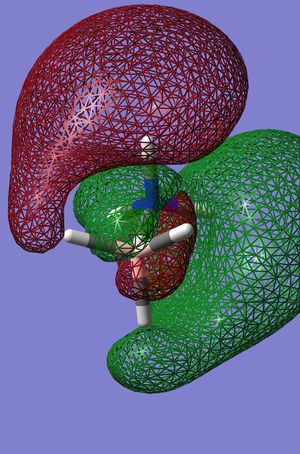
The Molecular orbital’s were then calculated from the final optimised structure, bellow are shown Homo-1 to Lumo+2 for both the ammonia borane and ethane in the more stable and therefore more common staggered form.
| Compound | HOMO-1 | HOMO | LUMO | LUMO+1 | LUMO+2 | Charge distribution |
|---|---|---|---|---|---|---|
| Staggered ethane |  |
 |
 |
 |
 |
 |
| Staggered ammonia borane |  |
 |
 |
 |
 |
 |
NBO analysis NBO N-B bond Staggered Ammonia Borane
(1.99174) BD ( 1) B   1 - N   2
                ( 18.36%)   0.4284* B   1 s( 16.16%)p 5.18( 83.69%)d 0.01(  0.15%)
                ( 81.64%)   0.9036* N   2 s( 36.35%)p 1.75( 63.65%)d 0.00(  0.00%)
C-C bond Staggered ethane
(1.99453) BD ( 1) C   1 - C   2
                ( 50.00%)   0.7071* C   1 s( 30.17%)p 2.31( 69.79%)d 0.00(  0.04%)
                ( 50.00%)   0.7071* C   2 s( 30.17%)p 2.31( 69.79%)d 0.00(  0.04%)
From the above MO's and charge distribution it can be seen that there is a greater charge density on the Nitrogen than the Carbon, and there is a high degree of polarisation with regard to the N-B bond as can be seen from the MO. It can also be seen that the ethane is much more symmetrical in charge distribution in comparison to the Ammonia Borane as would be expected. This can also be seen from the NBO analysis above as the nitrogen character of the N-B bond is considerably larger and therefore implying that there is a greater electron density on the nitrogen than on the boron, the carbon carbon sigma bond on the other hand can be seen to be composed of 50% of either carbon as would be expected. The Ammonia Borane it can also be said has a differing in acidity of protons, the protons surrounding the nitrogen are much more acidic in value. The impact that this will have on the overall structure is that as there will be a greater dipole dipole interaction Ammonia Borane than ethane, therefore increasing the melting point, this will be further strengthened by a partial donation of electron density from the nitrogen into neighbouring empty p orbital’s of adjacent Boron’s again increasing attractions between molecules and therefore meaning the melting point of Ammonia Borane will be higher than ethane. There will also be formation di hydrogen bonds between N-H----H-B [5]. The formation of such bonds allows the formation of a lattice again further increasing the melting point of ammonia borane compared with ethane.
Production
One proposed method of production of ammonia-borane is through the reaction of NH4Cl and NaBH4 to form NH4BH4 and NaCl which then decomposes to NH3BH3 with the release of H2.
ie NH4Cl + NaBH4 --> NH4BH4 + NaCl --> NH3BH3
Therefore for the calculation the reaction may be considered to be the following:- NH4Cl + NaBH4 --> NH3BH3 + NaCl + H2
It can be said that this reaction may be a successful one and could be used as the ΔEreaction = (reactants)-(products) = (-1351728-1351729)-(-220228-2483117) = -112 kJmol-1 This negative overall energy implies that the products are at a lower energy than the reactants and therefore that the products are more thermodynamically stable than the reactions and therefore that the reaction is spontaneous. It can be said therefoe that this can be considered a usefull process as it will allow a viable production of ammonia boride which as previously mentioned is one of the main contenders to be used as a method of hydrogen fuel cell sotrage.
Literature
- ↑ D. R. Stull and H. Prophet, JANAF Thermochemical Tables, 2nd ed. NSRDS-NBS, June 19711, Vol. 37.
- ↑ D. J. Darensbourg, Inorg. Chem., 1979, 18, 14 - 17
- ↑ D. J. Darensbourg and R. L. Kump, Inorg. Chem., 1978, 17, 2680 - 2682
- ↑ S. G. Shore, K. W. Boddeker Inorg. Chem., 1964, 3 (6), pp 914–915
- ↑ Wim T. Klooster, Thomas F. Koetzle, Per E. M. Siegbahn, Thomas B. Richardson, and Robert H. Crabtree J. Am. Chem. Soc., 1999, 121 (27), pp 6337–6343

