Rep:Mod2:csy07
Notes on accuracy and reported data
With the methods employed in this module:
- Stated energies include an error of ±10 kJ/mol i.e.: ±0.004 Hartrees (to 1 s.f.). Consequently, all energies in atomic units are recorded to 3 decimal places.
- Dipole moments are accurate to ~ 2 decimal places i.e.: ±0.01 D.
- Frequencies in wavenumbers include a systematic error of 10%[1]. By convention these are reported with no decimal places, and no scaling factors are employed in this report.
- Infra-red intensities are likewise reported with no decimal places by convention, though the accuracy is much less than this.
- Bond distances are accurate to ~±0.01 Å and are consequently recorded to 2 decimal places.
- Bond angles are accurate to ~±0.1° and so are reported to 1 decimal place.
- All stated errors are implicitly assumed hereon.
Studies on BH3 and BCl3 systems
BH3
Optimisation
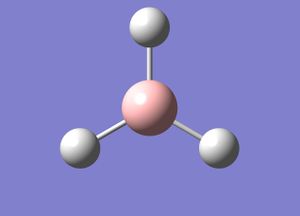
GV 5.0 was used to create the input file. The BH3 molecule was constructed using the controls palette, B-H bond lengths were set to 1.5 Å, and all chemical symbols were displayed.
The saved input file was opened in WordPad and the route section specified as per below (route section, title section and molecular specification displayed). A general discussion on methods and basis sets can be found later in section 2.1.
%chk=F:\y3 comp labs\mod2\BH3BCl3\csy07BH3optfreq.chk
# b3lyp/3-21g geom=connectivity opt freq

BH3 opt freq

0 1
 B                  0.83333330    0.27272727    0.00000000
 H                  2.33333330    0.27272727    0.00000000
 H                  0.08333329    1.57176537    0.00000000
 H                  0.08333329   -1.02631084    0.00000000

 1 2 1.0 3 1.0 4 1.0
 2
 3
 4
At this point it is worth mentioning that only 2 jobs were run on the BH3 molecule, namely a joint opt+freq job then a pop=(nbo,full) job. It is possible to condense all jobs to be run within these to save computational time and expense. Additionally, by running a joint opt+freq job at this stage the geometry of the molecule can be checked as a minimum on the Potential Energy Surface (PES) immediately (by ensuring no negative second derivatives as indicated by the printed frequencies), prior to any discussion. Numerical errors which creep into the calculations from submitting multiple jobs are likewise kept to a minimum.
The job was run using Gaussian 09w since computational expense is relatively low (considering the size of the molecule and the method/basis set combination) and therefore fits the laptop’s CPU specifications. On successful completion, the convergence of forces and displacements was immediately checked and found to be acceptable (values within stated thresholds):
         Item               Value     Threshold  Converged?
 Maximum Force            0.000413     0.000450     YES
 RMS     Force            0.000271     0.000300     YES
 Maximum Displacement     0.001605     0.001800     YES
 RMS     Displacement     0.001051     0.001200     YES
 Predicted change in Energy=-9.956490D-07
 Optimization completed.
    -- Stationary point found.
                           ----------------------------
                           !   Optimized Parameters   !
                           ! (Angstroms and Degrees)  !
 --------------------------                            --------------------------
 ! Name  Definition              Value          Derivative Info.                !
 --------------------------------------------------------------------------------
 ! R1    R(1,2)                  1.1935         -DE/DX =    0.0004              !
 ! R2    R(1,3)                  1.1935         -DE/DX =    0.0004              !
 ! R3    R(1,4)                  1.1935         -DE/DX =    0.0004              !
 ! A1    A(2,1,3)              120.0            -DE/DX =    0.0                 !
 ! A2    A(2,1,4)              120.0            -DE/DX =    0.0                 !
 ! A3    A(3,1,4)              120.0            -DE/DX =    0.0                 !
 ! D1    D(2,1,4,3)            180.0            -DE/DX =    0.0                 !
 --------------------------------------------------------------------------------
 GradGradGradGradGradGradGradGradGradGradGradGradGradGradGradGradGradGrad
- Output: Media:csy07BH3optfreq.log
- Results summary: Media:csy07BH3optfreq.txt
No negative frequencies were found and so the optimised geometry is a minimum at the B3LYP/3-21G level (more on a vibrational analysis to follow in section 1.1.2, and method/basis set theory to be briefly discussed in section 2.1).
The computational expense of running this file was indeed low with a job cpu time of 11.0 seconds. Most of the information required for the purposes of others performing the calculation can be found in the results summary (e.g.: energy = -26.383 a.u., stated just for a check).
The optimised geometry identifies a B-H bond length of 1.19 Å, an H-B-H angle of 120° (both found using the controls palette on GV 5.0), and a dipole moment of 0.00 D (from the results summary). These results compare very closely to literature values[2]. which give a B-H bond length also of 1.19 Å (for the terminal 2c-2e B-H bonds in diborane since BH3 dimerises, although in diborane the B-H bonds are sp3 hybridised rather than sp2 hybridised). An H-B-H bond angle of 120° and a dipole moment of 0.00 D matches the geometric properties associated with the point group of BH3, which is found to be D3h (from the results summary).
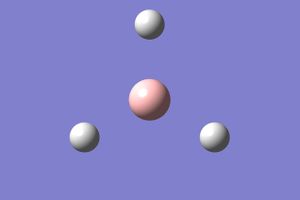
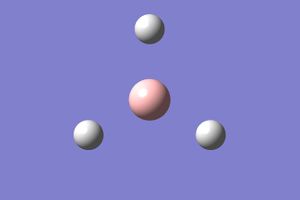
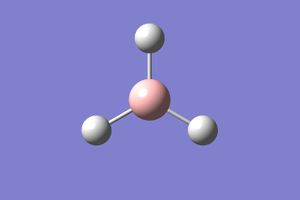
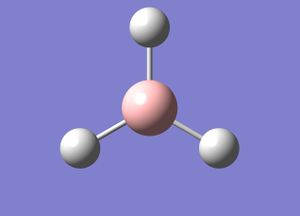
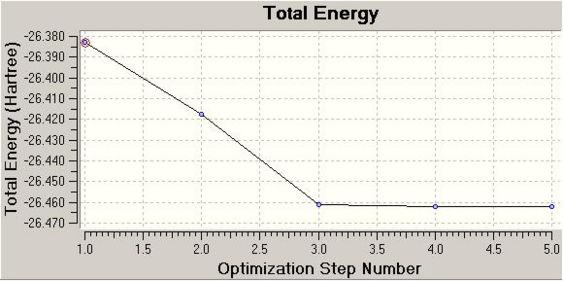
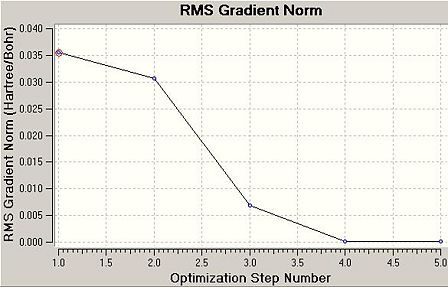
The .log file details that 5 iterations from the input geometry were required before forces and displacements converged successfully. The intermediate geometries can be displayed on GV 5.0. These are shown below as .jpeg's and .jmol's. Two optimisation plots (Total Energy (Hartree) vs. Optimisation Step Number and RMS Gradient Norm (Hartree/Bohr) vs. Optimisation Step Number) are displayed below, each point respective to the geometry in the table.
| Table 1.1.1 – Intermediate Geometries of BH3 Optimisation | ||||
|---|---|---|---|---|
| 1 (initial geometry from input file) | 2 | 3 | 4 | 5 (final geometry) |
 |
 |
 |
 |
 |
 |
 |
It is worth mentioning that for geometries 1 and 2, no bonds can be seen. This is because GV 5.0 has an internal list of bond lengths, and when bonds are outside of the list’s range they are not displayed (they still exist!).
The true definition of a chemical bond is at the bottom of a deep and complex area (see Linus Pauling’s seminal work The Nature of the Chemical Bond (1939) for an in-depth discussion. Pauling won the 1954 Nobel Prize for much of this publication's research). For the purpose of this module, a chemical bond is a region of electron density between two molecular fragments, formed via the overlap of fragment orbitals. The strength of the bond (measured by the degree of splitting energy i.e.: energy of stabilisation + energy of destabilisation) is dependent upon 3 criteria:
- 1. The energy difference between the fragment orbitals
- 2. The orbital coupling
- 3. The extent of orbital overlap
In qualitative terms, the greatest splitting energy occurs when fragment orbitals are degenerate in energy (covalent bonding). As fragment orbitals shift apart in energy the splitting energy decreases. Eventually a point is reached when the difference in fragment orbital energies is large enough that the fragment orbitals don’t interact (ionic bonding). Accordingly there is a continuum between “fully covalent” and “fully ionic” bonds. Considering orbital overlap, the larger the orbital overlap the greater the splitting energy. Orbital overlap is dependent on the location (closer=larger), orientation (more directed=larger), density (more dense=larger) and diffusivity (more diffuse=smaller) of the fragment orbitals.
The RMS gradient norm for the final geometry is 0.000. The RMS gradient norm is below 0.001, therefore this is classified as a stationary point on the PES.
To explain what this means conceptually, consider the PES. Under the Born-Oppenheimer approximation, this is a surface of the potential energy of the electrons vs. nuclear position (fixed). The optimisation begins at a certain point on the PES (i.e.: the starting geometry) and the potential energy is calculated at that point. The nuclear position is changed slightly and potential energy is calculated for another, nearby point. If the second energy is lower than the first, then we “move” in that direction and begin the cycle again. The whole sequence of iterative processes can be related to placing a ball at some point on a hilly surface: the ball systematically moves in small steps from one point to the next to lower its potential energy until it reaches a minimum. On a PES, this may be the global minimum (i.e.: the lowest point on the entire surface) or a local minimum depending on where you start on the PES (i.e.: the starting geometry).
Mathematically the stationary point that the geometry ends up in fulfils the criteria RMS (–dE(R)/dR) norm < 0.001 (as stipulated by Gaussview 09w). In other words, this is a point where the PES is (effectively) flat (either a minimum or a maximum). Force = –dE(R)/dR, so a stationary point is also where there are (effectively) no net forces acting to change the geometry at that location.
Vibrational Analysis
The frequency calculation was aggregated with the optimisation calculation for reasons which have already been discussed. Scrolling down through the output file, the following section is found:
Full mass-weighted force constant matrix:
 Low frequencies --- -66.7784  -66.3762  -66.3759   -0.0018    0.0032    0.2122
 Low frequencies --- 1144.1475 1203.6410 1203.6420
 Diagonal vibrational polarizability:
        0.6013534       0.6012834       1.9090994
 Harmonic frequencies (cm**-1), IR intensities (KM/Mole), Raman scattering
 activities (A**4/AMU), depolarization ratios for plane and unpolarized
 incident light, reduced masses (AMU), force constants (mDyne/A),
 and normal coordinates:
                     1                      2                      3
                    A2"                    E'                     E'
 Frequencies --  1144.1475              1203.6410              1203.6420
 Red. masses --     1.2531                 1.1085                 1.1085
 Frc consts  --     0.9665                 0.9462                 0.9462
 IR Inten    --    92.8666                12.3148                12.3173
  Atom  AN      X      Y      Z        X      Y      Z        X      Y      Z
     1   5     0.00   0.00   0.16     0.00   0.10   0.00    -0.10   0.00   0.00
     2   1     0.00   0.00  -0.57     0.00   0.08   0.00     0.81   0.00   0.00
     3   1     0.00   0.00  -0.57    -0.38  -0.59   0.00     0.14   0.38   0.00
     4   1     0.00   0.00  -0.57     0.38  -0.59   0.00     0.14  -0.38   0.00
                     4                      5                      6
                    A1'                    E'                     E'
 Frequencies --  2598.4275              2737.4392              2737.4399
 Red. masses --     1.0078                 1.1260                 1.1260
 Frc consts  --     4.0092                 4.9714                 4.9714
 IR Inten    --     0.0000               103.7400               103.7332
  Atom  AN      X      Y      Z        X      Y      Z        X      Y      Z
     1   5     0.00   0.00   0.00     0.11   0.00   0.00     0.00   0.11   0.00
     2   1     0.00   0.58   0.00     0.02   0.00   0.00     0.00  -0.81   0.00
     3   1     0.50  -0.29   0.00    -0.60   0.36   0.00     0.36  -0.19   0.00
     4   1    -0.50  -0.29   0.00    -0.60  -0.36   0.00    -0.36  -0.19   0.00
By way of explanation, there are 3N-6 vibrations associated with a non-linear molecule. The “-6” frequencies are those listed as “Low frequencies”; these are attributable to the translational motion of the molecule and get closer to zero as the level of method increases (in this case the method used is low level). For BH3 then, there are 3x4-6=6 vibrations. The symmetry labels of each of these are printed in the output file. Importantly, none of these are negative, which indicates that the optimised geometry is a minimum.
The frequency analysis essentially takes the second derivative of the PES surface i.e.: -d2E(R)/dR2. Given that the optimised geometry is at a stationary point, the frequency analysis determines whether this is a minimum or a maximum. In the case of BH3, there are too many nuclear position variables to imagine the PES in 3D space (as is often the case). But fixing all but 2 nuclear position variables allows us to imagine the PES in 3D space. You can imagine that although we might find a minimum on this particular surface (i.e.: Gaussian 09w may "think" it has found a stationary point during an optimisation), when we start to allow those variables that we had fixed to change again that point may no longer be a minimum. The frequency calculation performed above shows that in this case, the optimised geometry is at a minimum point on the PES on consideration of all variables.
To animate the vibrations, the .chk file was opened in GV 5.0. The table below summarises these.
| Table 1.1.2 - Vibrations of Optimised BH3 | ||||||||
|---|---|---|---|---|---|---|---|---|
| Number | Form of Vibration | Description of Vibration | Frequency / cm-1 | Intensity | Symmetry (D3h point group) | |||
| 1 |
|
"Umbrella" motion: H atoms move orthogonal to the σh plane in concerted, in-phase motion. Small displacement of B atom. | 1144 | 93 | A2'' | |||
| 2 |
|
"Scissor" motion: H atoms move in the σh plane in concerted, in-phase motion. Small displacement of B atom. | 1204 | 12 | E' | |||
| 3 |
|
"Scissor" motion of 2 H atoms in concerted, in-phase motion. "Rocking" motion of the third H. All H atoms move in the σh plane. Small displacement of B atom. | 1204 | 12 | E' | |||
| 4 |
|
H atoms move in the σh plane in concerted, in-phase motion, along the B-H bond direction. B atom stationary. | 2598 | 0 | A1' | |||
| 5 |
|
Asymmetric stretching of 2 H atoms in the σh plane along the B-H bond direction. Small displacement of B atom. | 2737 | 104 | E' | |||
| 6 |
|
Symmetric stretching of 2 H atoms along the B-H bond direction, both assymetric with the stretching of the third H along the B-H bond direction, all movement in the σh plane. Small displacement of B atom. | 2737 | 104 | E' | |||
The IR spectrum as calculated in the .chk file is displayed below:
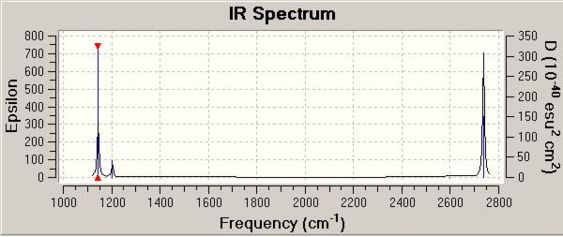 |
Although there are six vibrations, only three appear on the IR spectrum. This is because modes 2, 3, and 4 are IR inactive: these vibrations do not involve a (significant) change in dipole moment as indicated by summation of the time-dependent vectors (intensities: 12, 12, 0 respectively).
MO Discussion
The .chk file from the joint opt+freq job was opened with GV 5.0 and saved as a .gjf. This input file was opened in WordPad and the route section specified as per below (entire input file displayed).
 %chk=F:\y3 comp labs\mod2\BH3BCl3\csy07BH3MO.chk
# b3lyp/3-21g pop=(nbo,full) geom=connectivity

BH3 MO

0 1
 B                  0.00000000    0.00000000    0.00000000
 H                  0.00000000    1.19348969    0.00000000
 H                  1.03359239   -0.59674485    0.00000000
 H                 -1.03359239   -0.59674485    0.00000000

 1 2 1.0 3 1.0 4 1.0
 2
 3
 4
As before, the computational expense of this job was sufficiently cheap to run on the laptop’s CPU. The job took 5.0 seconds to finish.
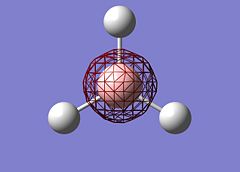
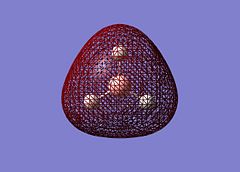
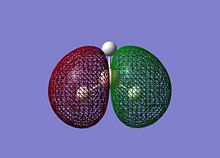
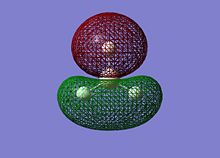
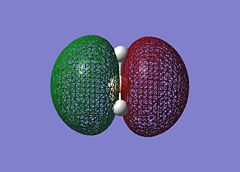
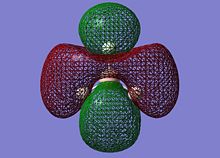
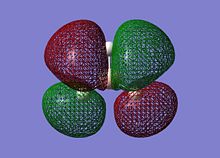
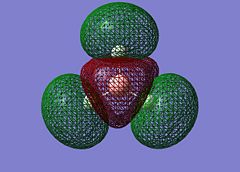
On successful completion of the job, the .chk file was opened in GV 5.0 and the first 8 molecular orbitals were visualised (“mesh” selected from surface tab after Ctrl+D):

The MOs calculated at the B3LYP/3-21G level compare very well with those using the LCAO approach: it can be inferred that qualitative MO theory is sufficient for “back-of-the-envelope” purposes and more. The computed MOs give more detail and substance to blending and shapes of FOs: this is particularly the case for the two degenerate LUMO+1 levels (2e’). For both of these cartoons, the computed MOs show that the repulsion between out-of-phase lobes leads to deformations (especially for the MO on the right, where the 2py component has bent away from the e’ components in the xy plane). Unoccupied MOs are often more diffuse than occupied MOs.
NBO Analysis
On opening the .log file with GV 5.0 and selecting “Results -> Charge Distribution -> NBO”, the “atomic charges” of BH3 were displayed:

- NBO section of output file: Media:csy07BH3NBO.txt
From Fig 1.1.4 the charges are 0.332 for B and -0.111 for H, indicating that the B atom is δ+ while the H atoms are δ- (as may be expected from the elements’ relative Pauling electronegativities: 2.04 (B) vs. 2.2 (H) [3]).
The NBO analysis gives more powerful information rather than just charge distribution. It also gives the contribution from each atom in forming bonds. The more detailed information must be read directly from the .log file: the relevant section is posted opposite (Media:csy07BH3NBO.txt).
The part beginning “Bond orbital/ Coefficients/ Hybrids” identifies that for each B-H bond, 44.48% electron density is from the B atom while the remaining 55.52% electron density comes from the H atom. In addition, each B-H bond is composed of 33.33% B sAO and 66.66% B pAO. This indicates that each B-H bond is sp2 hybridised on the part of B (interacts with the 1sAO of the H atom).
Orbital 4 is the core 1sAO of the B atom (100% contribution from B 1sAO).
To identify the vacant p orbital on B, the part headed “Natural Bond Orbitals (Summary)” is studied. From this, orbital 8 is the only unoccupied orbital with negative energy (-0.045), which shows that this is the orbital responsible for the Lewis acid behaviour of BH3.
Under the “Second Order Perturbation Theory Analysis of Fock Matrix in NBO Basis” part, there are evidently no second order interactions in the case of BH3. Energies of the E(2) column are much smaller than 20 kcal/mol (i.e.:=1.51 kcal/mol).
BCl3
GV 5.0 was used to create the molecule: first the BH3 fragment was selected using the controls palette, then the H atoms were substituted for Cl atoms using the periodic table window.
Next, the symmetry of the molecule was constrainted to D3h and the tolerance set to “Very tight (0.0001)”.
The job type was specified as required using the GV 5.0 interface so that the input file read as below:
 %chk=F:\y3 comp labs\mod2\BH3BCl3\csy07BCl3optfreq.chk
# opt freq b3lyp/lanl2mb geom=connectivity

BCl3 opt+freq

0 1
 B                  0.00000000    0.00000000    0.00000000
 Cl                -1.61946750   -0.93500000    0.00000000
 Cl                 1.61946750   -0.93500000    0.00000000
 Cl                 0.00000000    1.87000000    0.00000000

 1 2 1.0 3 1.0 4 1.0
 2
 3
 4
The default geometry was used as a starting point in the optimisation. A joint opt+freq job was run to check that the final geometry is in fact a minimum: the presence of no negative frequencies indicates that the stationary point found is a minimum considering all nuclear position variables (see section 1.1.2 for a more detailed discussion). If optimisation and frequency jobs are carried out separately (i.e.: using the .chk of the optimisation as the input for the frequency calculation), the same method and basis set must be used in each calculation to ensure that the results are valid. For example, optimising in 3-21G and conducting a frequency analysis at 6-31G is useless since the geometry is not at a minimum in 6-31G: because of the nature of the computations involved frequency calculations are only valid at stationary points on the PES.
The calculation method is B3LYP, the basis set LANL2MB. At this point a brief discussion on the method/basis set of input files may be useful. The method used thus far in the module has been the hybrid functional Becke’s three-parameter formulation B3LYP, which is a DFT method. In general, DFT methods compute electron density via general functionals of electron density. Hybrid functionals like the B3LYP method define the exchange functional as a linear combination of Hartree-Fock, local and gradient-correlated exchange terms. This exchange functional is combined with a local and/or gradient-corrected correlation functional[4]. In comparison to semi-empirical, electron-correlation, post-SCF, MPn, coupled cluster, quadratic configuration interaction and other density functional methods, the B3LYP method lies toward the cheaper end of computational expense for any given basis set and molecule.
The basis set mathematically defines the orbitals within the system. Gaussian functions (aka Gaussian primitives) are linearly combined and together form the basis functions used to approximate the orbitals. Minimal basis sets use fixed-size atomic-type orbitals: for the STO-3G basis set three Gaussian primitives are used per basis function (accounting for the “3G” in the name). Split valence basis sets (e.g.: 3-21G, 6-31G, 6-311G) have two or more sizes of basis function for each valence orbital, and allow the orbitals to change size. Polarized basis sets also allow the orbitals to change shape (e.g.: 6-31G(d): the 6-31G basis set with d functions added to heavy atoms). Diffuse functions allow orbitals to occupy a larger region in space (e.g.: 6-31+G(d): the 6-31G(d) basis set with diffuse functions added to heavy atoms). In this case, the LANL2MB basis set is used, which is somewhat different to the basis sets previously described. For elements post-3rd-row, electrons near the nuclear core are treated via effective core potentials (ECPs), also known as pseudo-potentials (PPs). The basis set includes some relativistic effects which are important for post-3rd-row atoms.
On successful completion of the job using Gaussview 9.0w (11.0 seconds), the convergence of forces and displacements was immediately checked and found to be acceptable. No negative frequencies were calculated, and the 6 low frequencies were within ±10 cm-1 of 0 cm-1.
Low frequencies --- -8.7713 -4.0846 -4.0846 -0.0021 0.0050 0.0093
- Output: Media:csy07BCl3optfreq.log
- Results summary: Media:csy07BCl3optfreq.txt
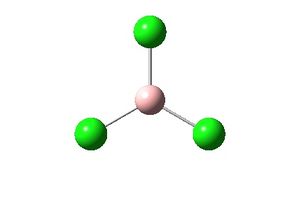
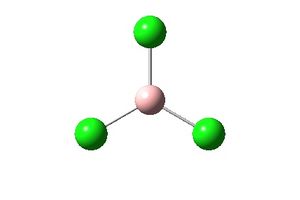
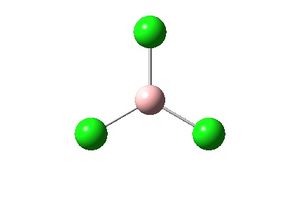
Searching for the point group in the .log file using WordPad identifies that the symmetry of the final optimised structure (after 3 iterations) is D3h as expected by constraining the symmetry of the molecule. This matches the geometry expectation for the ground state structure based on the simple grounds of VSEPR theory (repulsive Coulombic forces between electrons in B-Cl bonds minimised with a D3h geometry, bond angles are 120°). Qualitatively, if a Walsh diagram were drawn for BCl3 from a D3h point group to C3v, the energy of the occupied MOs 1a1’, 2a1’, 1e’ increases (no advantageous MO mixing, lowering of orbital overlap and thus stabilisation energy).
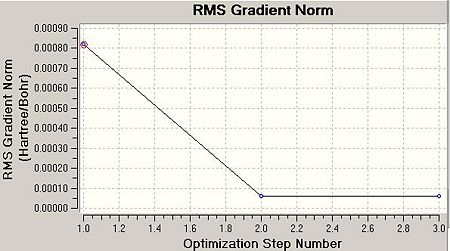
(Energy = -69.439 a.u., stated just for a check). Opening the .log file in GV 5.0 identifies a B-Cl bond length of 1.87 Å and a Cl-B-Cl angle of 120° (this bond angle is expected for a D3h symmetry). The bond angle is identical to that recorded in literature[5], but the calculated bond length is 0.12 Å higher than the experimental measurement (1.75 Å). The discrepancy is probably due to the basis set used: none of the atoms of BCl3 are post-3rd-row so the LANL2MB basis set may not be the most appropriate to use. The RMS grad norm is <0.001, indicating that a stationary point has been found within the limits set by Gaussian 09w.
| Table 1.2 – Intermediate Geometries of BCl3 Optimisation | ||
|---|---|---|
| 1 (initial geometry from input file) | 2 | 3 (final geometry) |
 |
 |
 |
 |
 |
GV 5.0 sometimes does not display bonds between atoms as the user would expect. For a discussion of this and the definition of a bond, please refer to secion 1.1.1.
Cis and Trans Isomers of Mo(CO)4(PR3)2
Input
GV 5.0 was used to create the input files. The cis and trans Mo(CO)4(PCl3)2 isomers were constructed using the controls palette.
The saved input files were opened in WordPad and the route section specified as per below (route section, title section and molecular specification displayed, input file for cis isomer shown).
%chk=/work/csy07/Mod2/Mo/cisopt1.chk
# opt=loose b3lyp/lanl2mb geom=connectivity

Mo(CO)4(L)2 cis opt 1

0 1
 Mo                 0.01644737   -0.13157895    0.00000000
 C                  2.07644737   -0.13157895    0.00000000
 C                  0.01644737    1.92842105    0.00000000
 C                  0.01644737   -0.13157895    2.06000000
 C                  0.01644737   -0.13157895   -2.06000000
 P                  0.01644737   -2.47157895    0.00000000
 P                 -2.32355263   -0.13157895    0.00000000
 O                  0.01644737   -0.13157895    3.17540000
 O                  0.01644737   -0.13157895   -3.17540000
 O                  3.19184737   -0.13157895    0.00000000
 O                  0.01644737    3.04382105    0.00000000
 Cl                -3.00355203   -1.79723191   -0.96166576
 Cl                -3.00355299    1.53407410   -0.96166492
 Cl                -3.00355202   -0.13157895    1.92333066
 Cl                -1.64920597   -3.15157833   -0.96166512
 Cl                 1.68210071   -3.15157833   -0.96166512
 Cl                 0.01644737   -3.15157930    1.92333032

 1 2 1.0 3 1.0 4 1.0 5 1.0 6 1.0 7 1.0
 2 10 3.0
 3 11 3.0
 4 8 3.0
 5 9 3.0
 6 15 1.0 16 1.0 17 1.0
 7 12 1.0 13 1.0 14 1.0
 8
 9
 10
 11
 12
 13
 14
 15
 16
 17
The LANL2MB basis set was used in both cases and the keyword opt=loose specified to get the rough geometry (upon which a further optimisation was conducted using a more accurate basis set).
All jobs were run on the HPC:CX1 service rather than SCAN. This was done essentially to save queuing time, and also to use one of the latest development version of Gaussian (gdvh01_725). On consideration of the number of basis functions describing the molecule, the CPU resource usage is far too much for the laptop to handle adequately (see section 3.2 for a discussion). The template code for the jobscript.sh is given in section 3.2.
On successful completion of the jobs (7 min 14.7 sec for cis, 5 min 10.7 sec for trans), the convergence of forces and displacements was immediately checked and found to be acceptable (values within stated thresholds):
For the cis isomer:
         Item               Value     Threshold  Converged?
 Maximum Force            0.000250     0.002500     YES
 RMS     Force            0.000080     0.001667     YES
 Maximum Displacement     0.008429     0.010000     YES
 RMS     Displacement     0.002275     0.006667     YES
 Predicted change in Energy=-1.865063D-06
 Optimization completed.
    -- Stationary point found.
For the trans isomer:
         Item               Value     Threshold  Converged?
 Maximum Force            0.000113     0.002500     YES
 RMS     Force            0.000030     0.001667     YES
 Maximum Displacement     0.004939     0.010000     YES
 RMS     Displacement     0.001700     0.006667     YES
 Predicted change in Energy=-3.129923D-07
 Optimization completed.
    -- Stationary point found.
- Output (cis): Media:csy07cis1.log
- Output (trans): Media:csy07transa.log
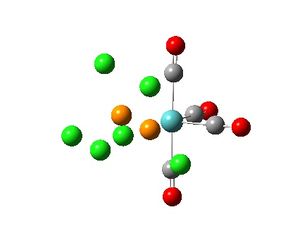
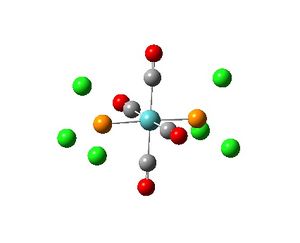
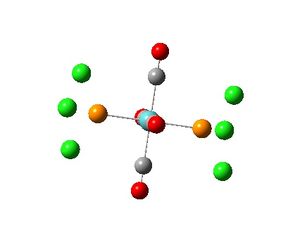
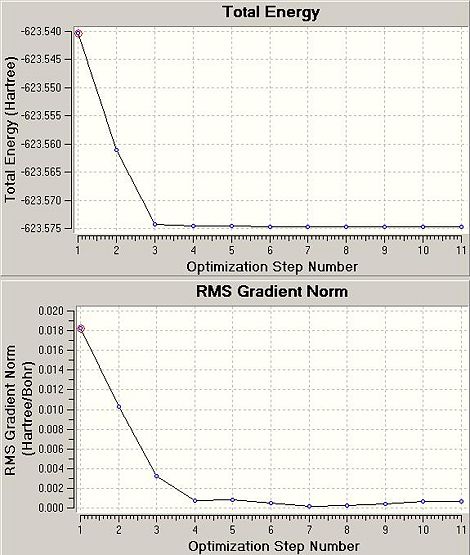
The .log files detail that for the cis isomer, 11 cycles from the input geometry were required before forces and displacements converged successfully. For the trans isomer, 6 cycles were necessary. The .chk files were exported from HPC:CX1 as .fchk files and the intermediate geometries displayed with GV 5.0. The initial and final geometries are shown with two optimisation plots (Total Energy (Hartree) vs. Optimisation Step Number and RMS Gradient Norm (Hartree/Bohr) vs. Optimisation Step Number) for each isomer.
 |
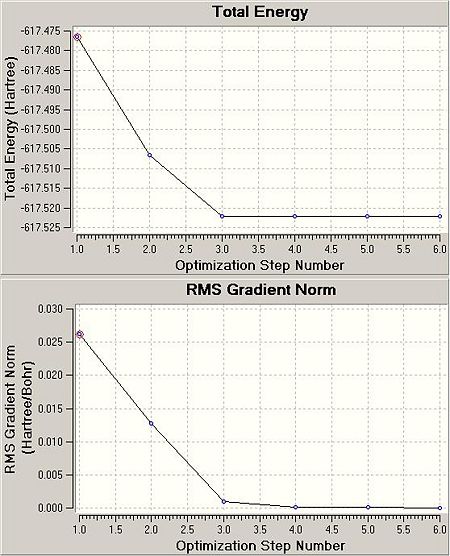 |
The RMS gradient norm for the final geometries in the cis case is 0.001 and in the trans case 0.000. The RMS gradient norm for both cases is below the absolute value of 0.001: these structures are classified as stationary points on their respective PESs.
The .log files were opened in GV 5.0 and manipulated to the recommended structures for the next optimisation step. The route section was altered in WordPad: the new input file for the cis isomer is shown below:
%chk=\work\csy07\Mod2\Mo\cisopt_2today.chk
# b3lyp/lanl2dz geom=connectivity opt freq int=ultrafine scf=conver=9
LANL2DZ is a double zeta: the basis set and pseudo-potential are superior than those of LANLMB. By running a joint opt+freq job the geometry of the molecules can be checked as a minimum on the Potential Energy Surface (PES) immediately (by ensuring no negative second derivatives as indicated by the printed frequencies).
On successful completion of the jobs (xxx min xxx sec for cis, 27 min 6.4 sec for trans), the convergence of forces and displacements were immediately checked and found to be acceptable. No negative frequencies were found and so the optimised geometries are minima at the B3LYP/LANL2DZ level.
- Output (cis): Media:csy07cis2.log
- Output (trans): Media:csy07transb.log
Results and Discussion
All subsequent analysis is carried out using the geometry optimised at the higher level calculation. The energies for the cis and trans isomers are shown below:
| Table 2.2a – Total energies of [Mo(CO)4(PCl3)2] isomers | ||
|---|---|---|
| Isomer | Energy / a.u. | Energy / kJ/mol |
| Trans | -623.576 | -1637200 |
| Cis | -623.576 | -1637200 |
The trans isomer has a slightly more negative energy than the cis isomer (looking beyond 3 decimal places) and is therefore the more stable in agreement with literature[6]. This energy difference is very small. If the R groups were not Cl but instead PPh3, the increase in steric bulk would push the energy of the cis isomer further above that of the trans isomer. To compare geometric parameters, trans-[Cr(CO)4(PPh3)2] is used as a literature comparison due to the lack of available literature (Cr is directly above Mo in the d black and so can be considered as a good substitution for comparison purposes).
| Table 2.2b - Geometric parameter comparisons for the cis and trans isomers | ||||
|---|---|---|---|---|
| Parameter | trans- Cr(CO)4(PPh3)2, lit.[7] | trans- Mo(CO)4(PCl3)2 (calc) | cis- Mo(CO)4(PPh3)2 (opt) | cis- Mo(CO)4(PCl3)2, calc |
| P-M bond length (av.) / Å | 2.37 | 2.45 | 2.577 | 2.48 |
| M-C bond length (av.) / Å | 1.87 | 2.06 | 2.04 | 2.03 |
| < P-M-P / ° | 176.7 | 177.4 | 104.6 | 94.1 |
| < P-M-C trans (av.) / ° | 90.0 | 90.0 | 163.7 | 175.3 |
| < P-M-C cis / ° | N/A | N/A | 80.6 | 89.3 |
For the cis case there is in general very good agreement between literature and calculated values. However, for the trans case there a larger degree of discrepancy, simply due to the steric effects the Ph3 groups introduce at this geometry. The IR spectra for each isomer is shown below:
The experimental and calculated CO stretching modes (IR active) are listed in the table below.
| Table 2.2c – Experimental and calculated CO stretches (IR active) | |||
|---|---|---|---|
| Isomer | Experimental CO stretches[8] | Calculated CO stretches | Symmetry of stretches (respective) |
| Cis (C2v) | 1867, 1896, 1924, 2026 | 1938, 1941, 1953, 2020 | 2A1, B1, B2 |
| Trans (D4h | 1889 | 1950 | Eu |
Recalling from the very start of the module that frequency calculations include a systematic error of about 10%, there is very good comparison between experiment and calculation. As expected there are the same number of bands as predicted by symmetry for the cis and trans isomers. No frequencies were found which were low or negative.
Mini-project: Electronic and Structural Studies of [η2-C2HxCl4-x)NiCl3]- Complexes
Introduction
Metal complexes of alkenes have found great practical use in inorganic syntheses and industry. One of the first such organometallic compounds reported was Zeise's salt, the anion being [η2-C2H4)PtCl3]-. This mini-project focusses on 16-electron complexes of the form [η2-C2HxCl4-x)NiCl3]-, the aim being to investigate the effects of stoichiometry and stereochemistry on MOs, natural bond order variables, C-C bond length and strength, ligand group bending, complex geometry and energies across appropriate series using computational methods.
The choice of this complex class is suitable for investigation for a number of reasons:
- - There are between 6 and 10 non-hydrogen atoms in the molecules chosen, so computational expense should be kept to a minimum.
- - The molecule can be optimised using a wide range of basis sets. If the metal atom chosen is heavier than Br, basis sets such as 6-311+G(d,p) would not be compatible and the level of accuracy would be limited. If the metal atom chosen is heavier than Xe, basis sets as simple as STO-3G would be incompatible and post-3rd-row basis sets (e.g.: LANL2DZ) would have to be used.
- - Although this is in principle a straightforward investigation, there is a wealth of information to be extracted from the output files as listed above.
Methods/Basis Sets used
It is worth mention that all jobs were run on the HPC:CX1 service rather than SCAN. This was done essentially to save queuing time, and also to use one of the latest development version of Gaussian (gdvh01_725). The template code for the jobscript.sh is given below:
#PBS -l ncpus=1
#PBS -l mem=1200mb
#PBS -l walltime=3:00:00
#PBS -j oe

export FLD=Mod2/1-Ni
export FLNM=9

module load gaussian/devel-modules
module load gdvh01_725

echo $FLNM.com

gdv < $HOME/$FLD/$FLNM.com > $WORK/$FLD/$FLNM.log
To reduce computational time and expense, the optimisation was planned to run in two parts: first an optimisation at the B3LYP/3-21G level, then taking this geometry from the .chk file an optimisation at the B3LYP/6-311+G(d,p) level. These are sufficiently accurate methods/basis sets for the size of the molecules. A word on the latter basis set: this is triple zeta, and adds extra valence functions (3 sizes of s and p functions) to 6-31+G(d) (this emphasises an advantage of studying a Ni-containing system (rather than Pd or Pt): such accurate basis sets are applicable for atoms up to Br).
An estimation of the minimum CPU resource usage can be made by noting that for optimisations using the B3LYP method, CPU requirements roughly scale as the fourth power of the number of basis functions[9]. The smallest number of basis functions will be for the case [η2-C2 H4)NiCl3]- using the 3-21G basis set.
The 3-21G basis set has 2 sets of function in the valence region of each atom. Therefore, the elements are represented as:
- H: 1s, 1s’ (total: 2)
- C: 1s, 2s, 2s’, 2px, 2py, 2pz, 2px’, 2py’, 2pz’ (total: 9)
- Cl: [Ne] 3s, 3s’, 3px, 3py, 3pz, 3px’, 3py’, 3pz’ (total:13)
- Ni: [Ar] 4s, 4s’, 3dxy, 3dxz, 3dyz, 3dx2-y2, 3dz2 (total: 16)
For [η2-C2 H4)NiCl3]-, there is a total of 16+2x9+4x2+3x13=81 basis functions.
CPU resource usage is therefore proportional to 814. To estimate the time the job would take on the laptop, this CPU usage can be compared to that for the BH3 optimisation which also used a B3LYP method. In this case there were a total of 15 basis functions (the 3-21G basis set was used), giving a CPU usage proportional to 154. The BH3 optimisation took 11.0 seconds to complete, implying that the [η2-C2 H4)NiCl3]- optimisation will take approximately 9400 seconds (2.6 hr) to complete on the laptop. Similarly, the [η2-C2 Cl4)NiCl3]- optimisation will take roughly 53000 seconds (14.7 hr) to complete on the laptop. Clearly, without even considering the case for the 6-311+G(d,p) basis set, there is a need to run the jobs on the HPC:CX1 system.
Starting Geometries
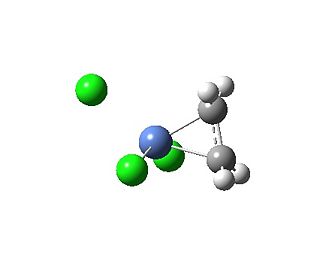
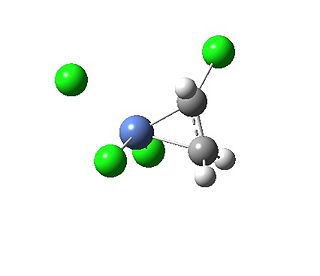
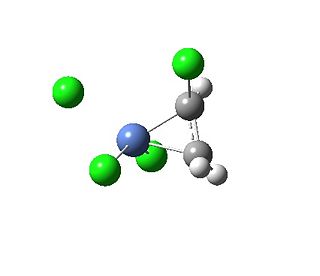
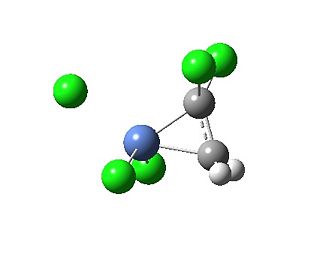
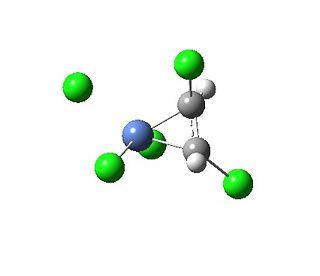
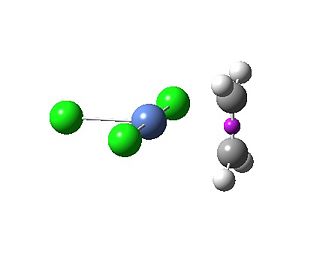
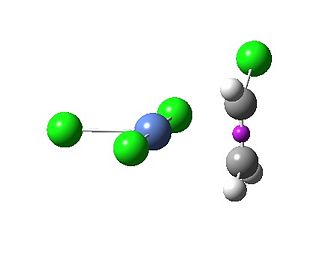
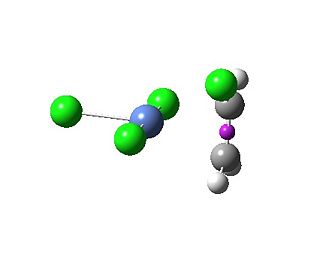
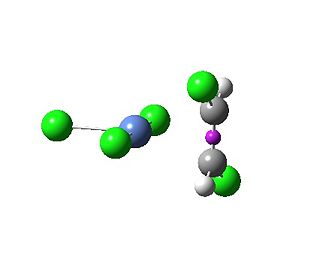
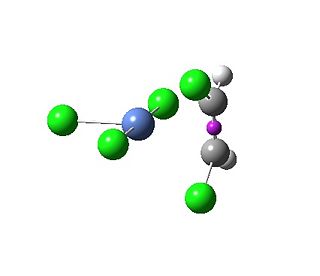
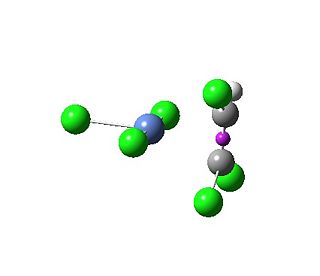
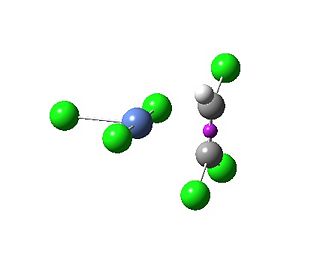
The starting geometries (based on the stable structure of the anion of Zeise’s salt, C2v point group) were drawn and saved using GV 5.0:
 |
 |
 |
 |
 |
 |
 |
 |
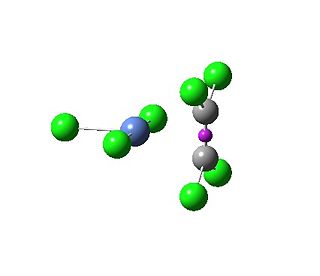 |
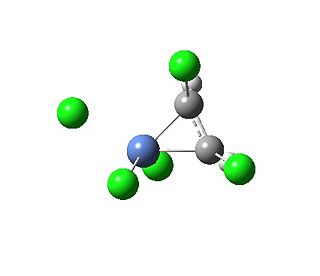
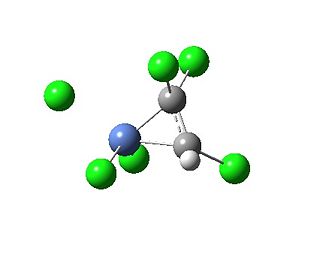
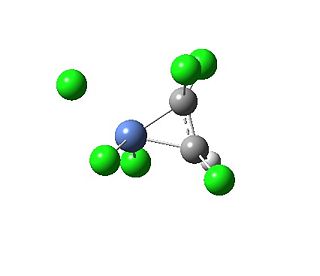
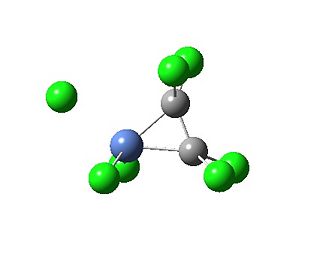
The project systematically varies the value of x in the generic formula [η2-C2HxCl4-x)NiCl3]-. When x= 3, 2, 1 there are 2, 3, 2 possible stereochemistries (respectively). These are drawn to allow comparison of energies and structures for stereoisomers later in the project.
Opt+Freq job
The route section for the joint opt+freq job run on each starting geometry is shown below:
 %chk=/work/csy07/Mod2/1-Ni-nosymm/6.chk
#p b3lyp/3-21g geom=connectivity opt(maxcycle=50) freq nosymm

Initial opt and freq check

-1 1
(The charge and multiplicity for each input file had to be corrected manually using WordPad prior to calculation). The opt(maxcycle=50) keyword sets a limit on the number of iterations the optimisation performs to prevent unnecessary computational expense (optimisations here should converge within 50 cycles). The nosymm keyword prevents reorientation of the starting geometry: all computations are performed in the input orientation. A joint opt+freq job was run to check that each final geometry is in fact a minimum: the presence of no negative frequencies indicates that the stationary point found is a minimum considering all nuclear position variables (see section 1.1.2 for a more detailed discussion).
Four-coordinate Ni(II) complexes often take up tetrahedral-like geometries (unlike four-coordinate Pd(II) or Pt(II) complexes which take up square planar geometries), and this was the expectation. This was indeed the case on successful completion of all jobs (see below). In reality though, distortions occur because of the Jahn-Teller effect (non-linear molecules with degenerate electronic ground states distort to remove the degeneracy and lower the overall energy of the complex).
The convergence of forces and displacements was immediately checked for all files and found to be acceptable. No negative frequencies were calculated for any geometry. The 6 low frequencies for almost all files were within ±10 cm-1 of 0 cm-1 (the most out-of-range value was 16cm-1 for the case x=4). This indicates that even with the 3-21G basis set sufficiently accurate results were produced. In fact, due to the external time constraints on the project and the fact that the optimisations were sufficiently accurate, no further calculations were run using the 6-311+G(d) basis set as planned in the introduction.
Optimised geometries:
The longest job took 3 min 33.9 sec for the case x=0. The greatest number of optimisation cycles was 46 from the starting geometries of Fig 3.3e and Fig 3.3f.
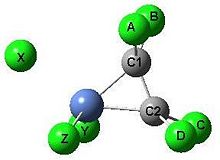
- Output (starting geometry from Fig 3.3a): Media:csy07mpstart1.log
- Output (starting geometry from Fig 3.3b): Media:csy07mpstart2.log
- Output (starting geometry from Fig 3.3c): Media:csy07mpstart3.log
- Output (starting geometry from Fig 3.3d): Media:csy07mpstart4.log
- Output (starting geometry from Fig 3.3e): Media:csy07mpstart5.log
- Output (starting geometry from Fig 3.3f): Media:csy07mpstart6.log
- Output (starting geometry from Fig 3.3g): Media:csy07mpstart7.log
- Output (starting geometry from Fig 3.3h): Media:csy07mpstart8.log
- Output (starting geometry from Fig 3.3i): Media:csy07mpstart9.log
The structural data associated with each optimised geometry is summarised below.
| Table 3.4 – Parameters associated with each optimised geometry | |||||||||||||||
|---|---|---|---|---|---|---|---|---|---|---|---|---|---|---|---|
| Molecule | C1-C2 bond length / Å | C1-C2 bond stretching frequency / cm-1 | C1-C2 bond stretching animation | < / ° Ni-C1-A | < / ° Ni-C1-B | < / ° Ni-C2-C | < / ° Ni-C2-D | < / ° X-Ni-Y | < / ° Y-Ni-Z | < / ° Z-Ni-X | < / ° C1-Ni-C2 | Energy / a.u. | |||
| 1 | 1.42 | 1220 |
|
109.8 | 109.8 | 112.0 | 112.0 | 96.0 | 149.0 | 96.0 | 43.4 | -2953.482 | |||
| 2 | 1.41 | 1311 |
|
112.0 | 115.6 | 113.0 | 112.2 | 95.9 | 145.2 | 96.0 | 43.6 | -3410.880 | |||
| 3 | 1.41 | 1311 |
|
115.6 | 112.0 | 112.2 | 113.0 | 96.0 | 145.2 | 95.9 | 43.6 | -3410.880 | |||
| 4 | 1.42 | 1273 |
|
115.6 | 115.6 | 113.1 | 113.1 | 96.7 | 138.7 | 96.7 | 44.0 | -3868.267 | |||
| 5 | 1.41 | 1363 |
|
114.9 | 114.3 | 124.4 | 112.4 | 95.0 | 145.5 | 94.4 | 44.0 | -3868.271 | |||
| 6 | 1.42 | 1286 |
|
118.0 | 110.0 | 111.8 | 125.7 | 95.0 | 144.2 | 96.1 | 44.3 | -3868.268 | |||
| 7 | 1.43 | 1248 |
|
114.6 | 117.9 | 125.8 | 111.9 | 95.8 | 138.4 | 95.9 | 44.6 | -4325.654 | |||
| 8 | 1.43 | 1248 |
|
117.9 | 114.6 | 112.0 | 125.7 | 95.8 | 138.4 | 95.8 | 44.6 | -4325.654 | |||
| 9 | 1.45 | 1216 |
|
116.1 | 116.1 | 122.2 | 122.2 | 94.1 | 135.7 | 94.1 | 45.4 | -4783.030 | |||
Energies are reported purely for comparison between stereoisomers (evidently there is no large difference in these values across molecules 2 and 3, molecules 4, 5 and 6, and molecules 7 and 8).
Considering C1-C2 bond lengths, there is a general extension as more Cl groups are added. This is complimented by a general increase in the C1-Ni-C2 bond angle. These observations are indicative of a weakening of the C1-C2 bond.
In general, as the number of Cl atoms increase, the C1-C2 bond stretching frequency decreases. This is further evidence of the weakening of the C1-C2 bond: classically-speaking, wavenumber absorption is given by ν = 1/2π(k/μ)1/2 where k is a measure of bond stiffness and μ is the reduced mass of the system component. If the stretching frequency decreases whilst μ stays constant (as in this case), this indicates that the bond stiffness (i.e.: strength) is decreasing. A point on this: there is an exception to the observed trend when x=4 (i.e.: all H groups on the ligand). Observing the stretching animation in table 3.4, it looks as if the heavy Cl atoms act as “anchors” to vibrational motion, increasing the stiffness of the C1-C2 bond by restricting movement. It can be argued that the stretching frequency for x=4 is surprisingly low since there are no such “heavy atoms” restriction on vibration.
The observed trends can be expected and rationalised through invoking the Dewar-Chatt-Duncanson model for metal-alkene bonding. The model explains that there is a σ component from the C-C π bonding MO to an unoccupied metal AO (d or p) of appropriate symmetry, and a π-component from an occupied metal d AO to the unoccupied C-C π* antibonding MO (these components will be subject of the MO analysis of the next section). The latter contribution is known as backbonding. The lower the C-C π* antibonding MO in energy, the smaller the energy difference between this MO and the contributing metal AO and so the larger the splitting energy (greater effect). Consequently, there is in general an increase in the degree of backbonding as more electronegative groups are attached to the C2 ligand (lower splitting energy on the ligand means the C-C π* MO is low in energy). This can also be rationalised by considering inductive effects: with more electronegative groups on the ligand electron density is “pulled” from the metal and the degree of backbonding is increased.
There is a continuum between “no backbonding” (where the carbon atoms are sp2 hybridised and the bond can be described as pure “metal-alkene”) and “significant backbonding” (where the carbon atoms are sp3 hybridised and the bond is described as “metallacyclopropane”). For the case x=0, GV 5.0 has in fact drawn a metallacyclopropane (see fig. 3.3r) since the degree of backbonding increases from x=4 to x=0. The net effect of backbonding is to decrease the electron density between the C atoms and weaken the C1-C2 bond as observed.
Focussing on stereoisomers, since molecule groups 2 and 3 and molecule groups 7 and 8 are related by symmetry there are effective no differences between the structural properties of each isomer. However there are interesting points to note about the group 4, 5 and 6, in particular looking at the value of frequency vibrations. Observing the vibrations, considering the magnitube of the vectors shown and recalling the conjectured “anchoring” effect previously discussed, it is evident that the most freedom to movement is given to isomer 4 whilst the most restricted isomer is 5. Consequently, the value of the C1-C2 stretching frequency decreases in the order 5>6>4.
A discussion of the other bond angles measured will be considered in the next section in the context of an NBO analysis.
MO and NBO analysis
The relative MO energies for the σ and π components (cf. The DCD model) for the cases x=4 and x=0 are summarised in the table below:
| Table 3.5 – MO captions and relative energies | ||||
|---|---|---|---|---|
| Molecule | σ component | Relative energy / a.u. | π component | Relative energy / a.u. |
| 1 |  |
-0.373 |  |
-0.262 |
| 9 |  |
-0.393 | 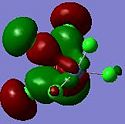 |
-0.316 |
The case x=0 displays the lowest energy for both components. Looking at the MO cartoons above, this is evidently due to the presence of the sigma-directed p-orbitals. The Cl p orbitals overlap with the C-C π and π* MOs to lower the fragment orbital energies on the C2Cl4 moiety. Qualitatively:
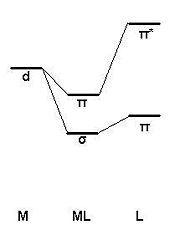 |
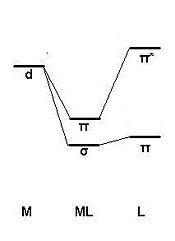 |
|---|---|
| C2H4 | C2Cl4 |
From C2H4 to C2Cl4, as the C-C π and π* MOs move down in energy there is an increase in the energy difference between M d and C-C π but a decrease in energy difference between M d and C-C π*. Consequently there is a lesser stabilisation energy for the σ component than before but a greater stabilisation energy for the π component. This explains why there is a greater observed change in the relative energy of each component between molecules. In addition, the qualitative picture also shows why there is a smaller difference between the relative energies of components for each molecule: the gain in stabilisation energy for the π component is greater than the loss in stabilisation energy for the σ component.
Considering the information in the .log files relating to NBO analysis, the charge on the Ni atom generally decreases from x=4 to x=0:
This can be rationalised by considering the increasing degree of backbonding from x=4 to x=0: as the number of Cl substituents increases there is an increase in electron density between the Ni and alkene moieties, leading to a slight change in the δ- direction for Ni. This result is unexpected if a simple induction idea is used, and highlights the importance of using computational studies to explain results.
The “Bond orbital/ Coefficients/ Hybrids” in the NBO section for the Ni-C bonds in molecules 1 and 9 are found below.
Molecule 1:
4. (1.79528) BD ( 1)Ni   1 - C   5
                ( 45.24%)   0.6726*Ni   1 s( 21.35%)p 0.43(  9.12%)d 3.26( 69.52%)
                                            0.0000  0.0000  0.0000  0.4613  0.0208
                                           -0.0166 -0.0070  0.0000  0.0000 -0.0004
                                            0.0000  0.0000  0.0000 -0.2866  0.0383
                                            0.0000  0.0000  0.0865  0.0135  0.0003
                                            0.0000 -0.0007  0.0000 -0.4268  0.0079
                                           -0.0826  0.0041  0.7114 -0.0052
                ( 54.76%)   0.7400* C   5 s(  9.45%)p 9.58( 90.55%)
                                           -0.0002  0.3018 -0.0587  0.0006 -0.0001
                                            0.7460 -0.0597 -0.5841  0.0653
     5. (1.74192) BD ( 1)Ni   1 - C   8
                ( 39.11%)   0.6254*Ni   1 s( 10.71%)p 3.52( 37.74%)d 4.81( 51.55%)
                                            0.0000  0.0000  0.0000 -0.3268 -0.0061
                                            0.0141  0.0069  0.0000  0.0000  0.0003
                                            0.0000  0.0000  0.0000  0.6106 -0.0571
                                            0.0000 -0.0001 -0.0341  0.0135 -0.0005
                                            0.0000 -0.0002  0.0000 -0.1295 -0.0051
                                            0.5435 -0.0039  0.4509  0.0012
                ( 60.89%)   0.7803* C   8 s( 10.87%)p 8.20( 89.13%)
                                            0.0000 -0.3249  0.0560 -0.0006  0.0000
                                           -0.7621  0.0809  0.5500 -0.0377
Molecule 9:
4. (1.84393) BD ( 1)Ni   1 - C   5
                ( 38.57%)   0.6210*Ni   1 s( 22.95%)p 0.31(  7.01%)d 3.05( 70.03%)
                                            0.0000 -0.0001 -0.0012  0.4787  0.0034
                                           -0.0182 -0.0061  0.0000  0.0013 -0.2510
                                            0.0076  0.0000  0.0000 -0.0002  0.0000
                                            0.0000 -0.0002  0.0783  0.0309  0.0004
                                            0.0000 -0.5547  0.0085 -0.0010  0.0000
                                            0.1546 -0.0051  0.6071 -0.0022
                ( 61.43%)   0.7838* C   5 s( 18.15%)p 4.51( 81.85%)
                                           -0.0005  0.4237 -0.0441  0.8061 -0.0164
                                           -0.0005  0.0000 -0.4093  0.0296
     5. (1.80064) BD ( 1)Ni   1 - C   6
                ( 29.18%)   0.5402*Ni   1 s( 12.39%)p 3.41( 42.26%)d 3.66( 45.35%)
                                            0.0000  0.0001  0.0014 -0.3511 -0.0011
                                            0.0236  0.0070  0.0000 -0.0009  0.6404
                                           -0.0168  0.0000  0.0000 -0.0007  0.0000
                                            0.0000  0.0010  0.1100  0.0035  0.0011
                                            0.0000 -0.3296 -0.0048  0.0000  0.0000
                                           -0.4732  0.0057  0.3478 -0.0015
                ( 70.82%)   0.8416* C   6 s( 22.99%)p 3.35( 77.01%)
                                            0.0006 -0.4782  0.0348 -0.7245  0.0469
                                            0.0002  0.0000  0.4930  0.0001
Considering the AO contributions from each C to the Ni-C bonds for each molecule, the s:p contributions for each C in molecule 9 are closer to 1:3 (i.e.: sp3) than in molecule 1, causing a "bending back" of the alkene substituents away from the Ni centre. The angles listed in table 3.4 can be likewise explained by considering the hybridisation of each atom for each structure.
References
- ↑ M.W. Wong, Chem Phys Lett (1996), 256: 391.
- ↑ Hedberg K, Schomaker V (1951). "A Reinvestigation of the Structures of Diborane and Ethane by Electron Diffraction". Journal of the American Chemical Society 73: 1482–1487. doi= 10.1021/ja01148a022
- ↑ Clayden, Greeves, Warren, Wothers (2006). Organic Chemistrys , OUP, ISBN 0-19-850346-6
- ↑ Foresman, Frisch (1996). Exploring Chemistry with Electronic Structure Methods (2nd ed.), Gaussian, Inc., ISBN 0-9636769-3-8
- ↑ Greenwood, Norman N.; Earnshaw, A. (1997), Chemistry of the Elements (2nd ed.), Oxford: Butterworth-Heinemann, ISBN 0-7506-3365-4
- ↑ A.D. Allen and P.F. Barrett (1968), Phosphine-substituted carbonyl halide complexes of chromium and molybdenum, Canadian Journal of Chemistry, 46:1649 1653.
- ↑ D. W. Bennett, T. A. Siddiquee, D. T. Haworth, S. E. Kabir, F. K. Camellia, J. Chem. Crys., 2004, 34, 353-359.
- ↑ J. Shamir,* A. Givan, M. Ardon and G. Ashkenazi (1993), “Vibrational Spectra of the cis and tram Isomers of the Mo(Co)4(PPh3)2 Complex”, Journal of Raman Spectroscopy, 24, 101-103
- ↑ Foresman, Frisch (1996). Exploring Chemistry with Electronic Structure Methods (2nd ed.), Gaussian, Inc., ISBN 0-9636769-3-8

