Rep:Mod2:cbl08
Chia Bai Lin (00567650)
Introduction
Computational chemistry stimulates both thermodynamic and kinetic data of a given compound, and hence gives us an insight into its structure and bonding information. In this module, simple molecular analysis such as molecular orbitals and frequencies will be stimulated and studied for inorganic compounds. The studied compounds include BH3, TlBr3, cis and trans isomers of Mo(CO)4Cl2. Also, in the mini project of this module, different geometrical structures of Sn5 metal clusters will be stimulated and studied.
BH3 Molecule

The boron centre is sp2 hybridised and bonded to 3 hydrogen atoms. It adopts a trigonal planar structure with an empty p orbital perpendicular to the plane. Simple borane is a very reactive molecule and hence it usually exists as a dimer, B2H6. In the subsequent calculations, it is assumed that the BH3 molecule exist and its dimer form will not be taken into account.
Geometric Optimisation
Simple borane BH3 molecule was first created and optimised in Gaussview 5.0, with the B-H bond length modified to 1.5Å. The following command was executed for the optimisation:
Job type: optimisation
The method: DFT - B3LYP
The basis set: 3-21G
The optimisation results can be linked here:
Log file: BH3 Optimisation Output Log file
Results summary: BH3 Opt. Summary Txt
Partial detail extracted from optimisation log file:
 Item               Value     Threshold  Converged?
 Maximum Force            0.000413     0.000450     YES
 RMS     Force            0.000271     0.000300     YES
 Maximum Displacement     0.001610     0.001800     YES
 RMS     Displacement     0.001054     0.001200     YES
 Predicted change in Energy=-1.071764D-06
 Optimization completed.
    -- Stationary point found.
                           ----------------------------
                           !   Optimized Parameters   !
                           ! (Angstroms and Degrees)  !
 --------------------------                            --------------------------
 ! Name  Definition              Value          Derivative Info.                !
 --------------------------------------------------------------------------------
 ! R1    R(1,2)                  1.1935         -DE/DX =    0.0001              !
 ! R2    R(1,3)                  1.1935         -DE/DX =    0.0001              !
 ! R3    R(1,4)                  1.1935         -DE/DX =    0.0001              !
 ! A1    A(2,1,3)              120.0            -DE/DX =    0.0                 !
 ! A2    A(2,1,4)              120.0            -DE/DX =    0.0                 !
 ! A3    A(3,1,4)              120.0            -DE/DX =    0.0                 !
 ! D1    D(2,1,4,3)            180.0            -DE/DX =    0.0                 !
 --------------------------------------------------------------------------------
 GradGradGradGradGradGradGradGradGradGradGradGradGradGradGradGradGradGrad
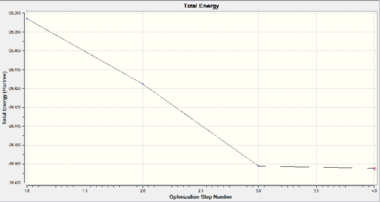
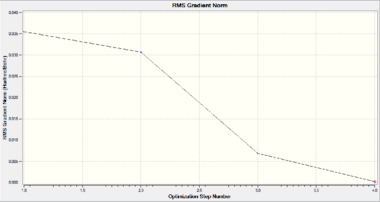
Geometric optimisation aims to simulate the most stable geometric structure of a molecule that give a balance between attractive and repulsive forces. To achieve this, the starting structure will first be analysed to determine the net force experienced by the molecule and then modified accordingly. As the energy gap between successive optimisation decreases, the rate of change of energy with respect to the number of iterations (i.e. the gradient of the Energy graph) reduces and approaches 0. When the successive iterations have the gradient changes within 0.001, the calculation terminates.
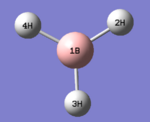
The optimised structure of BH3 is shown as in Fig. 1.1.4. The optimised the H-B-H bond angle is 120.0° and the B-H bond length is 1.19349Å, which matches well with the literature value of 1.1867Å [1]. This indicates that the current computation method of DFT-B3LYP with basis set of 3-21G is a suitable method to compute small molecules such as BH3 to give relatively high accuracy within a short frame of time.
.
Molecular Orbital Analysis of BH3
The optimised structure of BH3 was further used for natural bonding orbital (NBO) analysis. The following command was computed before the molecular orbitals were simulated:
Job type: Energy
The method: DFT - B3LYP
The basis set: 6-31G
Additional keywords: pop=full
The optimisation result is published in D-space: http://hdl.handle.net/10042/to-5893
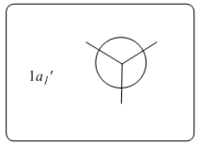
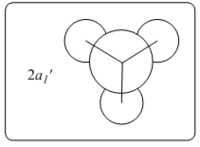
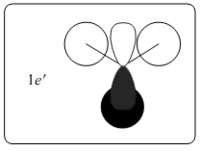
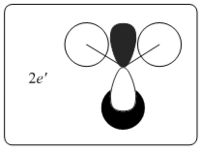
Theoretically, the molecular orbitals of BH3 can be predicted with Linear Combination Atomic Orbital (LCAO) approach. LCAO is the quantum superposition of atomic orbitals and generates new molecular orbitals in quantum chemistry where two atomic orbitals with similar energies and symmetries are likely to combine and generate a new bonding and antibonding orbital. Using the LCAO approach, a molecular Orbital Digram of BH3 can be generated and depicted as shown in Fig.2.2.1.
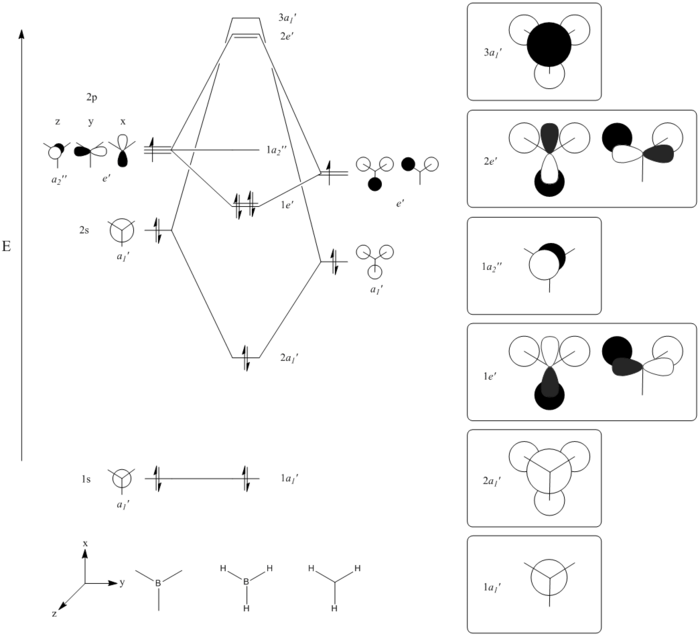
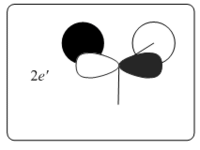
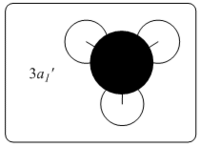
The MOs of BH3 were simulated accordingly using above commands and they are put in comparison with the predicted MOs from LCAO approach. Each computed MO corresponds well to an LCAO MO as shown in table 2.2.2.
| Table 2.2.2 - Correspondence of Simulated MOs with LCAO MOs | |||
|---|---|---|---|
| LCAO MO | Simulated MO | Energy in Hartree a.u. | Notes |
 |
 |
-6.73023 | The lowest lying orbital is the core,1s non-bonding orbital of B atom and it is identical in both models |
 |
 |
-0.51778 | The simulated MO produced a better mixing of bonding interaction in the orbital than the LCAO's, but the general bonding structure for both are the same |
 |
 |
-0.35689 | The HOMO of BH3 is doubly degenerate with one out of phase interaction in the orbital. The simulated MO has again shown a better mix of bonding orbitals that is not shown in the LCAO's MO. |
 |
 |
-0.35689 | The other degenerated HOMO with one out of phase interaction. Both the LCAO's MO and the simulated MO predict the same orbital shape |
 |
 |
-0.07455 | The LUMO is the non-bonding pz orbital in boron atom. The picture of simulated MO is rotated for better vision of MO and both methods predict the same orbital shape. |
 |
 |
0.18879 | LUMO+1 is another doubly degenerated pair. The simulated MO produces a better blending of bonding interaction that is not as clearly visible as depicted in LCAO's MO. |
 |
 |
0.18879 | The simulated MO for LUMO+1 showed a more significant deviation from the LCAO's MO. The simulated MO shows distortion due to opposite phase repulsion of the py lobes this is not depicted in the LCAO model. The simulated MO gives a more realistic picture of the actual molecular orbital interaction. |
 |
 |
0.19236 | The simulated MO has once again given a better picture of the molecular orbital than LCAO's model as it showed the distortion of the boron pz orbital. |
Generally, the simulated MO fits with the LCAO's model well and even showed a more detailed picture of MO as it can be seen in 3D whereas the LCAO's model adopts only a 2D approach. Also, the simulated MO predicts the relative energy of each molecular orbital and the possible reactivity of the molecule can be inferred from here. In this example, the high reactivity of BH3 can be rationalised as the simulated LUMO has a negative energy of E=-0.07455 Hartree a.u (equivalent to 195.73kJ mol-1). The stabilisation energy gained is huge if this orbital is filled and hence BH3 usually exist as a dimer of B2H6 instead of monomer. This inference cannot be observed from simple LCAO approach as it only gives a general qualitative picture but not quantitative information.
Natural Bonding Orbital Analysis of BH3
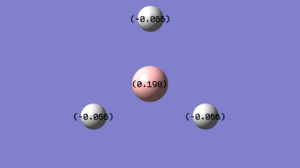
The NBO analysis adopted the same calculation as that for the MO analysis and the result log file can be found here: OUTPUT FILE
 |
 |
From the charge distribution in the molecule, both numerical and visual approaches indicate that the boron atom is more positively charged than the hydrogen atoms. The log file as shown below indicates that for each B-H bond, each boron contributes 46.65% of the electron density and each hydrogen contributes 53.35%, and within boron's contribution, 33.33% is from s orbital and 66.67% is from p orbital. This is in good agreement of the sp2 hybridise nature of the boron centre.
Part of NBO Output file
       (Occupancy)   Bond orbital/ Coefficients/ Hybrids
 ---------------------------------------------------------------------------------
     1. (1.98096) BD ( 1) B   1 - H   2
                ( 46.65%)   0.6830* B   1 s( 33.33%)p 2.00( 66.67%)
                                            0.0000  0.5774  0.0000  0.0000  0.0000
                                            0.8165  0.0000  0.0000  0.0000
                ( 53.35%)   0.7304* H   2 s(100.00%)
                                            1.0000  0.0005
     2. (1.98096) BD ( 1) B   1 - H   3
                ( 46.65%)   0.6830* B   1 s( 33.33%)p 2.00( 66.67%)
                                            0.0000  0.5774  0.0000  0.7071  0.0000
                                           -0.4082  0.0000  0.0000  0.0000
                ( 53.35%)   0.7304* H   3 s(100.00%)
                                            1.0000  0.0005
     3. (1.98096) BD ( 1) B   1 - H   4
                ( 46.65%)   0.6830* B   1 s( 33.33%)p 2.00( 66.67%)
                                            0.0000  0.5774  0.0000 -0.7071  0.0000
                                           -0.4082  0.0000  0.0000  0.0000
                ( 53.35%)   0.7304* H   4 s(100.00%)
                                            1.0000  0.0005
     4. (1.99962) CR ( 1) B   1           s(100.00%)
                                            1.0000  0.0000  0.0000  0.0000  0.0000
                                            0.0000  0.0000  0.0000  0.0000
     5. (0.00000) LP*( 1) B   1           s(100.00%)
... ...
Vibrational Analysis of BH3
For further vibrational analysis of BH3, its optimised structure from previous section was used and the following command was executed:
Job type: Frequency
The method: DFT - B3LYP
The basis set: 3-21G
Additional keywords: pop=full,nbo
The result can be found in here: BH3 Frequency Log File
A total of 6 vibration modes are found and they are summarised in Table 2.4.1.
| Table 2.4.1- Vibrations of BH3 molecule | ||||
|---|---|---|---|---|
| Vibration | Frequency / cm-1 | Infrared | Symmetry D3h point group | Description |
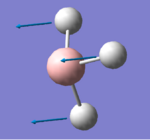 |
1144.15 | 92.8665 | A2'' | All 3 hydrogen atoms undergo concerted, in-phase vibration in the direction that is perpendicular to σh plane |
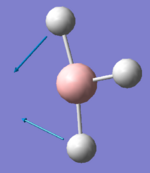 |
1203.64 | 12.3148 | E' | One H atom remains stationary while the other 2 H atoms bend in-phase in the σh plane |
 |
1203.64 | 12.3173 | E' | 2 H atoms bend in-phase while the 3rd H atom rocks in the σh plane |
 |
2598.42 | 0.0000 | A1' | Concerted symmetric stretch of all 3 H atoms in the σh plane |
 |
2737.44 | 103.7400 | E' | One H atom remains stationary while the other 2 H atoms undergo asymmetric stretch in σh plane |
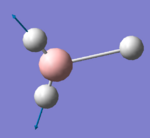 |
2737.44 | 103.7333 | E' | Symmetric stretch for 2 of the H atoms and this is antisymmetric to the larger stretching of the 3rd H atom in the σh plane |
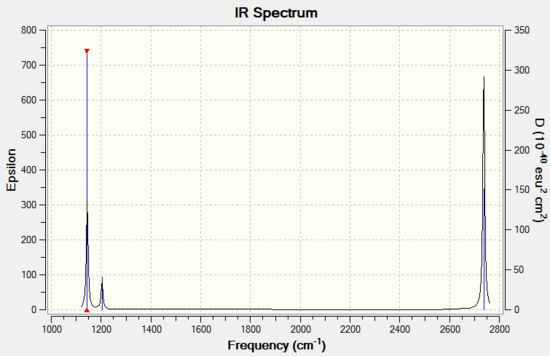
In the IR spectrum, there are a total of 3 peaks found at 1144.15cm-1, 1203.64cm-1 and 2737.44cm-1 respectively. Two of the three peaks are doubly degenerate vibration sets (at 1203.64cm-1 and 2737.44cm-1) and the remaining one is a singly degenerate vibration (at 1144.15cm-1). These make up 5 vibrational modes and the last vibrational mode of A1' vibration was invisible on the spectrum due to its symmetric vibrations which has all the dipole moments cancel out each other, resulting in zero IR absorption.
TlBr3 Molecule
TlBr3 molecule adopts the same geometric structure of trigonal planar as BH3 molecule and has the point group of D3h. It is expected to share similar molecular properties such as bonding and vibrational modes with BH3.
Optimisation of TlBr3 molecule
Before optimising the molecule, the symmetry of TlBr3 is first restricted as follow:
Edit >>>Point Group >>> Enable point group symmetry >>> constrain point group to D3h >>> increase the tolerance to very tight (0.0001)
Job type: Optimisation
The method: DFT - B3LYP
The basis set: LANL2DZ
The basis set used for TlBr3 is LANL2DZ instead of 3-21G because the former uses pseudo-potential, where the core, non-valence electrons are assumed to contribute a constant value and it is the valence electrons that dominate in bonding interactions. This method is a good compromise between time and accuracy as it does not contribute significant difference to the results.
| File Type | .log File |
| Calculation Type | FOPT |
| Calculation Method | RB3LYP |
| Basis Set | LANL2DZ |
| Spin | Singlet |
| Final Energy/Hartree a.u. | -91.2181 |
| Final Gradient | 0.000000090 |
| Dipole Moment | 0.00 |
| Point Group | D3h |
| Time taken | 1 min 40 sec |
| Tl-Br Bond length | 2.65095 Angstroms |
| Br-Tl-Br Bond angle | 120o |
The optimised Br-Tl-Br bond angle is 120.0o and the optimised Tl-Br bond length is 2.65095 Å. This has a greater deviation from the literature bond length of 2.51Å[2]. Unlike the literature used for BH3 is a computational chemistry literature paper, the literature used for TlBr3 has its literature value determined experimentally and this subjects to many possible deviations. In experiments, bond lengths maybe affected by factors such as solvent effect and this is neglected in computational simulations. Also, BH3 is a simple molecule with fewer orbitals to consider during the calculation and hence it is easier to model.
The optimised output file can be found here:TlBr3 Opt. Output file
Frequency Analysis of TlBr3
The same frequency analysis is carried for TlBr3 molecule with the following commands computed:
Job type: Frequency
The method: DFT - B3LYP
The basis set: LANL2DZ
Additional keywords: pop=full,nbo
The frequency output file can be found here: TlBr3 Freq. Output file
| Table 3.2.1- Vibrations of TlBr3 molecule | ||||
|---|---|---|---|---|
| Vibration | Frequency / cm-1 | Infrared | Symmetry D3h point group | Description |
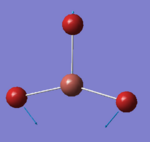 |
46.43 | 3.6867 | A2'' | In-plane sicssoring where 2 Br atoms bends inwards along the σh plane and the 3rd Br atom stretching in out of phase motion |
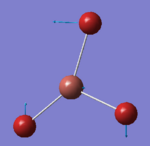 |
46.43 | 3.6867 | E' | Out of phase rocking for all the 3 Br atoms along the σh plane |
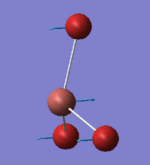 |
52.14 | 5.8466 | E' | All 3 Br atoms wagging in the same direction perpendicular to the σh plane and the Tl atom wags in out of phase motion to the Br atoms |
 |
165.27 | 0.0000 | A1' | Concerted symmetric stretch of all 3 Br atoms in the σh plane |
 |
210.69 | 25.4830 | E' | One of the Br atoms stays stationary and the rest undergo asymmetric stretch in the σh plane |
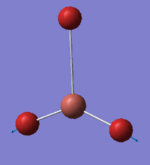 |
210.69 | 25.4797 | E' | One of the Br atoms stays stationary and the rest undergo asymmetric stretch in the σh plane |

Generally, the vibration modes and degeneracies found are the same as that observed in BH3, having 3 distinct peaks and two of which are doubly degenerate and one is effectively invisible due to symmetric vibrational stretch.
The frequencies and the IR intensities are much smaller than that observed in BH3. This is largely due to TlBr3 owns greater ionic character and hence does not have IR active vibrational motions like simple BH3 covalent molecule does. Even though an IR spectrum is generated, if this is to expand to the same intensity scale as BH3, the peaks will be minimal and effectively regards as not visible.
Cis and Trans of Mo(CO)4(PCl3)2 isomers
Metal complexes in the form of ML14L22 display possible cis and trans isomerism and the preference of which isomer is more stable depends many influencing factors such as the nature of the metal and ligand substituents, temperatures and sterics effects. To differentiate between the isomers, IR spectroscopy is a useful technique as the vibrational frequencies will differ for different isomers. In this section, the cis- and trans isomers of Mo(CO)4(PR3)2 are studied particularly on the IR active vibrational modes of the carbonyl ligands.
Computational analysis of Mo(CO)4(PCl3)2 is carried out instead of original Mo(CO)4(PPh3)2 because the phenyl ring contains too many atoms and will take a long time compute. Replacing the phenyl ring with a Chlorine atom is a good match in steric size and a good compromise between computational cost with relatively high accuracy.
The First Optimisation of both Mo(CO)4(PCl3)2 isomers
Before carrying out the optimisation, the isomers are first manually adjusted to a better starting point, with the cis Mo complex has one of the Cl atom align cis with the CO ligand (i.e. Dihedral angle between Cl-P-Mo-Co =0 o) and another Cl atom in the other PCl3 ligand align trans to the same CO ligand (i.e. Dihedral angle between Cl-P-Mo-Co =180 o). For the trans Mo complex, align the 2 PCl3 ligands in the z axis and adjust the PCl3 groups to be eclipsing each other. The starting conformations for both conformers are displayed in the model below.
| Cis Isomer | Trans Isomer | ||||||
|---|---|---|---|---|---|---|---|
|
|
First optimisation of the Mo complex is done with the following commands:
Job type: Optimisation
The method: DFT - B3LYP
The basis set: LANL2MB
Additional keywords: opt=loose
The optimisation output result using LANL2MB basis set can be found here:
1st Opt. of Cis Mo Complex log file
1st Opt. of Trans Mo Complex log file
| Cis Isomer | Trans Isomer | |
|---|---|---|
| File Type | .log File | .log File |
| Calculation Type | FOPT | FOPT |
| Calculation Method | RB3LYP | RB3LYP |
| Basis Set | LANL2MB | LANL2MB |
| Spin | Singlet | Singlet |
| Final Energy/Hartree a.u. | -617.5250 | -617.5221 |
| Final Gradient | 0.00012933 | 0.00040109 |
| Dipole Moment | 8.6333 | 0.3069 |
| Time taken | 13 min 42 sec | 7 min 30 sec |
| 1st Opt. Output file | 1st Cis Output | 1st Trans Output |
The Second Optimisation of both Mo(CO)4(PCl3)2 isomers
To generate a more accurate result, LANL2DZ basis set is used in second optimisation instead of LANL2MB, and the optimisation is done with the following commands:
Job type: Optimisation
The method: DFT - B3LYP
The basis set: LANL2DZ
Additional keywords: int=ultrafine scf=conver=9
| Cis Isomer | Trans Isomer | |
|---|---|---|
| File Type | .log File | .log File |
| Calculation Type | FOPT | FOPT |
| Calculation Method | RB3LYP | RB3LYP |
| Basis Set | LANL2DZ | LANL2dz |
| Spin | Singlet | Singlet |
| Final Energy/Hartree a.u. | -623.5425 | -623.5760 |
| Final Gradient | 0.000127 | 0.00002224 |
| Dipole Moment | 2.9909 | 0.3069 |
| Time taken | 29 min 52 sec | 30 min 14 sec |
| 2nd Opt. Output file | 2nd Cis Output | 2n Trans Output |
| cis [Mo(CO)4(PCl3)2] | lit.[3] cis [Mo(CO)4(PPh3)2] | |
| mean P-Mo bond length / Å | 2.48 | 2.58 |
| mean Mo-C bond length / Å | 2.03 | 2.04 |
| P-Mo-P bond angle / ° | 94.3 | 104.6 |
| P-Mo-C (trans to P) bond angle / ° | 175.8 | 163.7 |
| P-Mo-C (cis to P) bond angle/ ° | 88.7 | 80.6 |
As there is no literature that models cis [Mo(CO)4(PCl3)2] found, the literature for cis [Mo(CO)4(PPh3)2] is used instead. The literature value is expected to be highly similar to that with PCl3 ligands due to reasons as discussed before. From the data above, the simulated bond length matches with that of the literature values pretty well but there is a slightly more significant deviation in the bond angles. One possible reason that can attribute to this deviation in bond angle is the size difference in the PCl3 and PPh3 ligands. The Chlorine atom is still smaller in size than the phenyl ring and hence the PCl3 ligand will have its bond angle closer to the ideal angles of 1800 and 900, and the PPh3 ligands will deviate more from ideality due to its steric clashes from bulky Ph groups. However, the general trends still retains and are in good agreement with the literature, therefore this calculation model is a good match with good accuracy.
| trans [Mo(CO)4(PCl3)2] | lit.[4] trans [Cr(CO)4(PPh3)2] | |
| mean P-M bond length / Å | 2.42 | 2.36 |
| mean M-C bond length / Å | 2.05 | 1.87 |
| P-M-P bond angle/ ° | 177.3 | 176.7 |
| mean P-M-C bond angle / ° | 90.0 | 89.5 |
In the case of trans-Mo(CO)4PCl(3)2, the literature of trans [Cr(CO)4(PPh3)2[4] is used. Chromium is in the same group as Mo and it is expected for Cr to bond in similar fashion as Mo complexes. The bond angles for trans Mo(CO)4(PCl3)2 are in very good agreement with that of the literature's but the bond lengths deviate more significantly in this complex. This deviation is expected as Cr is one period above Mo and hence it is expected to have shorter bond length due to smaller atomic radius of Cr atom.
The optimised structure of cis isomer has a C2v symmetry point group whereas the optimised structure of trans isomer adopts D4h symmetry point group.
| Table 4.2.3 - Energies of Cis and Trans [Mo(CO)4(PCl3)2] Isomers | |||
|---|---|---|---|
| Isomer | Energy / Eh | Energy / kJ mol-1 | |
| Cis- | -623.5425 | -1637110.8337 | |
| Trans | -623.5760 | -1637198.7883 | |
- 1 Hartree a.u =2625.5kJ mol-1**
The simulation of cis- and trans- Mo complexes suggest that the trans isomer is the more stable isomer by an energy of about ~88kJ mol-1 and this is supported by the literature[5]. One possible reason for cis isomer to be less stable is the steric clashes arise from cis- PCl3 group which destabilise the complex.
Frequency Analysis of Cis and Trans Mo complexes
To calculate the vibrational data of both cis and trans Mo complex, the following input are used:
Job type: Frequency
The method: DFT - B3LYP
The basis set: LANL2DZ
Additional keywords: int=ultrafine scf=conver=9
The results for both cis and trans frequency output log file can be found here:
Cis Freq. Output Trans Freq. Output
| Table 4.3.1- Vibrations of Cis-Mo Complex | ||||
|---|---|---|---|---|
| No. | Vibration | Frequency/cm-1 | Intensity | Symmetry C2v point group |
| 42 | 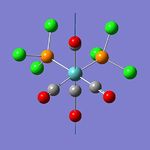 |
1806.20 | 880.4710 | b2 |
| 43 | 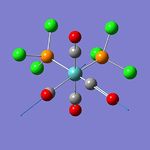 |
1807.25 | 1114.8372 | b1 |
| 44 | 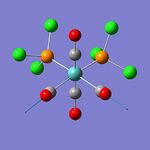 |
1816.58 | 565.9930 | a1 |
| 45 | 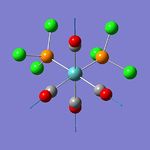 |
1873.40 | 665.8343 | a1 |
| Table 4.3.2- Vibrations of Trans-Mo Complex | ||||
|---|---|---|---|---|
| No. | Vibration | Frequency/cm-1 | Intensity | Symmetry D4h point group |
| 42 | 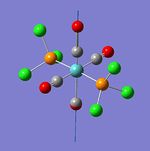 |
1950.47 | 1475.3453 | eu |
| 43 | 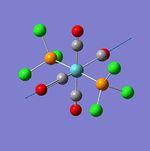 |
1951.10 | 1466.8207 | eu |
| 44 | 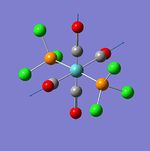 |
1977.38 | 0.6767 | a1g |
| 45 | 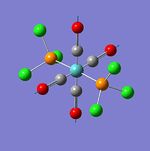 |
2031.16 | 3.7837 | a1g |
 |
 |
 |
 |
| Vibration | Calculated Freq / cm-1 | Intensity | Literature Freq / cm-1 [6] |
|---|---|---|---|
| 42 | 1806.20 | 880.4710 | 1867 |
| 43 | 1807.25 | 1114.8372 | 1896 |
| 44 | 1816.58 | 565.9930 | 1924 |
| 45 | 1873.40 | 665.8343 | 2026 |
| Vibration | Calculated Freq / cm-1 | Intensity | Literature Freq / cm-1 [7] |
|---|---|---|---|
| 42 | 1950.47 | 1475.3453 | 1896 |
| 43 | 1951.10 | 1114.8372 | 1896 |
| 44 | 1977.38 | 0.6767 | - |
| 45 | 2031.16 | 3.7837 | - |
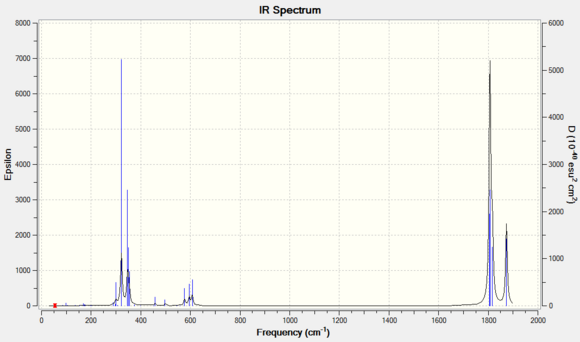
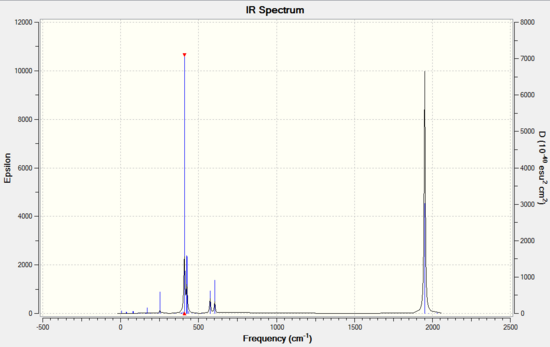
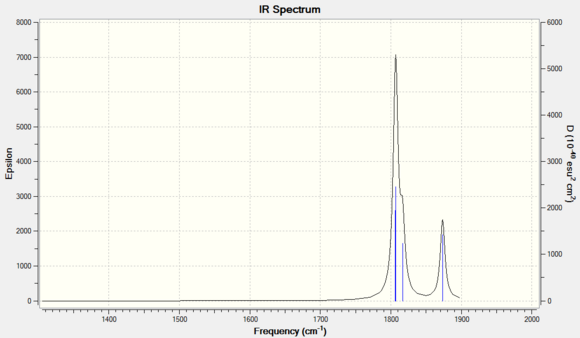
Cis isomer is expected to observe more IR active vibrational modes than the trans isomer as the geometric structure of trans isomer is of higher symmetry. This coheres with what is observed on the simulated IR spectra, where the cis-IR spectrum has two distinct peaks, one of which contains three vibration modes(mode 42-43) and the other peak corresponds to vibration mode 45. These vibrational modes generate a significant amount of intensity and hence visible on the spectrum. However, the calculated frequencies do not cohere with the literature value that well with increasing vibration mode. This is likely due to the literature used is frequency based on PPh3 ligands instead of PCl3 ligands.
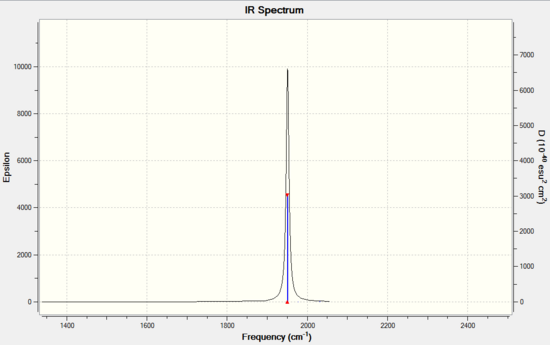
For the C=O stretch region of trans isomer, the calculated vibration frequencies is in relatively good agreement with that of literature's, with the values deviates by ~ 50cm-1. This discrepancy may again attribute to the substitution of Cl group for the phenyl group and hence causes the downshift of IR frequencies. Also, there is no literature reported for vibration mode 44 and 45. The intensity reported by the calculated frequencies are small and effectively not visible on an IR spectrum.
Mini Project: Study of Sn5 metal clusters with different geometric structures
Introduction
Metal clusters have received considerable attention in recent years both theoretically and experimentally. The use of macrocyclic polyethers as the reagent makes crystallising small metal clusters such as Sn5 possible and these clusters are found to share some similar properties with boranes such as bonding and structural prediction. For metal clusters, it is commonly observed that one contains both 2-centre-2-electron bonds and 3-centre-2-electron bonds and its geometric structure can be predicted b Wade's Rules.
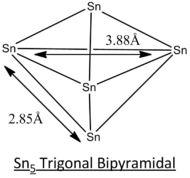
In this project, different geometric structures of Sn5 clusters are studied and determined the most stable structure by computational means. Out of 7 different possible structures as listed in the literature[8], 3 selected geometric structures, tetragonal pyramidal, trigonal bipyramidal and square planar as displayed below, will be studied in greater detail.
| Sn5 Tetragonal Pyramidal | Sn5 Trigonal Bipyramidal | Sn5 Square Planar | |||||||||
|---|---|---|---|---|---|---|---|---|---|---|---|
|
|
|
**Due to limitation of Gaussview, the bonds between Sn atoms in tetragonal pyramidal structure and square planar structure exist but they are not shown in the model.**
Sn5 Metal Cluster Optimisation
Edit >>>Point Group >>> Enable point group symmetry >>> constrain point group to D3h >>> increase the tolerance to very tight (0.0001)
Job type: Optimisation
The method: DFT - B3LYP
The basis set: LANL2DZ
| Geometric Structure of Sn5 clusters | Tetragonal Pyramidal | Trigonal Bipyramidal | Square Planar |
| Symmetry | C4v | D3h | D4h |
| Energy /Hartree a.u | -16.9132 | -16.9487 | -16.9044 |
| Dipole Moment/Debye | 0.5907 | 0.0005 | 0.0003 |
| Simulated Bond Length | 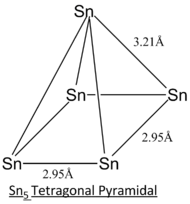 |
 |
 |
| Literature Bond Length | 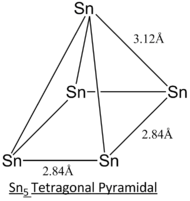 |
 |
 |
| Optimisation Log File | Opt. Tetra. Pyr. Log File | Opt. Tri.Bipyramidal log file | Opt. Square Planar log file |
The calculation method employed in the literature[8] of CASSCF is a more complex and accurate method of modelling. Generally, the simulated bond lengths of all 3 different structures deviate from that of literature's by ~0.10 Angstroms. This consistent deviation can be regarded as consistent inaccuracy arise from the computational method.
From the optimisation data, the trigonal bipyramidal structure is reported to have the lowest energy and hence will be expected to be the most stable geometry at ground state. This calculation is supported by the literature[8] but may not be the case for some excited states since the geometry optimisation is symmetry-constrained.
Vibrational Analysis of Sn5 metal clusters
For further vibrational analysis, tetragonal pyramidal and trigonal bipyramidal of Sn5 structures are employed and the input commands are as follows:
Job type: Frequency
The method: DFT - B3LYP
The basis set: LANL2DZ
Additional words:int=ultrafine scf=conver=9
The frequency output log file can be found here:
Tetragonal Pyramidal Freq. Output Trigonal Bipyramidal Freq. Output
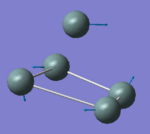
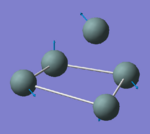
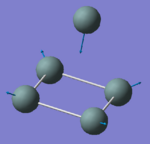
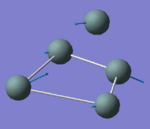
| Table 5.2.1- Vibrations of Tetragonal Pyramidal structure of Sn5 metal cluster | |||
|---|---|---|---|
| Vibration | Frequency / cm-1 | Infrared | Symmetry C4v point group |
 |
-112.46 | 0.0000 | A1 |
 |
63.67 | 0.0000 | E |
 |
68.08 | 0.0002 | E |
 |
68.08 | 0.0002 | E |
 |
108.03 | 0.1324 | A1 |
 |
132.26 | 1.1555 | A1 |
 |
132.26 | 1.1555 | A1 |
 |
132.34 | 0.0000 | A2 |
 |
146.68 | 0.4542 | E' |
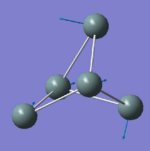
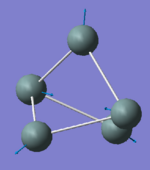
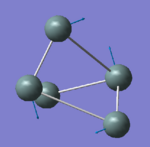
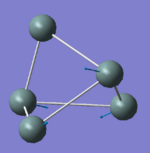
| Table 5.2.2- Vibrations of Trigonal Bipyramidal structure of Sn5 metal cluster | |||
|---|---|---|---|
| Vibration | Frequency / cm-1 | Infrared | Symmetry D3h point group |
 |
59.52 | 0.0020 | E |
 |
59.57 | 0.0020 | E' |
 |
82.25 | 0.0000 | A1' |
 |
112.67 | 0.0002 | E' |
 |
112.73 | 0.0000 | E' |
 |
121.95 | 0.1356 | A1'' |
 |
152.73 | 2.7726 | E |
 |
152.77 | 2.7772 | E' |
 |
158.77 | 0.0000 | E' |
 |
 |
Results and Analysis of Sn5 clusters
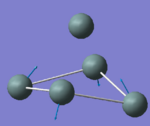
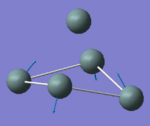
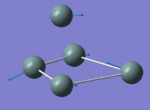
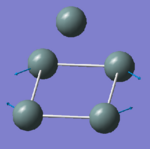
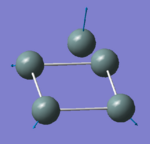
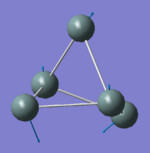
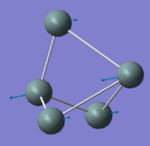
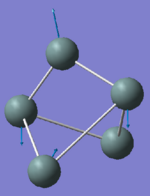
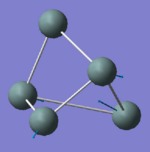
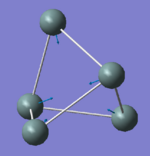
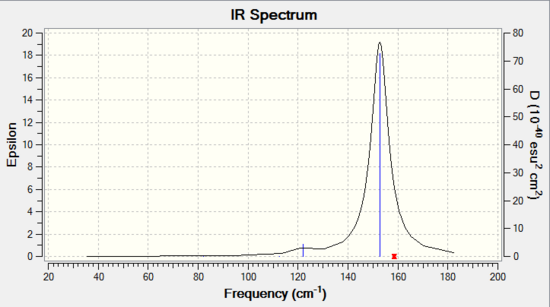
Both tetragonal pyramidal and trigonal bipyramidal structures of Sn5 employ highly symmetrical structure of C4v and D3h. As such, most of their vibrational modes are invisible due to dipole moments cancel out each other in vibrations and therefore only few modes are IR active. For tetragonal pyramidal IR spectrum, 4 vibrational modes and 3 peaks were observed at 108.03cm-1, doubly degenerate peak at 132.26cm-1 and singly degenerate peak at 146.68 cm-1. Whereas for trigonal bipyramidal IR spectrum , only 1 distinct vibrational mode was observed at 152.77cm-1.
The fewer vibrational modes of Sn5 trigonal bipyramidal structure indicates that it is geometrically more symmetrical than that of tetragonal pyramidal structure. With higher symmetry in a molecule, it is expected to be more stable and this supports with the optimisation data that trigonal bipyramidal structure is the most stable Sn5 structure at ground state.
Reference
- ↑ Michael S. Schuurman, Wesley D. Allen, Henry F. Schaefer III. DOI:10.1002/jcc.20238
- ↑ J. Glaser, G. Johansson, Acta Chemica Scandinavica A, 1982, 36, 122 - 135 DOI:10.3891/acta.chem.scand.36a-0125
- ↑ D. J. Darensbourg, R. L. Kump, Inorg. Chem., 1978, 17, 2680-2682. DOI:10.1021/ic50187a062
- ↑ 4.0 4.1 D. W. Bennett, T. A. Siddiquee, D. T. Haworth, S. E. Kabir, F. K. Camellia, J. Chem. Crys., 2004, 34, 353-359.DOI:10.1023/B:JOCC.0000028667.12964.28
- ↑ D. J. Darensbourg, R. L. Kump, Inorg. Chem., 1978, 17, 2680-2682. DOI:10.1021/ic50187a062
- ↑ J. Shamir, A. Givan, M. Ardon, G. Ashkenazi, Journal of Raman Spectroscopy, 1993, 24, 101-103 (DOI:10.1002/jrs.1250240208 )
- ↑ J. Shamir, A. Givan, M. Ardon, G. Ashkenazi, Journal of Raman Spectroscopy, 1993, 24, 101-103 (DOI:10.1002/jrs.1250240208 )
- ↑ 8.0 8.1 8.2 Dingguo Dai, K. Balasubramanian,J. Phys. Chem., 1996, 100 (50), pp 19321–19325. DOI:10.1021/jp9625218

