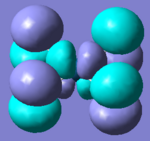
Rep:Mod2:bhheller
Module 2: Inorganic Computational Chemistry Lab
Computational chemistry gives us insight into the structure and bonding of complexes, it is especially important for inorganic compounds as the bonding is often pretty complex. Computational studies can be used to compare the energies of stable conformers and identify transition states that are difficult to see experimentally or spectroscopically.
The following project involves a series of experiments to probe the possibilities of computational chemisrty for investigation bonding and reactions in some inorganic molecules.
Small (D3h) Molecules
Borane - BH3
The molecule was drawn in GaussView and then an optimisation was run on BH3 using the B3LYP method and 3-21G basis set. The results are shown in the table to the left.
| Bond length | 1.19Å |
| Bond Angle | 120.0o |
| Energy | -26.46353 a.u. (-69,480 kj/mol) |
The summary file gives the following information about the optimisation; the calculation type is FOPT, the file type is .log, the calculation method is RB3LYP, the basis set is 3-21G, the dipole moment is 0.00 Debye and the gradient is 0.00000285 a.u. which is less than 0.001 a.u. meaning the optimisation was a success in that the energy is at a stationary point. This was also confirmed by the output file as the part below "Item" said that the forces had converged. A study of the frequency analysis tells us that the energy is at a minima as all the low frequency vibrations are positive.
The published population can be found here.
Molecular Orbitals of Borane
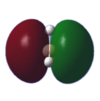
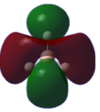
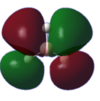
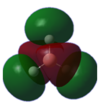
One of the very useful aspects of carrying out calculations is that the electronic structure is solved and we obtain the MOs. These are the quantitative or computed MOs which we can compare to the qualitative or approximate MOs produced via MO diagrams.
| MO | 1a1' | 2a1' | 1e' | 1e' | 1a2" | 2e' | 2e' | 3a1' |
| LCAO representation |  |
 |
 |
|||||
| GaussView picture |  |
 |
 |
 |
 |
 |
 |
|
| Energy | -6.73049 | -0.5176 | -0.35681 | -0.35681 | -0.07458 | 0.18859 | 0.18859 | 0.19192 |
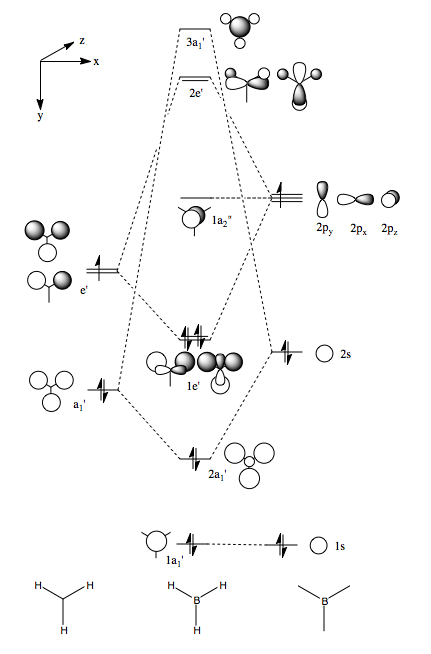
There is a good correlation between the qualitative LCAO MOs and the calculated quantitative MOs. However, to get an accurate LCAO representation the contributions of each atomic orbital must be taken into account and to accurately get the contributions of each a quantitative calculation must be run. The qualitative approach gives a good idea of the MOs but is limited in it's worth.
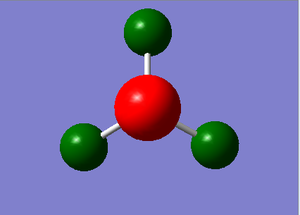
The NBO (natural bond orbital) is run to give a localised representation of the charge distribution of the molecular orbitals. The log file tells us that the total charge is equal to zero which is as expected for a neutral molecule. It also tells us that the hydrogens all have the same negative value (-0.110) which is as expected given the symmetry and the electropositive boron centre. It also gives information on the orbital make up of the charge density which can be interpreted to give a representation of the hybridisation. The three bonding orbitals of the boron atom have a 33.3% contribution from the s-orbital and 66.6% from the p-orbitals suggesting that the boron is sp2 hybridised. The boron hybrid orbitals contribute 44.5% of the B-H bond and the hydrogen s-orbital makes up the rest so the bonds are slightly distorted towards the hydrogen, in agreement with the charge distribution above.
Vibrations of Borane
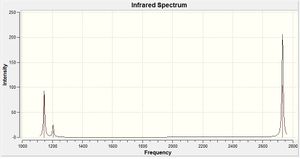
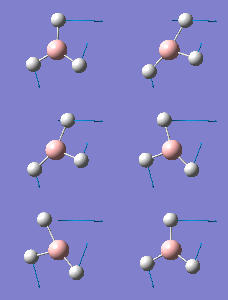
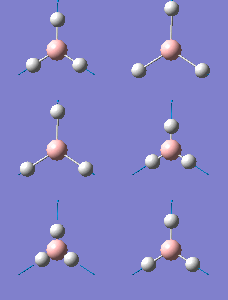
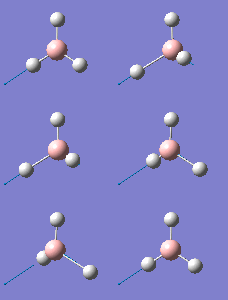
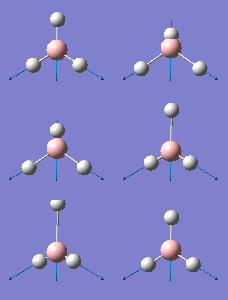
As BH3 is a non-linear molecule it is expected to have 3N-6 = 6 vibration modes, which is what is obtained above. However, there are only three peaks on the IR spectrum. This is due to the fact that there are two pairs of degenerate vibrations (at 1186.21 and 2834.38cm-1) and another is not IR active (at 2687.50cm-1) and so it's intensity is zero. A non-IR active vibration is a symmetric vibration where there is no change in dipole moment during the vibration.
Thallium Bromide - TlBr3
The optimisation was run using the calculation method DFT-B3LYP with the basis set LANL2DZ. The symmetry of the thallium (III) bromide was very tightly restricted to the D3h point group so that the optimisation would produce a molecule with very good D3h symmetry.
The optimisation returned a molecule that had converged and with gradient 0.0000009a.u. suggesting it was a success. The bond length (2.65Å) showed good correlation to the literature (2.5153Å[1]) further indicating it had successfully optimised. The difference is probably due to the fact that the basis set used is not perfect. The bond angles were also 120.0o.
The input and output files for this optimisation are linked below:
To confirm that a molecule is at a minimum a frequency analysis must be run. One must use the same basis set for the frequency analysis calculation as was used for the optimisation calculation. this is because the frequency analysis is effectively the second derivative of the curve of potential energy and so if the basis set is changed so too will the potential energy curve and so the two results could not be compared to one another.
The input and output files for this optimisation are linked below:
Each molecule is optimised to find it's lowest energy, ground state conformation. The optimisation calculation involves continuously adjusting the parameters of the molecule until the first derivative of the potential energy goes to zero. However, this only gives a stationary point on the energy curve and so this point may either be a maximum, meaning a transition state, or a minimum, meaning to ground state. The frequency analysis is essentially the second derivative of potential energy. If all the vibrational frequencies of the molecule are positive the the potential energy is at a minimum and so the optimised structure is the ground state. If one of the frequencies is negative, the potential energy is at a maximum and so the molecule is at a transition state. If more than one frequency is negative the optimisation has failed and not found a turning point. Hence, frequency analysis is necessary to determine whether or not the optimised structure is actually in it's ground state.
The low frequencies are those that correspond to the vibrations of the centre of mass of the molecule. For this optimisation they were -3.4226, -0.0026, -0.0004, 0.0015, 3.9361, 3.9361 close to zero or positive and much lower than the lowest real normal mode which was 46.4288. This confirms the calculation has found a minimum energy and was successful.
A bond is a force of attraction between two or more atoms which results in a more stable arrangement that the free atoms and the result of the optimisation calculation can sometimes come back with bonds that appear to be missing, as with the P-Cl bonds in the molybdenum complexes later. This is because Gaussview contains pre-programmed parameters for electronic interactions for each type of bond and when any two bonded atoms exceed these parameters the atoms are not considered to be bonded and so the bonds are not drawn but they are still there, as can be seen in the vibrational analysis. This is an especially frequent occurrence in inorganic compounds as the database's bond lengths are based mainly on organic compounds.
Geometric Isomers of Mo(CO)4L2
Computational modelling can be used to examine the vibrational spectra of the isomers of Mo(CO)4L2 where L=PPh3. However, calculating the full molecule would take too long, so the phenyl rings have been replaced with the less computationally demanding Cl atoms, these have been shown to have a similar electronic contribution to the bonding as phenyl groups, and they are sterically quite large.
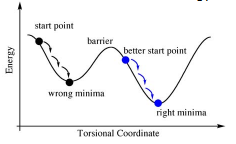
Different starting points were used to ensure that the minimum optimisation achieved was in fact the global minimum. If the wrong starting point is chosen one might not get the required minimum as shown in the diagram to the right. The two complexes were manipulated by hand to set parameters to give the minimums. For the cis conformer one Cl aligns up parallel to the axial bond and one Cl of the other group aligns down. For the trans conformer, both PCl3 groups are eclipsed with one Cl of each parallel to a Mo-C bond.
These molecules were then optimised using the B3YLP method and a LANL2MB basis set, the geometry was then altered as above and they were optimised further using the more complex LANL2DZ basis set. The DZ stands for double zeta and is a much better basis set and pseudo-potential than the MB or minimal basis option.
The published file for the optimisation of the trans complex can be found here and the cis complex here.
| Trans Isomer | Cis Isomer | ||||||
|---|---|---|---|---|---|---|---|
|
|
The complexes were further optimised onece more as the phosphorous atom still has only a minimal basis only including it's valence s and p orbital functions. So the further optimisation took into account the phosporus' low lying dAOs. Using the optimised complexes the geometries were investigated and the results are below;
| cis[2] | trans[3] | |||
|---|---|---|---|---|
| Bond lengths/Å | calculated | literature | calculated | literature |
| Mo-P | 2.48 | 2.58 | 2.42 | 2.50 |
| equatorial Mo-C | 2.02 | 1.97 | 2.06 | 2.01 |
| axial Mo-C | 2.05 | 2.06 | ||
| eclipsed P-Cl | 2.11 | 2.12 | ||
| non-eclipsed P-Cl | 2.12 |
These literature values are for a PPh3 ligand rather than a PCl3 which are more bulky and so might explain the longer literature bond lengths for the Mo-P bond. This difference is more pronounced in the cis-isomer as there is a large amount of steric clash between the two PPh3 ligands and a longer bond reduces this clash. The fact that the PPh3 ligands are further away form the Mo centre means the C-Mo bonds are shorter that in the calculated molecule. Again the difference is greater in the cis-complex. The C=O bond is 1.17Å the same in both complexes and the literature.
The cis P-Mo-P bond angle was 94.3o[2] and the trans angle was 176.7o[3]. According to literature the cis angle is 104.5o, but, this is for a PPh3 ligand which is larger and occupies more space and so will distort this angle. Owing to the fact that the PCl3 ligands are bulky the equatorial C-Mo-C angle is 87.0o, less than 90o as the carbonyl ligands are pushed together to accommodate the PCl3 ligands. The axial C-Mo-C angle is 89.9o, much closer to 90o as there is no steric effects. As are the axial C-Mo-C angles in the trans-complex (89.2 and 90.8o) for the same reasons.
The free energies of the two complexes are as follows; cis isomer: -623.69291a.u. (-1637505kj/mol). trans: -623.69416a.u. (-1637509kj/mol). It can be seen that the trans-isomer is the more stable isomer by 0.00125a.u. (about 4kj/mol). In fact if the error is taken into account both isomer have energy of -1637510kj/mol. This difference is difference and both isomers tend to be observed at room temperature. This is due to fact that the chlorine is "bulky" and if the two PCl3 ligands are cis to one another there will be some steric repulsion and so favour the trans position.
The nature of the PR3 can be changed most substantially in two ways; changing it's size (different sized "R" groups) or changing it's electronic properties through the introduction of groups with strong electronic effects such as resonance or inductive withdrawing or donating effects. These changes will effect the relative ordering in the stability of the two complexes and will effect their catalytic behaviour. Computational chemistry can be used to model this behaviour and can hence be used to "fine-tune" the catalytic behaviour.
When R=Me we get the cis and trans complexes of Mo(CO)4(PMe3)2 and according to the literature[4] the trans isomer becomes more stable and the cis isomer will thermally rearrange completely to the trans isomer. The larger the "R" groups the more the complex will favour the trans isomer so the "bulky" ligands are more separated and so the trans isomer becomes more stable relative to the cis isomer.
A frequency analysis was also run using the same method and basis set as above. The published file for the frequency analysis of the trans complex can be found here and the cis complex here. The tabulated IR spectra of the two complexes are shown below:
| Frequency (cm-1) | Intensity | Type | |
|---|---|---|---|
| Trans | 434.55 | 801 | Symmetric Mo-P stretch |
| 577.96 | trans pair C=O bends | ||
| 578.33 | trans pair C=O bends | ||
| 610.17 | all 4 C=O bends | ||
| 1939.17 | 1606 | trans pair C=O asymmetric stretches | |
| 1939.88 | 1606 | trans pair C=O asymmetric stretches | |
| 1966.83 | 6 | all 4 C=O asymmetric stretches | |
| 2025.48 | 5 | all 4 C=O symmetric stretches | |
| Cis | 443.43 | 335 | Asymmetric Mo-P stretch |
| 483.10 | 251 | Symmetric Mo-P stretch | |
| 567.06 | 114 | Axial C=O bends | |
| 586.31 | 109 | Equatorial C=O bends | |
| 600.03 | 113 | All C=O bends | |
| 1938.07 | 1605 | cis pair C=O asymmetric stretches | |
| 1941.50 | 813 | trans pair C=O asymmetric stretches | |
| 1952.35 | 588 | all 4 C=O asymmetric stretches | |
| 2019.12 | 545 | all 4 C=O symmetric stretches |


The number of active C=O vibrational bands is related to the symmetry of the complex, four carbonyl absorption bands are expected from the compound with cis ligands and only one band is expected from the compound with trans ligands. There are four stretching frequencies for the carbonyl ligands at 1900-2000cm-1 for each complexes. However, only two are of high intensity for the trans ligand and they are almost degenerate so there is only one peak in the spectrum, as expected given the symmetrical nature of the complex. All four C=O stretches have high intensity in the cis complex and are all at different frequencies so there are four peaks in the spectrum. According to the literature the peaks for the cis ligand are at 1867, 1896, 1924, and 2026cm-1 and at 1889cm-1 for the trans complex[5] These values are however, for a PPh3 ligand.
The vibrational frequency of an uncoordinated C=O bond is 2143cm-1 whereas a coordinated carbonyl is lower due to synergic bonding (backbonding). Donation of electron density from the metal d-orbital to the C=O π* antibonding orbital weakens the bond and lowers it's stretching frequency. The carbonyls in the trans isomer are all in the same environment and so experience the same amount of backdonation and as a result the stretches for the two trans pairs are the same, 1939cm-1. The carbonyl ligands in the cis complex are in different environments, two axial and two equatorial, and so the amount of backdonation varies.
| Animation | Frequency (cm-1) | |
|---|---|---|
| trans | 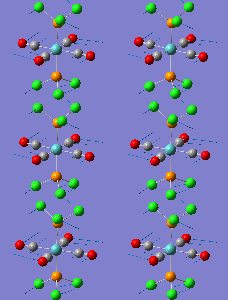 |
5 |
 |
7 | |
| cis | 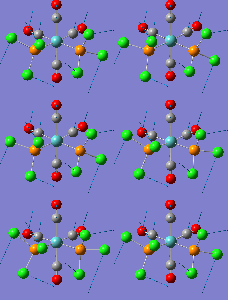 |
12 |
 |
20 |
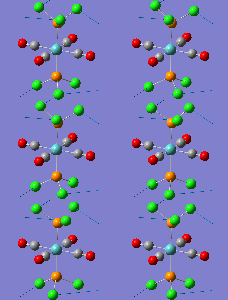
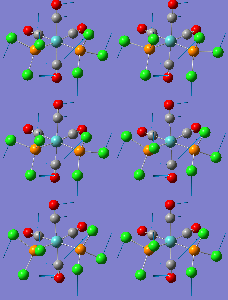
All of these four vibrations are the rotation of the PCl3 ligand about the Mo-P bond. This happens as the amount of energy required to rotate a bond is very small compared with a stretching or bending motion and so the ground state vibrational levels for these modes are significantly depopulated at room temperature[6]. These vibrational potentials are also anharmonic, and therefore, the spacing between adjacent energy levels decreases for higher energy vibrational states. This anharmonicity results in temperature dependence of the frequency shifts.
Mini Project: Chloroplatinum Complexes
Like a lot of Pt(IV), the metal centre prefers to adopt an octahedral coordination geometry in a polymeric structure where half of the chloride ligands bridge between the platinum centres. However, in the monomeric form PtCl4 can adopt two different structures; tetrahedral or square planar. Computational modelling can be used to determine the relative stabilities of these two conformers. The optimisation calculations were run using the RB3LYP method and the complex LANL2DZ basis set with the keyword "nosymm" to allow them to converge properly. The two optimised conformers are shown below.
| Tetrahedral conformer | Square planar conformer | ||||||
|---|---|---|---|---|---|---|---|
|
|
It can be seen that both neither conformer retains it's high symmetry, both distort to reduce this. This is probably due to the pseudo Jahn-Teller effect discussed earlier. The distortion is most notable in the tetrahedral molecule where the Td symmetry has been lost completely and the molecule now belongs to the C1 point group. The square planar molecule now has D2h symmetry with two different Cl-P-Cl bond angles of 89.9o and 90.1o.

The tetrahedral conformer is the most stable of the two with a free energy of -178.93886a.u. (-469,804kj/mol) compared to -178.93276a.u. (-469,788kj/mol) for the square planar complex. This suggests that the molecule will exist in this C1 form and the square planar form is a higher energy intermediate complex.
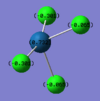

NBO analysis can give us information about the bonding within the complexes. For the square planar complex the platinum bonding orbital are made up of 24.15% s-orbital, 50.00% p-orbital and 25.85% d-orbital, suggesting sp2d hybridisation. The situation is different for the tetrahedra complex as there are two different types of platinum bonding orbitals. One made up of 33.24% s-orbital, 3.41% p-orbital and 63.35% d-orbital, suggesting sd2 hybridisation and another made up of 14.88% s-orbital, 49.99% p-orbital and 35.13% d-orbital, suggesting sp3d2 hybridisation. This is reflected in the bond lengths as there are two different lengths of 2.38Å and 2.33Å. The shorter length will be due to the sp3d2 hybrid orbital.
The charge distribution is as expected, with the greatest electron density and hence, negative charge on the electronegative chlorine atoms and the overall charge zero. The chlorine atoms in the C1 are not equivalent as was seen in the hybridisation.
A comparison of selected molecular orbitals of the two geometries is shown in the table below:
Platinum (IV) chloride decomposes to give platinum (II) chloride and chlorine gas in the following reaction:
- PtCl4 ↔ PtCl2 + Cl2
Computational modelling can tell us the favoured direction of this equilibrium and whether or not it is spontaneous. Optimisation of a chlorine molecule and platinum (II) chloride yields the following results:
Energy of Cl2: -29.84308a.u. (-78,353kj/mol)
Energy of PtCl2: -149.02875a.u. (-391,275kj/mol)
The total energy for that side of the equilibrium is therefore -469,628kj/mol compared with -469,804kj/mol for the most stable PtCl4 giving a ΔE = 176kj/mol, suggesting that the decomposition is non-spontaneous and would need to be driven to completion.
A further investigation to analyse the molecule can be done by replacing the chlorine atoms with bromine atoms can be done to investigate whether or not there are any differences. The calculations were run in the same way, using the same basis set so a comparison can be made.
The energies of the conformers follow the same trend as with the chloride molecules where the tetrahedral conformer has free energy -171.85068a.u. (-451194kj/mol) and the square planar has -171.84116a.u. (-451169kj/mol). The energies are larger than with the chloride complexes most likely due to the fact that bromine is a larger and less st able complex and the Pt-Cl bonds are stronger and more stable.
Both these bromide conformers belong to the low symmetry C1 point group. This could be due to a greater Jahn-Teller effect trying to reduce the energies by reducing the symmetry. It could also be because with the larger bromine atoms there is greater potential for steric clash, so the complexes distort more to reduce this clash.
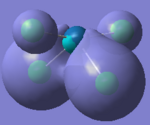
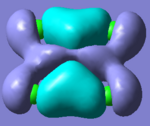
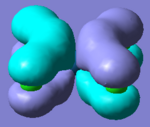
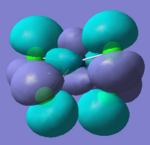
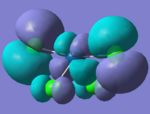
The molecular orbitals can also be compared and below is a comparison of the HOMO orbitals of the the two tetrahedral based molecules.
| PtCl4 | PtBr4 | ||
|---|---|---|---|
 |
number 43 of energy -0.322 | 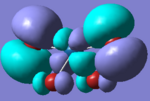 |
number 79 or energy -0.293 |
These orbitals are equivalent as both are an antibonding interaction between orthogonal Cl p-orbitals with the Pt d-orbital.
In conclusion molecular modelling is a very useful way of predicting and analysing molecules and their reactions and as a result these two isomers can be easily distinguished using said techniques. However one must aware of the limitations of each basis set and using the right basis set for a molecule.
The Quantum Nature of Ammonia
A low potential barrier exists between two the inverted structures of ammonia, this processes is achieved by the hydrogen atoms quantum tunnelling from one side of the nitrogen atom to the other. This purely quantum phenomenon causes "inversion doubling" of the vibrational modes of ammonia. The ammonium molecule can thus be used as a quantum information unit. The ammonia molecule flips between it's two states or structures many times a second. However a linear combination of these two states forms a "stationary state". The two physical states form "+" and "-" stationary states.
Initially, three forms of NH3 which have point groups C1, C3v and D3h were investigated. These three geometries are related to one-another as C1 is a sub-group of C3v which in turn is a sub-group of D3h.
The optimisation process involves cycles in which individual atoms are moved and the symmetry recalculated. The more symmetrical the molecule the shorter the time it takes to optimise there are fewer position into which the atoms can be moved whilst preserving the symmetry. Guassian will not "break" the symmetry of the molecule, this has to be done manually by altering bond lengths or angles. The first set of molecules were optimised using the B3LYP method and 6-31G basis set. A dummy atom was used in the optimisation of the D3h molecule.
The more symmetrical a molecule the greater it's energy and so as expected the C1 molecule has the lowest energy ( ), followed by the C3v ( ) and then the D3h ( ). The energy differences are due to these differences in symmetry. The C1 molecule has the lowest energy as it's symmetry was broken prior to optimisation by lengthening one of the N-H bonds. The D3h molecule is stabilised by the pseudo-Jahn-Teller (pseudo-JT) effect (also termed the second-order Jahn-Teller effect). The energy of the higher symmetry geometry is lowered by a distortion along a non-totally symmetric normal coordinate. Effectively, the D3h molecule is a transition state on the potential energy curve rather than the C3v which is a local minimum. According to the pseudo-JT effect, this is caused by an interaction between ground and nearby excited states (with appropriate symmetries) of the molecule[7].
The C3v and D3h molecules were then optimised using the more comprehensive and complex 6-311G basis set with the MP2 method. This includes all electrons and takes into account their dynamic positions. From these results one can investigate the inversion process. Vibrational analysis reveals that the D3h molecule has a negative frequency vibration signifying a higher energy transition state as previously discussed. This vibration has a corresponding vibrational mode in the C3v molecule and follows the inversion reaction path.
There is a greater energy difference between the D3h and C3v with this more complex (and accurate) calculation, 0.0099a.u. (26kj/mol) which is much closer to the value from the experimental literature of 24.3kJ/mol. This is quite a large difference and suggests that there must in fact be a large energy barrier between these conformers and so their conversion at room temperature is most likely not due to thermally induced vibrations. In fact, it is believed to be due to the phenomenon of quantum tunnelling which doesn't have to overcome that energy barrier.
References
- ↑ J. Glaser, G. Johansson. Acta Chemica Scandinavica A 36 (1982) 125-135[1]
- ↑ 2.0 2.1 F. Cotton, D. Darensbourg, S. Klein, B. Kolthammer. Inorg. Chem., 1982, 21 (4), pp 1651–1655[2]
- ↑ 3.0 3.1 G. Hogarth, T. Norman. Inorganica Chimica Acta. 254, (1), 1997. 167-171[3]
- ↑ D. J. Darensbourg, Inorg. Chem., 1979, 18, 14-17[4]
- ↑ J. Shamir, A. Givan, M. Ardon, G. Ashkenazi. Journal of Raman Spectroscopy, 24, 101-103. 1993[5]
- ↑ Y. C. Shen, P. C. Upadhya, E. H. Linfield. Appl. Phys. Lett., Vol. 82, No. 14, 7 April 2003[6]
- ↑ M. J. Bearpark, L. Blancafort and M. A. Robb, Molecular Physics. 2002, 100, 1735-1739[7]


