Rep:Mod2:asdfg
Modual 2: Inorganic chemistry
Day 1
Opptimising BCl3
BCl3 was drawn out in Gausse view and the geometory was optimised using DFT and B3LYP as the method and Lan2Mb as the basis set. The claculation was run and the opptimised structure produced.
BCl |
The opptimised BCl bond length was 1.86592 Å
The opptimised ClBCl bond angle was 120.000 degress
The output file was a .log file.
The calculation was a FOPT using RB3LYP as the method with the LANL2MB basis set. The final energy was -69.43928112 a.u was 0.000 debye for the dipole moment. The point group is D3H and the calculation took 11.0 seconds to run.
small molecule: H2SO4
For my small molecule I chose to use H2SO4. below is the final coordinates of the atoms in the molecule.
Center     Atomic     Atomic              Coordinates (Angstroms)
Number     Number      Type              X           Y           Z
---------------------------------------------------------------------
   1         16             0        0.222229    0.000000    0.000000
   2          8             0       -1.208526    1.327502   -0.011188
   3          1             0       -0.629810    2.188952   -0.016415
   4          8             0       -1.208527   -1.327501    0.011188
   5          1             0       -0.629811   -2.188951    0.016415
   6          8             0        1.065024    0.012879    1.501854
   7          8             0        1.065024   -0.012880   -1.501854
---------------------------------------------------------------------
The bond distances and angles are below
S=O bond distance 1.72222 Å S-O 1.95178 Å O-H 1.03780 Å O=S=O 121.4020 O-S-O 85.7140 O=S-O 111.0280 S-O-H 98.9650
The calculation method was the same as the BCl3, RB3LYP and LANL2MB. The final energy was -307.56174937 a.u., dipole moment was 0.1772 Debye and C1 symmetry. The calculation was ran for 2 minutes and 10 seconds.
H2SO4 |
BH3
opptimising BH3
Following the prodcedure given in the introduction exercise, BH<suv>3 was drawn using gausse view and opptimised. The results are below.
B-H bond distance = 1.19435 Å H-B-H bond angle = 120.0000 File type .log Calculation type FOPT Caclulation method RB3LYP Basis set 3-21G E(RB+HF-LYP) -26.46226438 a.u. RMS Gradient Norm 0.00000285 a.u. Dipole Moment 0.000 Debye Point Group D3H Job cpu time: 19.0 seconds
BH3 vibrational analysis
The opptimised output file was resaved as an input file. The calculation was set up as directed including the pop=full request.

| number | frequency | IR | point group | |
|---|---|---|---|---|
| 1 | 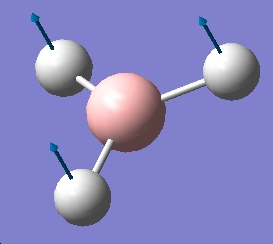 |
1145.71 | 92.6991 | A"1 |
| 2 |  |
1204.66 | 12.3789 | E' |
| 3 | 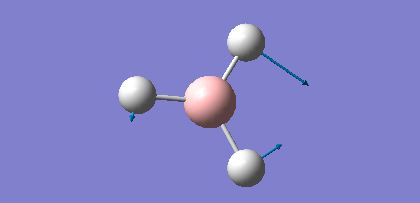 |
1204.66 | 12.3814 | E' |
| 4 | 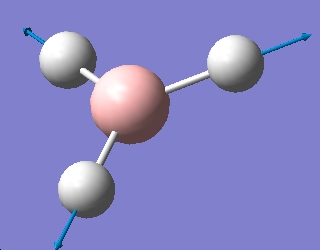 |
2592.79 | 0 | A'1 |
| 5 | 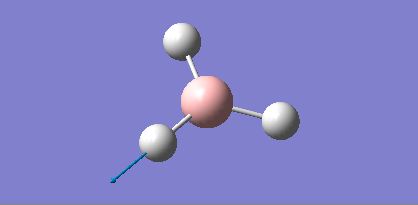 |
2731.31 | 103.837 | E' |
| 6 | 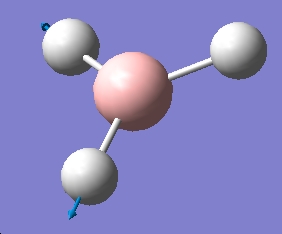 |
2731.31 | 103.83 | E' |
The reason for the IR only having 3 peaks despite having 6 vibrations. vibration 4 is a symmetric stretch, so does not change the diople moment, so is not IR active. Of the remaninder 2,3 and 4,6 are degenerate vibrations so produce a signal in the same place, hence ther greater magnitude.
Molecular orbital calculations for BH3
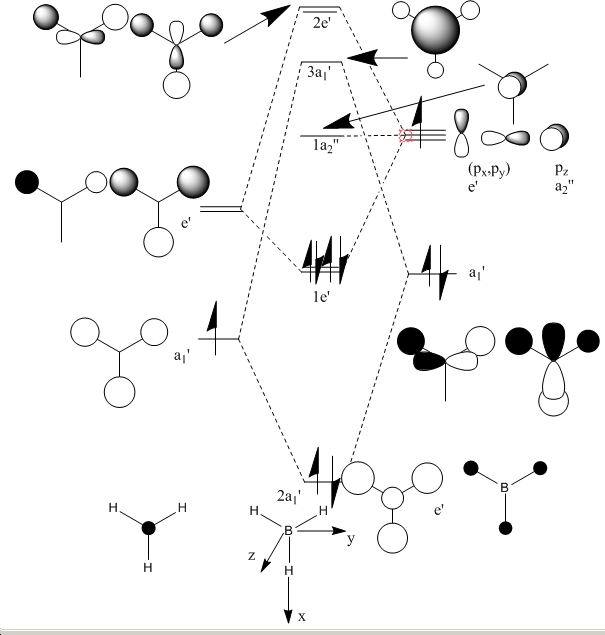
Below is my molecular orbital diagram for BH3
The MO input file was prepared as given, the first run did not produce the correct orbitals. Upon looking at the input file, one of the bond lengths and a bond angle had been changed slightly for one H, as a consiquence the symmertry was removed. This was due to rounding errors in Gaussian. This was corrected and the calculation re-run on the corrected input file. The MO's where visulised and screen grab pro used to take images of each one.
| number | calculated MO | ||
|---|---|---|---|
| 1 | 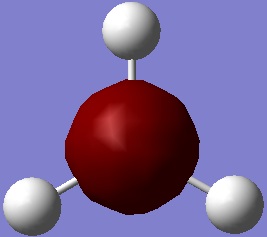
| ||
| 2 | 
| ||
| 3 | 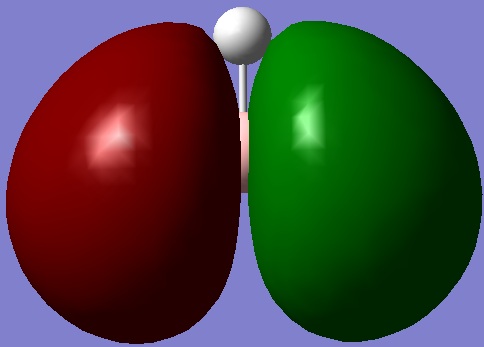
| ||
| 4 | 
| ||
| 5 | 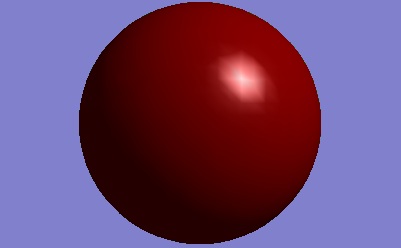
| ||
| 6 | 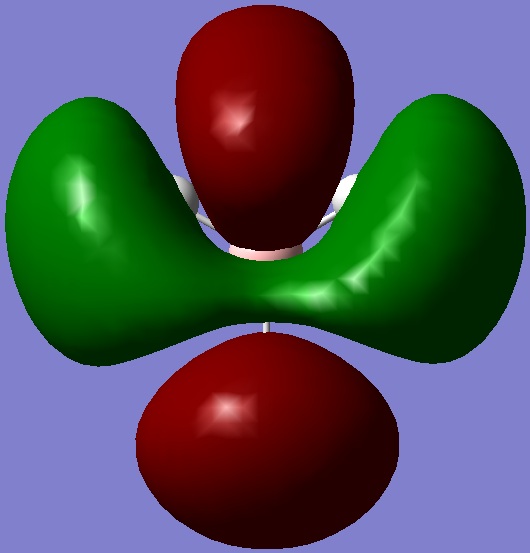
| ||
| 7 | 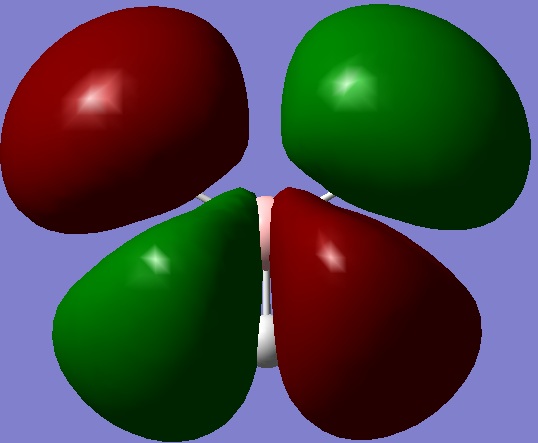
| ||
| 8 | 
|
When compared to the MO diagram the fit is actually very good, the orbital contribution to each one is visible in the computed MO's, the MO diagram does not give an idea about the space filling nature of the orbitals but does give a good approximation in this case. I could see qualitative MO diagrams working for small molecules, but larger molecules would be less accurate.
Day 2: Isomers of Mo(CO)4L2
I chose to look at the structure of Mo(CO)4L2 where L=PPh3, but to reduce computational time PMe3 would be used instead.
optimisation of cis and trans Mo(CO)4L2
Both the cis and trans isomers where drawn in gausse view and run with the B3LYP method and the basis set LANL2MB with opt=loose in the additional key words box. Both were submitted to scan. The trans isomer took 37 minutes to run and the cis isomer took 1 hour 28 minutes to run. When these had finished the output files where saved as input files and the gaussian calculation altered. The method was changed from LANL2DZ pseudo-potential and basis set. The opt=loose was repaced with int=ultrafine scf=conver=9. This was to maximise the accuaracy of the calculation. These where put on scan to run.
The final optimised structures are shown below.
Cis MO(CO)(PMe) |
Trans MO(CO)(PMe) |
The energies of the two strucutres are -773.356023716 a.u. for the cis isomer and -773.35729877 a.u. for the trans isomer. This is in reverse to the expected stability where the trans would be expected to be more stable. This indicates that the reduced steric demand of going from P(Ph)3 to P(Me)3 is enough to reduce the steric demand enough that the trans effect between CO and P(Me)3 is strong enough to overcome the steric clash. For the triphenyl phosphene complex the trans complex is entiraly favoured due to the increased steric demand which overcomes the trans effect. this is found in several papers[3]
IR analysis of cis and trans Mo(CO)4L2
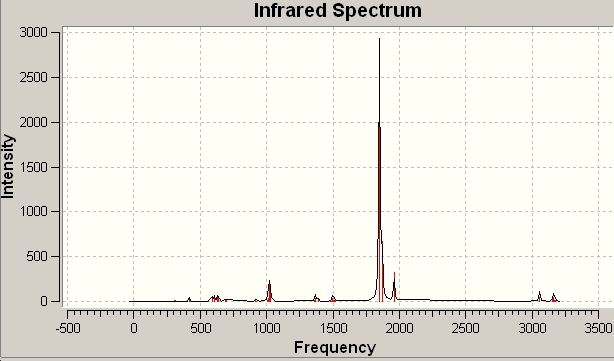
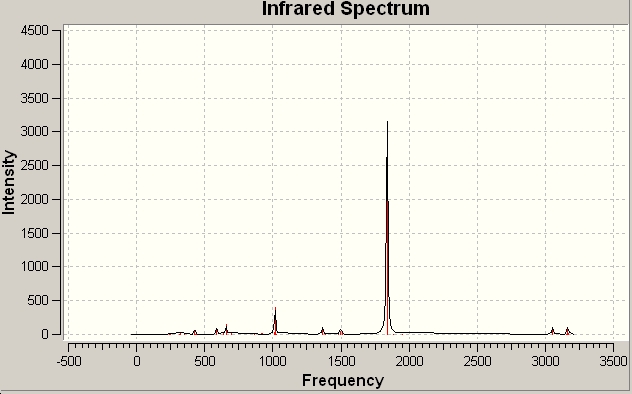
The frequency analysis was carried out on the opptimised structures using the frequencey analysis. When comparing the data I chose to look at the CO stretches as these are destinicteve at around 1800 cm-1. Below I will compare the two sets of CO frequencies obtained and the overall predicted IR spectra. All values are in frequencey (Hz)
| Cis[4] | Trans[5] |
|---|---|
| 1848.45 | 1838.57 |
| 1850.55 | 1838.81 |
| 1869.92 | 1882.27 |
| 1960.33 | 1954.04 |
There was no litriture values for the P(Me)3 complexes but I was a able to find some for cis complexes. the table below shows the results, it included P(Ph)3 complexes and P(Ph)(Me)2 complex. So by comparing the values I can decide if the calculated values are correct.
Both structures have a similar vibrational structure, but the peaks are slightly differnt, so with carefull analysis differentaion between the two isomers is possible.
Both frequencey analysis produced negative frequencies. In both cases these are due to errors in the calculations. The Cis isomer only has one negative frequency at -2.5166 Hz. This is within the error limmit of 10Hz, so could be a positive mode. Look at the vibrations reveals that it is one of the P(Me)3 groups rotating slightly. The reason for this mode exsisting is due to errors in the gaussian caclculation proccess. It also indicates that the structure may not be compleatly minimised, but is very close to minimisation. For the trans isomer there are two negative modes at -6.4113 and -2.66931 Hz. again these are so low in energy that they are negleable, small rotaions of the phosprouse groups.
Day 3: following a reaction parth, the quantum nature of ammonia
Symmetry and its impacts
ammonia
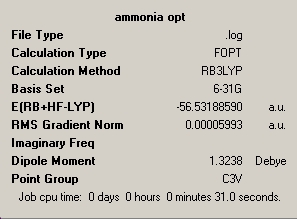
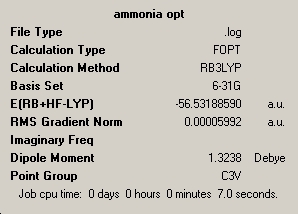
Ammonia was produced on Gausse view and optimised using 6-31G basis set and B3LYP method. The inital run did not fully optimise the molecule, so the calculation was run a second time. The reason was that at the end of the first run the displacement values where within the threshold, so the structure was at a minimum, but the force calculations had not reached there required values. This indicated that the potential energy surface is very flat in this regon. Both summary's are included below.
| optimisation 1 | optimisation 2 |
|---|---|
 |
|
distorted ammonia
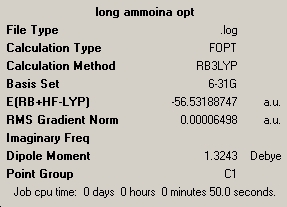
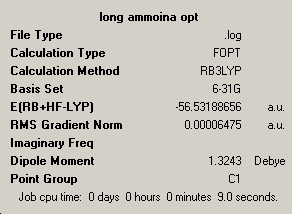
The next molecule was ammonia, but one of the bond lengths had been altred to 1.01Å. The same method and basis set was used as in the case above. again the calculation was run twice as the first run did not fully maximise the structure. Both symmarys are below.
| optimisation 1 | optimisation 2 |
|---|---|
 |
|
trigonal planner ammonia
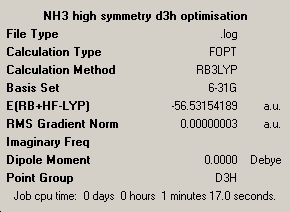
The required input file was down loaded off the web and saved as a gaussian input file. The calculation was run on the lap top and the symmary is shown below.
| optimisation 1 |
|---|
|
Comparison
Symmetry has made a significant difference to the structure obtained. The first case is a trigonal pyrimidal structure, the second is a distorted trigonaol pyrimidal and the final structure is trigonal planner. symmetry does have a significant effect on calculation time, the higher the symmetry the longer it takes to calculate the optimised structure. The basic ammonia took about 40 seconds and the planner ammonia took nearly 1 minute 20, so twice as long. For this case this is fine but for larger molecules, it could have significant effects as the caclulation would take far longer.
The energies of the three diffrent molecules are:
C3V ammonia -56.53188590 a.u. , -148424.466430450 KJ/mol C1 ammonia -56.53188656 a.u. , -148424.468163280 KJ/mol D3H ammonia -56.53154189 a.u. , -148423.563232195 KJ/mol
energy difference (KJ/mol) C3V and C1 = 0.00173283 C3V and D3H = 0.90319825 C1 and D3H = 0.90493108
The lowest energy structure is the C1 ammonia, which is not expected given it is the lowest symmetry. The differences between the energies is not significant between C3V and C1 as the difference in the structures is not very great. The difference between these two and the D3H ammonia is greater as the difference in structure is greater and the D3H structure is a transition state and so will be higher in energy.
Effect of using a better method
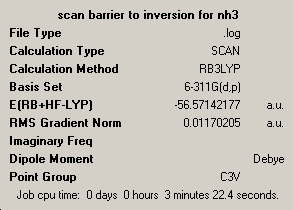
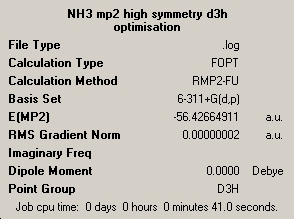
I this section I will look at the effect of changing the method on the accuracy of energy calculations for ammonia, and to gain an estimate of the energy barrier of inversion. The method uses was MP2 with the 6-11G+(d,p) basis set and chosing to look at all the electons. This was done for both pyrimidal ammonia and the planner transition state. screen shots of the symmary's are below.
| optimisation C3V | optimisation D3h |
|---|---|
 |
|
Vibrational analysis
Both sets of vibrational spectra where caclulated using the frequency analysis and the same method and basis set as had been used in the final optimisation.
| predicted IR spectrum | C3V frequencies |
|---|---|
 |

|
| predicted IR spectrum | D3H frequencies |
|---|---|
 |

|
For the regular C3V ammonia there are 6 possitive vibrational modes, which fits into the predicted 3N-6 for non-linear molecules. For D3H transition state ammonia there are 5 possitive modes and 4 of them are IR active.
| C3V frequency | vibration | D3H | vibration |
|---|---|---|---|
| 452.302 | 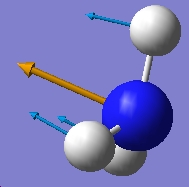 |
-318.501 | 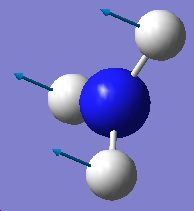
|
| 1680.47 | 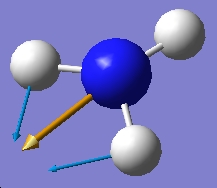 |
1640.59 | 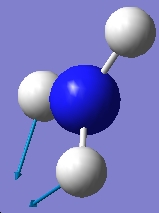
|
| 1680.47 | 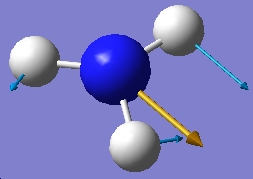 |
1640.59 | 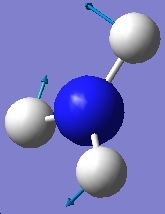
|
| 3575.43 | 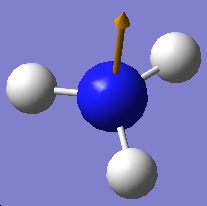 |
3635.71 | 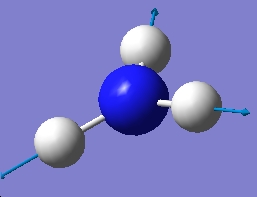
|
| 3775.76 |  |
3854.27 | 
|
| 3775.76 |  |
3854.27 | 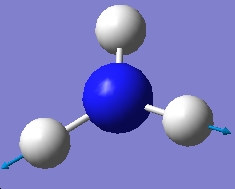
|
When the vibrational modes are compared the similarity is very similar, The only main difference is that D3H ammonia is planner so had no diople to start with. The motion of the frequencies pair up as given except the last two of the D3H swap places to match with the C3V modes. Both structures have a vibration that follows the inverstion path, in C3V it is at 452.302 Hz and in D3H it is the only negative frequency at -318.501 Hz.
Comparison of the methods
The calculations using the higher methods did take signicicantly longer, 2-3 minutes compared to around 1 minute for the simplilar methods. The energy difference using the higher method was 20.46839800 KJ/mol compared to under a KJ/mol for the lower method. This is closer to the experimantal value, but still not very accurate, but a lot more accurate than the lower method.
mini Project
In this mini project I will be looking at ionic liquids, specificaly P or AsX6- where X=F, Cl or Br. I will be inital looking at the effect of changing the halogens and the cental atom on the relative energy of the molecules and how this affects the bond lengths. The second part will be to look at the stability of all of the molecules when used as a ionic liquid with NH4+ as a counter ion. I will look at the the reaction between the two which gives the P or AsX5, HX and ammonia as the products. The reason is PF6- is known for being highly unstable when combinded with NH4+, and readliy forms HF. I will calculate the energy of each component of the reaction and then use these to work out an energy of reaction.
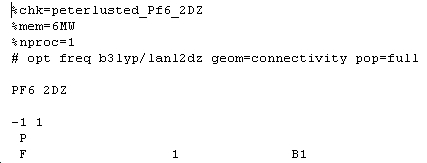
The intial molecule to be looked at is PF6- anion. An inital calculation was run using DFT RB3LYP method and 31G basis set. The calculation did not take very long, so I chose to run each one using DFT RB3LYP and LANL2MB as the basis set as an inital optimisation and then LANL2DZ to fully optimise the molecules. For the calculation I chose to run optimisation and frequencey analysis at the same time. When setting up the calculation the charge was altred to -1 in the method tab and pop=full was added to the additional key words box. A example of the anion input file is shown below. notice that the -1 and 1 above the coordinates had been included the account for the negative charge.
So the following molecules where run: PF6-, PCl6-, PBr6-, AsF6-, AsCl6- and AsBr6-.
Below is a table with Jmol images of each molecule and there final energies
|
|
| |||||||||
| -605.7744083 | -96.27945704 | -85.59804990 | |||||||||
|
|
| |||||||||
| -605.43444650 | -95.95610164 | -85.26810182 |
By comparing the energies of the different molecules it is supprising as to how similar in energy the equivilent asnic and phosphrouse compounds are. This indicates that the reactivity is due mainly to the halids and not the central atom. The change going down the halogens is as expected, the Flurine energy is a lot lower that the others due to it being small and highly polar. The chloride and bromide structures are far higher in energy due to the fact they are larger and more diffuse, thus able to spread the negative charge over a far larger area, so are more stable. The bond lengths also give a better idea of the change in size of the halogen atoms.
| bond lengths (Å) | ||
|---|---|---|
| PF6- | PCl6- | PBr6- |
| 1.73468 | 2.37269 | 2.60743 |
| AsF6- | AsCl6- | AsBr6- |
| 1.80609 | 2.41353 | 2.65034 |
The second part of the project is to look at the reaction when used as an ionic liquid with NH4+. For the reaction I made and calculated the energies of the following molecules. NH4+, NH3
| PF5 | PCl5 | PBr5 |
| -505.73665269 | -81.17066317 | -72.27659015 |
| AsF5 | AsCl5 | AsBr5 |
| -505.38372793 | -80.83968658 | -71.93966291 |
| HF | HCl | HBr |
| -100.44593083 | -15.53952509 | -13.75685477 |
| NH4+ | NH3 | |
| -56.89822575 | -56.54827971 |
By taking the energies of the reactants and subtracting the energy of the products we gain and estimate of the change in energy of the reaction, and a quantitative idea of the difference in reactivity.
Below is a table with the change in energy for each reaction.
| units | PF6- | PCl6- | PBr6- |
| atomic units | -0.05822918 | -0.08078518 | -0.08544898 |
| KJ/mol | -152.88 | -212.101 | -224.346 |
| units | AsF6- | AsCl6- | AsBr6- |
| atomic units | -0.04526622 | -0.07316399 | -0.07846982 |
| KJ/mol | -118.846 | -192.090 | -206.023 |
By looking at the energies it is easy to see why PF6- is so unstable relative to the chlro and bromo compounds. It also shows that at room temperature it is unstable. It also shows that the Asnic compounds are more unstable, so demostrates that the asnic orbitals are larger and more diffuse so have a poorer overlap with the halopgen orbitals.
references
- ↑ : D space refrence for cis MO(P(Me3)2)(CO)4 http://hdl.handle.net/10042/to-1364
- ↑ : D space refrence for trans MO(P(Me3)2)(CO)4 http://hdl.handle.net/10042/to-1365
- ↑ Crystal structures of trans-[Mo(CO)4(PPh3)2] and 1,4-bis (diphenylphosphino)-2,5-difluorobenzene: DOI:10.1016/S0020-1693(96)05133-X
- ↑ : D space refrence for cis MO(P(Me3)2)(CO)4 frequency data http://hdl.handle.net/10042/to-1366
- ↑ : D space refrence for trans MO(P(Me3)2)(CO)4 frequency data http://hdl.handle.net/10042/to-1367
- ↑ : Research Article A convenient synthesis of cis-Mo(CO)4L2 derivatives (L = Group 5a ligand) and a qualitative study of their thermal reactivity toward ligand dissociation DOI:10.1021/ic50187a062


