Rep:Mod2:arfei
BH3
Optimization
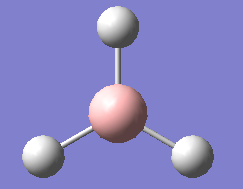
The BH3 molecule was constructed in GaussView 3.0 and the geometry was optimized using the method B3LYP with basis set 3-21G:
The B-H bond length of the optimized BH3 was found to be 1.19 Å, correct to 0.01 Å (lit. 1.185 Å1) and the H-B-H bond angle was 120.0o, correct to 0.1o. The bond length differed from the literature value as the basis set used only correct to the nearest 0.01 Å but if including the rounding error, the bond length obtained from the program should be counted as close to literature value. The bond angle was 120 degree as expected as BH3 is trigonal planar and 120 degree H-B-H angle allows the three Hydrogen atoms to be furtherst apart from each other.
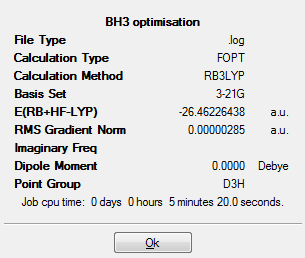
Here is the summary of the optimized BH3:
From the above summary table, we know that by using the calculation method B3LYP with basis set 3-21G, the minimum energy after optimization was found to be around -26.46 a.u. and the energy approximately 0.000003 a.u. showed that the optimization was completed. The table also indicated that there was no dipole moment which met the expectation as all the dipoles in BH3 cancelled each other out and the point group was D3H. It took the little laptop 5 minutes and 20 seconds to run this calculation.
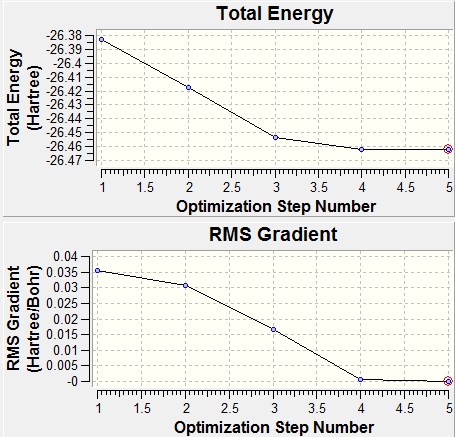
From the first graph below, we know that five optimization steps were needed to get to the minimum energy and the most stable state was the minima of the curve (the one with a red circle). The second graph shows that it took five optimization steps to get to the gradient very close to zero (0.0000033 a.u. as shown in above summary table).
Reference
1. http://journals.iucr.org/b/issues/2010/03/00/so5037/so5037.pdf
Molecular orbitals (MO)
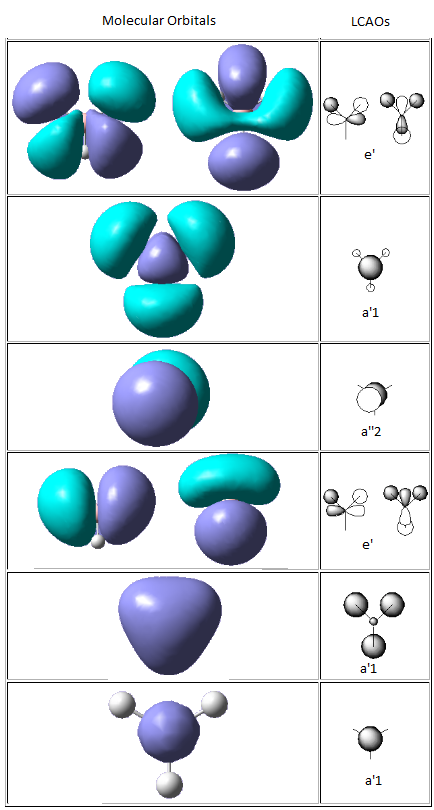
The molecular orbital of BH3 was analysed using the same method and basis set as before. The diagram on the right is the MO diagram for mixing of one boron atom and three hydrogen atom and the table on the left shows the molecular orbital predicted by the program Gaussview and the linear combination of atomic orbital (LCAO) drawn by me. The main difference between the two is that the MO approach shows electron density in molecular fashion and the LCAO approach heavily focus on atomic orbitals. The MO generated by the program predicted key features such as nodal planes in all real MOs accurately. This proves that quantitatively and qualitatively MO theory was very accurate for BH3 and is useful for predicting MOs of molecules to a good degree of accuracy.

Natural Bond Orbital (NBO) analysis
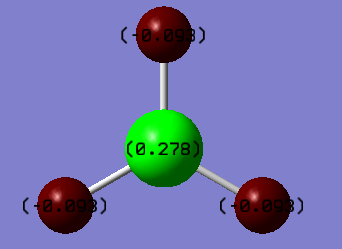
DOI:10042/to-7816 From the image above we can tell that the borom atom is very positive while the other three hydrogen atoms are negative. This shows the fact that boron is highly electron deficient and the hydrogen atoms are electron rich.
Vibrational analysis
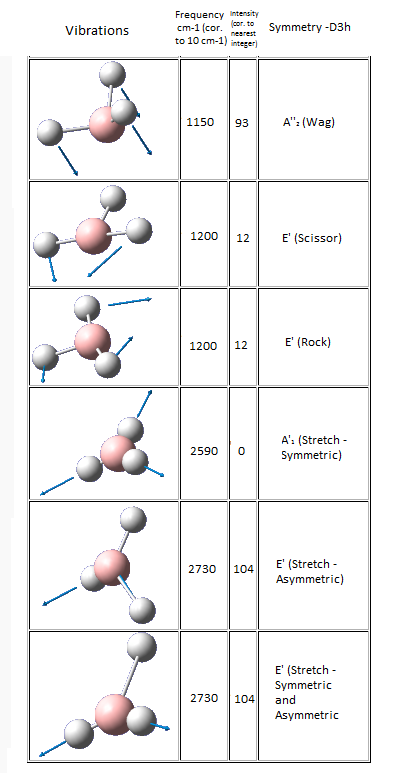
The calculation of the frequency of BH3 was done by using the same method and basis set as before. Optimized BH3 was needed so as to ensure that the frequency of the lowest energy structure was found. All the frequencies should be positive as the frequency calculations by the program was to find the second derivative of the curve so that the lowest point of the curve (minimum energy) could be found.
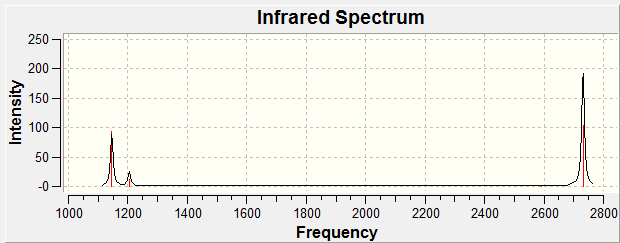
Six frequencies were found after calculations but only three peaks were seen from the above IR spectrum as two sets of frequencies (at 1200 cm-1) are degenerate and the other frequency (at 2590 cm-1) had zero intensity. The zero intesity was due to the symmetric stretch that gave an overall zero dipole moment.
TlBr3
Optimization
The TlBr3 molecule was constructed in GaussView 3.0 and the geometry was optimized using the method B3LYP with basis set LANL2DZ:
The Tl-Br bond length of the optimized TlBr3 was found to be 2.65 Å, correct to 0.01 Å (lit. 2.51 Å)2 and the Br-Tl-Br bond angle was 120.0o, correct to 0.1o. The bond length differed from the literature value as the basis set used was in low accuracy. The bond angle was 120 degree as expected as TlBr3 is trigonal planar and 120 degree Br-Tl-Br angle allows the three bromine atoms to be furtherst apart from each other.
Here is the summary of the optimized TlBr3:
From the above summary table, we know that by using the calculation method B3LYP with basis set LANL2DZ, the minimum energy after optimization was found to be around -91.22 a.u. and the energy approximately 0.0000009 a.u. showed that the optimization was completed. The table also indicated that there was no dipole moment which met the expectation as all the dipoles in TlBr3 cancelled each other out and the point group was D3H. It took the little laptop 1 minute and 48 seconds to run this calculation.
Reference
2. http://actachemscand.dk/pdf/acta_vol_36a_p0125-0135.pdf
Vibrational analysis
The calculation of the frequency of TlBr3 was done by using the same method and basis set as before as the same accuracy is needed for the description of the molecular orbitals. Computing molecular orbitals with different basis set would lead to excited electron density which lead to inaccurate results.
The importance of frequency analysis can be shown by its ability to give the curvation of the function by finding the second derivative of the potential energy surface. If the calculated second derivative (frequencies) is positive we have a minimum and vice versa. We can use this information to see whether the molecule has been optimised completely (i.e. if all frequencies are all positive). Frequency analysis also provides the IR and Raman modes which helps further analysis. In some structure GaussView does not draw in the bonds where we expect but this does not mean there is no bond. GaussView is set up mainly for organic compounds and it has an internal list of bond distances. If the computed conds are outside of the range then GaussView does not put them in. Since inorganic bonds which we are now dealing with can be longer than those found in organic complexes, some of the bonds we expected had not been drawn by GaussView. Bond is not just a line on a structure. A bond can be defined as an interaction between the nuclei and electrons of two atoms. Nuclei and electrons attract each other via electromagnetic force as they have opposite charges. Bonds are often thought of as electrons between two nuclei because it is the most stable configuration and hence where electrons spend most of their time. and the lowest real normal node is at 18.7 cm-1
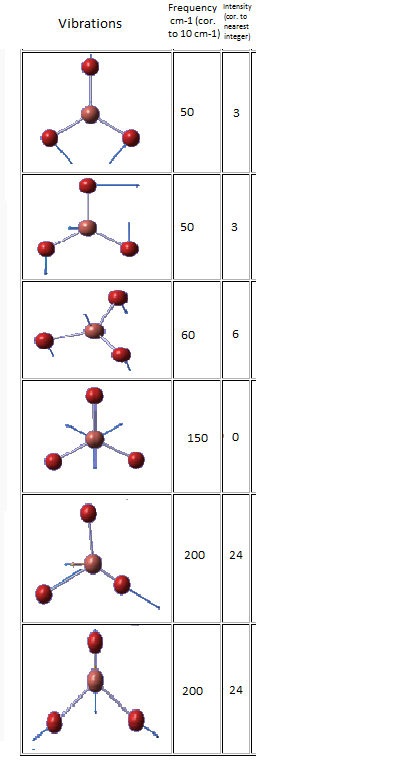
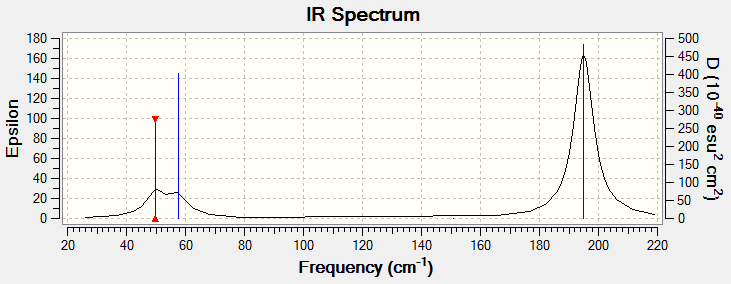
Six frequencies were found after calculations but only three peaks were seen from the above IR spectrum as four sets of frequencies (at 50 cm-1 and 200 cm-1) are degenerate and the other frequency (at 150 cm-1) had zero intensity. The zero intesity was due to the symmetric stretch that gave an overall zero dipole moment. DOI:10042/to-7833
 These are the low frequencies of TlBr3 and the lowest real normal node is at -0.0008 cm-1.
Cis and Trans Isomers
Optimization
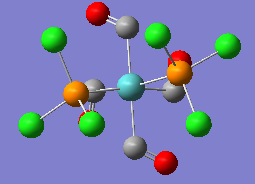
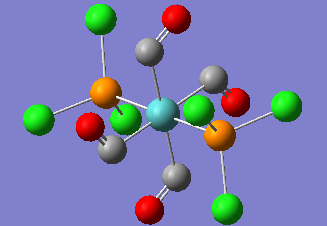
The cis- and trans-MoCO4(PCl3)2 molecules were constructed in GaussView 3.0 and the geometry was optimized initially by using the method B3LYP with basis set LANL2MB. Additional keywords 'opt=loose' was added so as to allow loosing convergence parameters. DOI:10042/to-7819 , DOI:10042/to-7818
The two optimized LANL2MB structure were improved in the following way: For the initial cis-isomer, , one Cl of the PCl3 was altered to point up parallel to the axial bond and one Cl of the other group point down. The whole group of Cls were rotated. For the initial trans-isomer, both PCl3 groups were ensured to be eclipsed and one Cl of each group lied parallel to one Mo-C bond. Two improved structures were then further optimized by using the method B3LYP with LANL2DZ pseudo-potential and basis sets using normal optimization criteria. Additional keywords 'int=ultrafine scf=conver=9' were added to increase the electronic convergence. DOI:10042/to-7820 , DOI:10042/to-7821
Here is the summary of the inital and final optimized cis- and trans-isomers:
| Initial Cis-isomer | Initial Trans-isomer | Final Cis-isomer | Final Trans-isomer | |
|---|---|---|---|---|
| Energy (kJ/mol) | -617.525 | -617.522 | -623.577 | -623.576 |
| RMS Gradient Norm (a.u.) | 0.00064 | 0.00004 | 0.00003 | 0.00006 |
From the above summary table, we can see that the minimum energies of the molecules were obviously higher for the initial-optimized cis- and trans-isomers. This is because before altering the torsion angle of the PCl3 group, we started optimizing in the wrong orientation (i.e. before the barrier), and hence the minima we found were not the lowerst energy one. Another reason is that the method LANL2MB is only in minimal basis compare with the much better basis set and pseudo-potential LANL2DZ so the calculations were as expected less accurate. Another other trend we can observe from the above table was that cis-isomers (for both intial and final) were slightly lower in energy (0.003kJ/mol) than trans-isomers which meant cis molecule was the thermodynamically more stable product and hence the favoured one. This matches the literature which suggests in MoCo4(PPh3)2, the cis ismoer is the more stable one. DOI:10042/to-7823 , DOI:10042/to-7822
| Type | Bond Distance in Å (Cis) | Bond Distance in Å (Trans) |
|---|---|---|
| Axial | 2.012 | - |
| Equatorial | 2.058 | 2.060 |
From the above table, we can conclude that the axial Mo-C bond length is shorter than the equatorial one for cis-isomer and the two equatorial Mo-C bonds of cis are shorter than the four equatorial Mo-C bonds.
Vibrational Analysis
The calculations of the frequencies of the two isomers were done by using the same method and basis set as the final optimization:

| Type | Frequency cm-1 | Intensity |
|---|---|---|
| Equatorial Asymmetric | 1945 | 764 |
| Axial Asymmetric | 1949 | 1498 |
| Equatorial-Axial Asymmetric | 1958 | 633 |
| Equatorial-Axial Symmetric | 2023 | 597 |

| Type | Frequency cm-1 | Intensity |
|---|---|---|
| 1,3 Equatorial Asymmetric | 1950 | 1475 |
| 2,4 Equatorial Asymmetric | 1951 | 1462 |
| 1,2,3,4 Equatorial Asymmetric | 1977 | 0 |
| 1,2,3,4 Equatorial Symmetric | 2031 | 0 |
From the above graphs, we can spot out that the most obvious difference is that there are two visible peaks in the spectrum of cis-isomer at around 2000 cm-1 but there is only one peak in trans-isomer. The missing peak is due to the almost zero (round off to be zero) intensity 'peak' at 2031 cm-1. Another observation is that from the table of C=O stretch we can see that there are four stretching motions for cis and trans but only two visible peaks and one visible peak were observed respectively. This is because three of the stretching motions have very close frequencies for cis-isomer and two of the stretching motions are degenerate while the other two have almost zero intensity for trans-isomer. The intensity is quite low for some of the peaks because these IR spectra were shown at very low energies. However, if we perform the IR at room temperature, as the energy is higher, more vibrations would be expected to present from the IR spectrum. Furthermore, as degeneracy occurs in highly symmetric molecules which trans isomers are, we can use this to deduce which one is trans and which one is cis from the IR spectrum.
From the table above, we can see that there is one negative frequency -1.6440 cm-1 and the other low frequencies that cannot be shown on the spectrum were 0.0006, 2 degenerate 0.0007, 1.1313 and 1.4768 cm-1.
From the table above, we can see that there are two negative frequencies -0.0006 and -0.0003 cm-1 and the other low frequencies that cannot be shown on the spectrum were 0.0006, 1.0043, 2.7480 and 3.0438 cm-1.
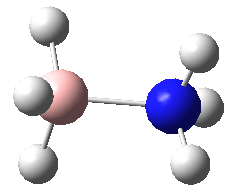
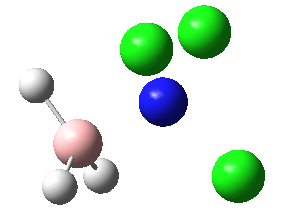
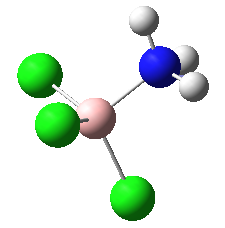
Mini-Project- Investigating the different conformations and vibrations of Mol 1: BH3NH3, Mol 2: BH3NCl3, Mol 3: BCl3NH3 and Mol 4: BCl3NCl3
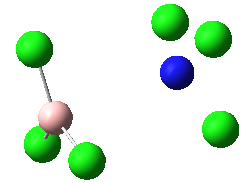
In this project, the geometries of the molecules mentioned above will be optimized and the structures will be investigated and their energies and vibrations will be compared.
 |
 |
 |
|
|---|---|---|---|
Optimization
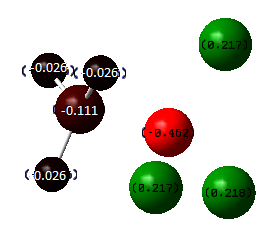
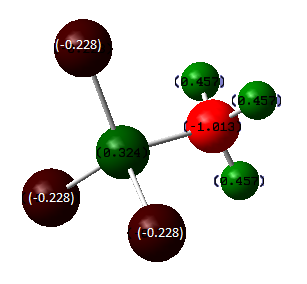
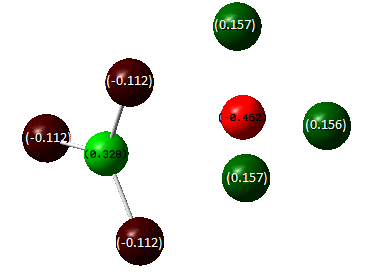
These four molecules were constructed in ChemBio3D and the geometries were optimized using the program GaussView 3.0 by the method B3LYP with basis set 6-31G(d). The structure could not be directly drawn in GaussView 3.0 because there was lone pair on the nitrogen atom. The summary for each conformation is shown below. DOI:10042/to-7832
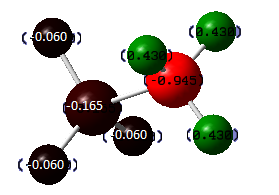
From the table above, we can see a trend: the more the chlorine atoms in a molecule, the lower the energy and hence the more stable the molecule. Obvious comparison would be Mol 1 BH3NH3 and Mol 4 BCl3NCl3. There is a huge energy difference between these two molecules. This can be explained using the NBOs shown above. We can obviously see that the difference between the two NBOs is the charge on boron turns from negative to positlve. This is due to the electron withdrawing group chlorine withdrawing the charge density from the boron, making it positively-charged. In this case, the lone pair from the nitrogen atom is more willing to donate electron to the electron deficient boron atom and hence this atom is the much more stable than Mol 1 which is only partially positive, but actually it is still negatively-charged and hence the donation from the nitrogen is not as strong as that from Mol 4. Similar argument can apply when we compare Mol 2 and Mol 3 where the boron is positively charged in Mol 3 and hence it is more stable than Mol 2.
DOI:10042/to-7825 , DOI:10042/to-7828 , DOI:10042/to-7826 , DOI:10042/to-7827
Reference
3. http://www.ucl.ac.uk/~uccaati/Energy.html
Vibrational Analysis
The calculations of the frequencies of the four molecules were done by using the same method and basis set as the final optimization:
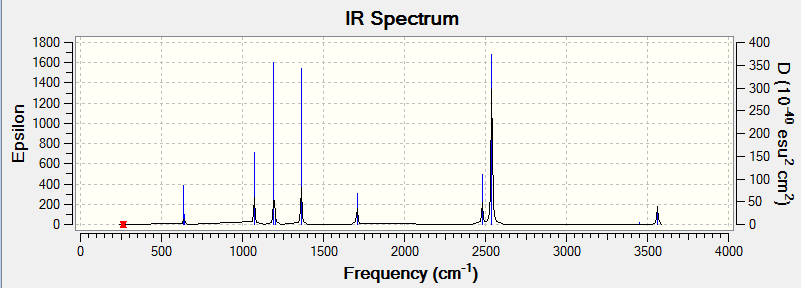
Eighteen frequencies were found after calculations but only eight peaks were seen from the above IR spectrum as four pairs of frequencies (at 640 cm-1, 1070 cm-1, 1700 cm-1 and 3560 cm-1) are degenerate. One of them (at 260 cm-1) had zero intensity. The zero intesity was due to the symmetric stretch that gave an overall zero dipole moment. The other five are not zero but the intensities are too small that can hardly been seen from the spectrum. DOI:10042/to-7824
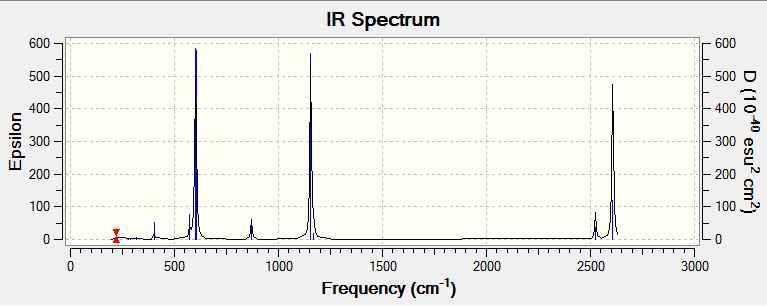
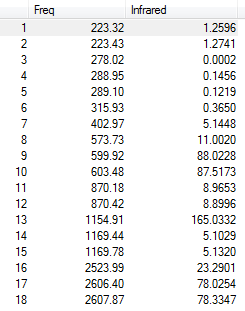
Eighteen frequencies were found after calculations but only seven peaks were seen from the above IR spectrum as two pairs of frequencies (at 870 cm-1 and 2610 cm-1) are degenerate. Four of them (at 280 cm-1, 2 x 290 cm-1 and 320 cm-1) had zero intensity. The zero intesity was due to the symmetric stretch that gave an overall zero dipole moment. Five other frequencies are not zero in intensity but the intensities are too small that can hardly been seen from the spectrum. Also, two peaks are too close to each other so its shown as one peak (at 600 cm-1). DOI:10042/to-7829
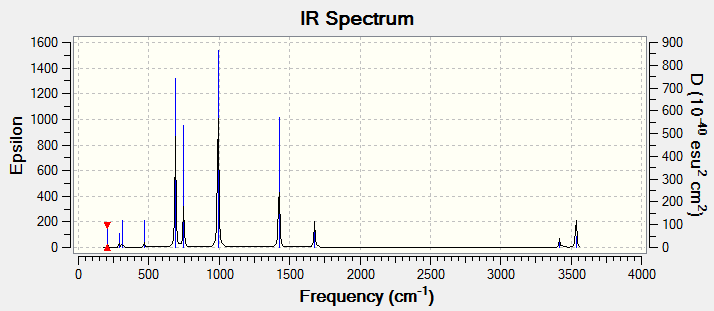
Eighteen frequencies were found after calculations but only eleven peaks were seen from the above IR spectrum as six pairs of frequencies (at 200 cm-1, 290 cm-1, 690 cm-1, 990 cm-1, 1680 cm-1 and 3535 cm-1) are degenerate. One of them (at 220 cm-1) had zero intensity. The zero intesity was due to the symmetric stretch that gave an overall zero dipole moment. Five other frequencies are not zero in intensity but the intensities are too small that can hardly been seen from the spectrum. DOI:10042/to-7830
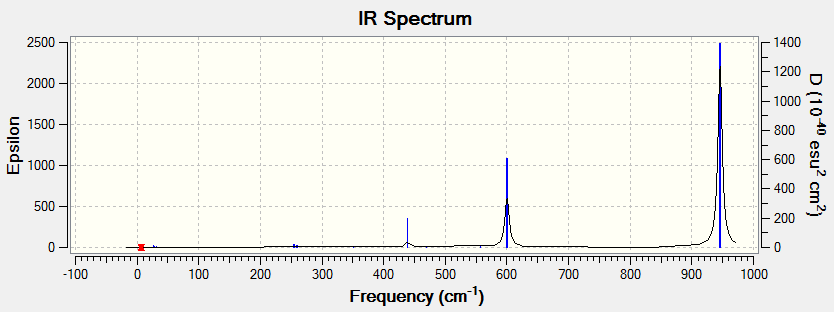
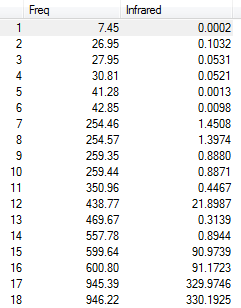
Eighteen frequencies were found after calculations but only three peaks were seen from the above IR spectrum. Two pairs of frequencies (at 600 cm-1 and 950 cm-1) are degenerate. The rest of the frequencies are all in the range between 0 and 1 which are so small that is impossible to be observed from the spectrum. The atomic movements of the five frequencies forming the three peaks were snapshots and shown below. DOI:10042/to-7831
| Vibration | Frequency cm-1 | Intensity |
|---|---|---|
 |
440 | 22 |
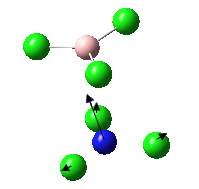 |
600 | 91 |
 |
600 | 91 |
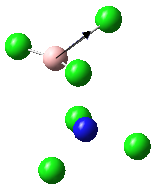 |
950 | 330 |
 |
950 | 330 |
Molecular orbitals (MO)
The MO of BH3NH3 was analysed using the same method and basis set as above and the MO diagram of BH3NH3 with its 9 occupied-orbials, LUMO and the degenerate LUMO+1 and LUMO +2 was drawn as below:

