Rep:Mod2:Yuko.Isayama3001
Bonding (Ab Initio and Density Functional Molecular Orbital)
Structural Analysis of BCl3
Optimisation of the D3H ground state of BCl3 was performed to determine the optimum position of the nuclei. The structure was then confirmed as a minima by frequency/vibrational analysis.
The Gaussian calculation summary for BCl3 optimisation and frequency was as follows:
| Calculation method | B3LYP |
| Basis set | LANL2MB |
| B-Cl distance/± 0.01Å | 1.87 |
| Cl-B-Cl bond angle/± 0.1° | 120 |
| Point group | D3H |
https://www.ch.ic.ac.uk/wiki/images/9/94/Bcl3_opt.log
The same method and basis set were used for both optimisation and frequency analysis or the results would be meaningless. This is because Gaussview computes vibrational frequencies by essentially taking the second derivative of the potential energy surface, hence if a different method and basis set were used, the computed frequencies would not correspond to the optimised structure.
Frequency analysis determines if the optimum structure is a minimum as well as yielding IR and Raman intensities which can be compared with literature. The minimum is characterised as having all positive frequencies, whilst a negative frequency indicates that the structure is a transition state and if more than one are negative it means that finding the critical point has failed and the optimiation has not completed and failed.
The optimised B-Cl bond length and Cl-B-Cl bond angle can be compared with the reported value of 1.75Å1 and 120°1 respectively, in literature, which are in good agreement. This suggests that whilst Gaussview computed the bonding angle with a high degree of accuracy...
In some structures Gaussview does not draw bonds where we expect because the program draws bonds based on a distance criteria; it assigns a certain maximum bond length to a given bond beyond which it is unapplicable, so the fact that Gaussviesw has not drawn the bonds does not mean that there are not there. Thus, a bond can defined as an interaction between atoms or molecules, specifically it is the electrons in the outermost energy level of a particular atom which interact with each other. The electrons of the neighbouring atoms repel each other, but are yet attracted by the nuclei of the other atom resulting in the formation of a bond.
The symmetry expected for the ground state structure of BCl3 is D3H, which is also used by Gaussview. The optimisation will depend on how close the structure will correspond to the global minimum; in other words, if the intial structure of the molecule is near to a local minimum, Gaussview will not change the initial symmetry to locate the global minimum during optimisation.
The calculations for both optimisation and frequencu analysis tooks very little time, 14.0 and 18.0 seconds, respectively. If better basis sets and pseudo potentials were used, the calculations would have taken longer.
A summary table of the forms i.e. motion, frequency and intensity of each vibration for trigonal planar BCl3:
| Mode | Form of vibration | Frequency/± 10cm-1 | Intensity/± 1 | Symmetry D3H point group |
| 1 |  |
214 | 4 | E |
| 2 |  |
214 | 4 | E |
| 3 | 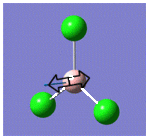 |
377 | 44 | A1" |
| 4 |  |
417 | 0 | A1' |
| 5 | 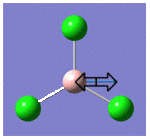 |
939 | 259 | E |
| 6 |  |
939 | 259 | E |
https://www.ch.ic.ac.uk/wiki/images/9/92/Bcl3_freq.log
Although BCl3 has six vibrational modes, only three peaks are present in the spectrum because of degeneracy; the non-degenerate vibrations are those with frequency 376.94, 417.83 and 939.47cm-1, whilst the remaining vibrations are in 2 degenerate pairs (214.13, 214.13cm-1) and (939.47 and 939.47cm-1). This would mean that four peaks should be expected, but accounting for the absorption at 417.38cm-1 which has zero intensity only three peaks are actually observed.
| [[Image:|thumb|570px|left|IR spectrum of BCl3 ]] |
References
- C. Spencer and W. N. Lipscomb, J. Chem. Phys. 28, 355 (1958)
MO Analysis of BH3
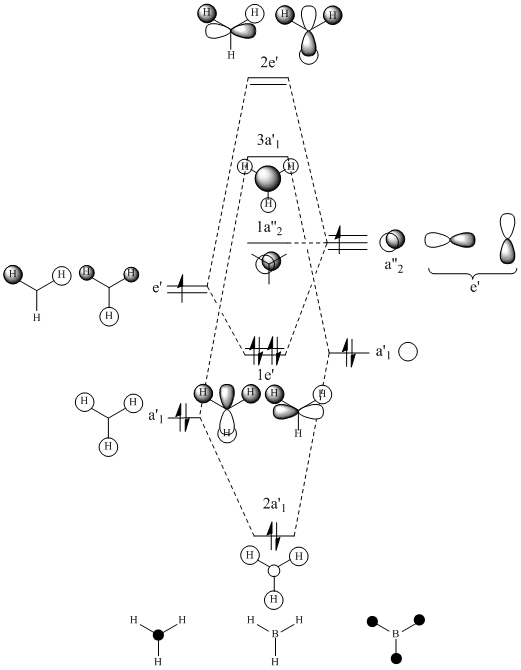
Optimisation of the D3H ground state of BCl3 was performed which was confirmed as a minima by frequency/vibrational analysis. An MO analysis was then carried out to compare the 'real' MOs with the 'LCAO' MOs of my diagram.
 |
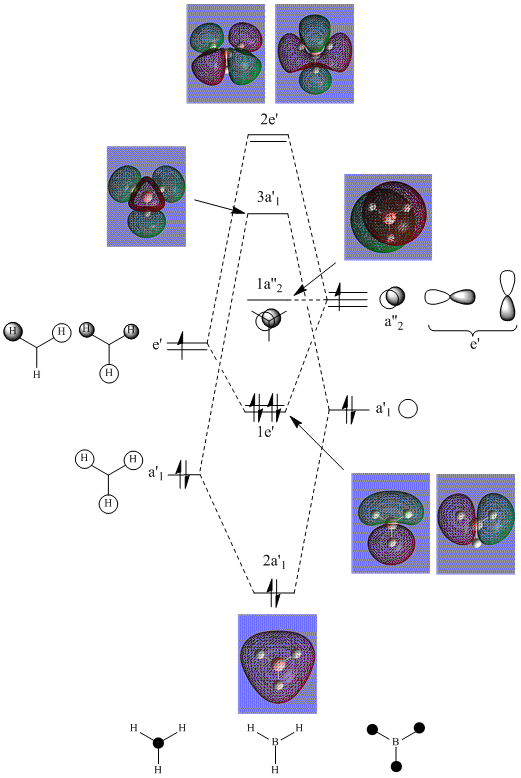 |
For a simple molecule such as BH3, comparison of the 'real' MOs with the 'LCAO' MOs shows that no significant differences but the anti-bonding molecular orbitals are less similar... The MO diagram is a simple qualitative treatment based on the LCAO method. The approximation uses a basis set built from atomic orbitals and assumes that the electrons within the molecule is most influenced by the atom it is close to; consequently its wavefunction closely resembles one of that AO. Whereas the MOs computed by Gaussview uses a larger basis set by solving the Schrodinger equation and hence, the true wavefunction of the molecule to give more accurate, quantitative results.
References
- P. Hunt, The MO diagram of trigonal planar BH3; Lecture 3, Imperial College London, 2009
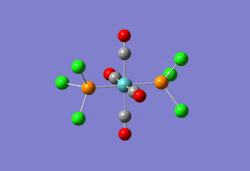
Structural Analysis of Isomers of Mo(CO)4(PCl3)2
The relevant geometric parameters from the optimised geometries of both isomers are given in the following table with the experimental literature values (based on Mo(CO)4(PPh3)2;
| Bond length/± 0.01Å | ||||
|---|---|---|---|---|
| Bond | Trans-isomer | Cis-isomer | ||
| Computed | Literature1 | Computed | Literature2 | |
| C=O | 1.19 | 1.164 and 1.165 | 1.17 | |
| P-Cl | 2.24 | - | 2.24 | |
| Mo-C | 2. | 2.005 and 2.016 | 2.06 and 2.01 | |
| Mo-P | 2.44 | 2.500 | 2.51 | 2.577 |
Trans DOI:10042/to-2726 Cis DOI:10042/to-2727
The energies of the cis- and trans-isomer were calculated as -623.57707195 and -623.57603109 AU respectively, with a small energy difference of -2.733kJmol-1 which indicates that the cis-isomer is more stable. However, taking into account the accuracy of Gaussview in which the energy has an error of ~10kJmol-1, it is not possible to conclude which isomer is actually more stable as the error within the method is greater than the energy difference of isomers.
Bonding in metal carbonyl complexes backbond arises from the donation of electron density from the filled d-orbitals of the metal into empty * anti-bonding orbital of CO. In the cis-isomer the carbonyl ligands do not compete for pi back-donation because electron density is donated from different d-orbitals and since CO is stronger pi-acceptor than the phosphine ligand, these factors could explain its lower stability if it were to be more stable. Whereas the carbonyl ligands in the trans-isomer are competing for electron density from the same d-orbitals, which increases the energy.
The relative ordering of the cis- and trans-isomers could be potentially altered by controlling the bullk of PR3 ligand so that sterics are a factor. By increasing the bulk of the phosphine ligand, the trans-isomer can be formed as the thermodynamically more stable product to minimimise steric repulsion betwen the ligands.
Frequency analysis shows that for each isomer there are two vibrational modes which have a very low frequency:
| [Mo(CO)4(PCl3)2 isomer | Mode | Form of vibration | Frequency/cm-1 | Intensity |
| trans-Mo(CO)4(PCl3)2 | 1 | 5 | 0 | |
| 2 |
||6 || 0
|-
|rowspan=2 |cis-Mo(CO)4(PCl3)2||1 ||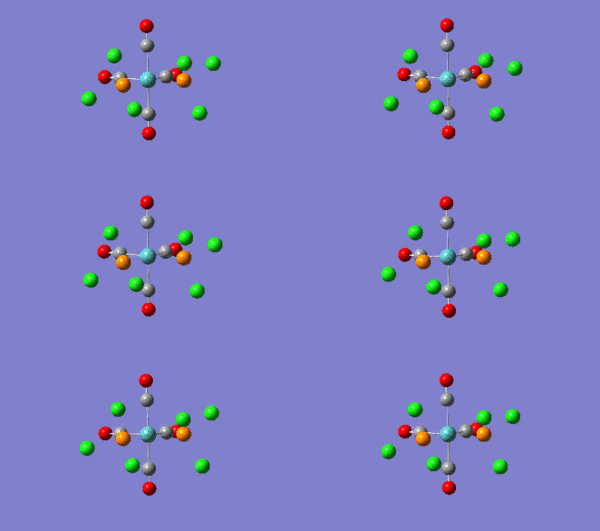 ||11 || 0
|-
|2 ||||18 || 0
|}
If the vibration has a low frequency it is likely that the vibrations are accessible at room temperature, PCl3 groups are freely rotating.
The computed IR frequencies for the carbonyl ligand and their intensities of each isomer are given in the following table with the experimental literature values based on Mo(CO)4(PPh3)2:
| [Mo(CO)4(PCl3)2 isomer | Frequency/±10cm-1 | Intensity/±1 | ||
|---|---|---|---|---|
| Computed | Literature | Computed | Literature | |
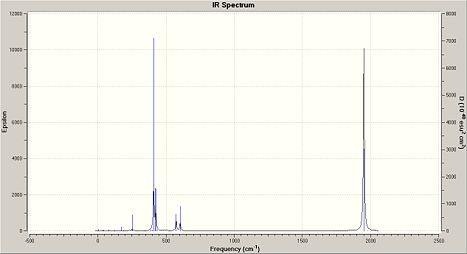
| trans-Mo(CO)4(PCl3)2 | 1950 | 1475 | - | - |
| 1951 | 1896 | 1467 | strong | |
| 1977 | - | 0 | - | |
| 2031 | - | 4 | - | |
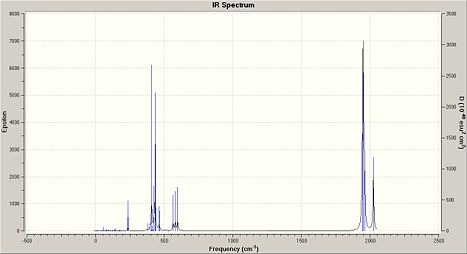
| cis-Mo(CO)4(PCl3)2 | 1945 | 1882 | 762 | strong |
| 1949 | 1903 | 1499 | strong | |
| 1958 | 1917 | 633 | strong | |
| 2023 | 2022 | 598 | medium | |
For the cis-isomer, four carbonyl absoption bands are observed in the IR; a high frequency band of medium intensity and three-closely spaced intense bands at lower frequencies, relating to two A1 modes and a B1 and a B2 mode, which is consistent with C2v symmetry.
Three carbonyl frequencies have been computed by Gaussview for the trans-isomer but having D4h symmetry we would expect only three vibrational modes. Possible reasons of the extra mode may be due to the fact that Gaussview computes vibrational frequencies as if the molecule is static or it may not have have been optimised as perfectly symmetric. Despite this, only one band is observed in the IR spectrum of the trans as expected. Those vibrations at 1977 and 2031cm-1 have very low intensities, 0 and 4 respectively, which explains why they are not significant in the IR spectrum, whilst the vibrations at 1950 and 1951cm-1 cannot be distinguished in both computed and experimental spectra and appears as a single strong absorption band.
The absorption at 1951cm-1 of the trans-isomer which has been assigned the Eu mode and that at 1949cm-1 of the cis-isomer are expected to be alomost identical because they both correspond to the asymmetric stretching of the two trans carbonyl groups and are located cis to the other two carbonyl groups and two phosphine groups. In term of their intensities, they both give rise to the most intense absorptions further supporting the analysis.
 |
 |
References
- G. Hogarth and T. Norman, Inorganica Chimica Acta, Elsvier Science B.V. 254, 167 (1997) DOI:10.1016/S0020-1693(96)05133-X
- M. A. Ardon, P. D. Hayes, G. Hogarth, J. Chem. Edu. 79, 1249 (2002)

