Rep:Mod2:MJW11
Mike's computational chemistry wiki - MJW11
Module 2
Analysis of the BH3 molecule using Gaussian
Gaussview 5.0 was used to create a model of the planar BH3 molecule. All B-H bond lengths were then set to 1.5Å, ready for optimisation. The B3LYP method was used with the 3-21G basis set for the Gaussian optimisation. The 3-21G basis set is relatively low level but sufficient for optimisation of a molecule as simple as BH3
Optimisation results
B - H bond length: 1.19 Å
H - B - H bond angle: 120.0o
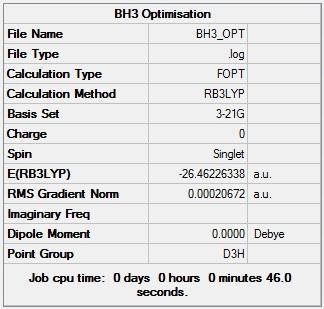
Figure 1 shows that the RMS gradient was less than 0.001 a.u which is a good indication that the calculation converged and thus that the resulting BH3 was adequately optimised. Figure 1 also shows that the model was calculated to have no dipole moment, as would be expected for BH3, taking its symmetry elements (D3h point group) into consideration. The energy of the BH3 molecule was calculated to be -26.46226 Hartree.
Figure 2 - Graph of the total energy through the optimisation
Figure 3 - Graph of the RMS gradient through the optimisation
Figure 2 shows that the total energy of the BH3 model decreased as the optimisation process was carried out and eventually plateaued suggesting the arrival at an energy minimum for the molecular model. Figure 3 shows the same trend as Figure 2 with the RMS gradient substituted for the molecular energy. Figure 3 suggests the arrival of molecular model at an energy extremum because the RMS gradient is an indicator of the forces acting on the atoms in the molecule: at an energy extremum there should be no net internal forces acting on each atom. N.B the .log file for this optimisation was also checked to ensure convergence, as for all other subsequent optimisations.
Gaussian output files often don't display bonds when viewed using Gaussview which raises the question, what is a bond? The Oxford dictionary of chemistry gives a qualitative definition of a bond as 'a strong force of attraction holding atoms together in a molecule or crystal. Covalent bonds involve the sharing of valence electrons rather than transfer'.[1]
IR results
IR data were calculated using Gaussian in order to further check that the the BH3 model optimised sufficiently; negative IR stretching frequencies suggest that bonds in a model have negative stiffness constants and are therefore not sufficiently optimised (atoms not in their equilibrium positions).
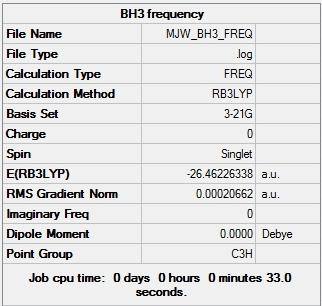
Figure 4 shows that the total energy of the BH3 model after the IR frequency calculation was again found to be -26.46226 Hartree. The IR data presented here are therefore for the BH3 molecule in its minimum energy conformation, as successfully found earlier. Interestingly, the point group was identified as being C3h after the IR frequency calculation and D3h after the optimisation. The identification of the BH3 model as belonging to the C3h point group suggests a loss of planarity which is in contradiction with the calculated dipole moment of the model after both the optimisation and the frequency calculation. The model was calculated to have no dipole moment which means the BH3 model must have a planar structure. This incorrect point group identification of C3h is perhaps a problem with the Gaussview software. The calculated molecular vibrations and their animations are tabulated below.
|
|---|
Figure 5 - Calculated infrared absorption spectrum for BH3
Six molecular vibrations for the BH3 molecule were identified in the Gaussian calculation but only three peaks are present in the calculated IR spectrum (Figure 5). There are two reasons for this. Firstly, molecular vibration four is completely symmetrical and not associated with a change in dipole moment and thus has an intensity of 0; molecular vibrations must be associated with a change in dipole moment to be IR active. Secondly, there are two pairs of degenerate molecular vibrations for BH3 (two&three and five&six) and thus there are two pairs of superimposed peaks. This rationalisation accounts for the three peaks which appear to be 'missing' from the calculated IR spectrum.
MO results
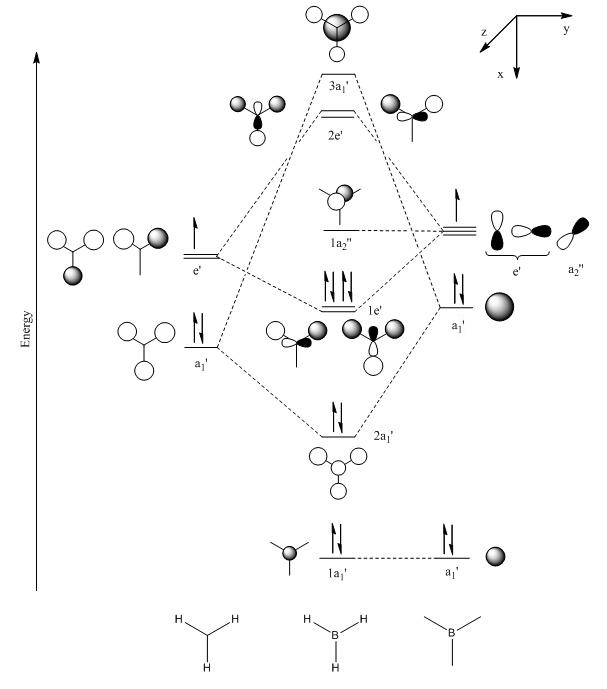
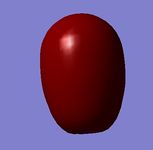
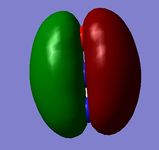
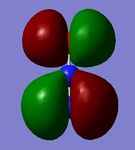
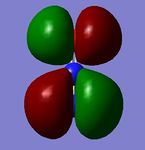
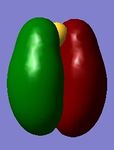
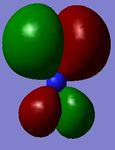
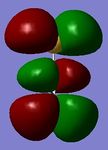
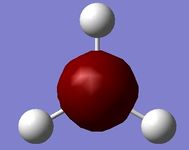
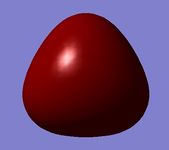
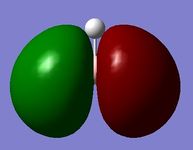
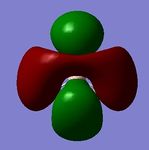
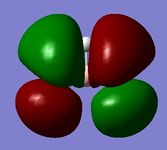
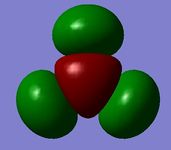
The molecular orbitals of the optimised BH3 model were calculated along with the natural bond orbitals in Gaussian. Contour plots for the eight lowest energy molecular orbitals and a molecular orbital diagram (drawn by hand) are displayed below for comparison.
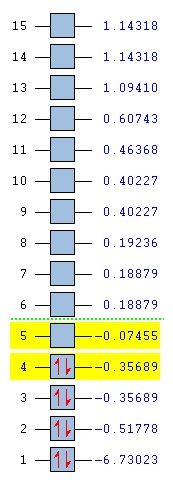
Figure 6 - Molecular orbital diagram for BH3 (left) with Gaussian calculated energies for each orbital (right)
| MO 1 (1a1') | MO 2 (2a1') | MO 3 (1e') | MO 4 (1e') |
|---|---|---|---|
|
|
|

|
| MO 5 (1a2') | MO 6 (2e') | MO 7 (2e') | MO 8 (3a1') |
|---|---|---|---|

|
|
|
|
The Gaussian calculated has correctly identified MOs 3&4 and 6&7 as degenerate (same energy) as would be expected from the molecular orbital diagram for BH3. The eight calculated molecular orbital contour plots also look qualitatively similar to those in the hand drawn molecular orbital diagram. When drawing the MO diagarm for BH3, the ordering of the MOs 6&7 and MO 8 was contentious. The Gaussian calculation provided a definite answer however, confirming that the hand-drawn MO diagram is in fact correct. Note that the energies of these orbitals are very close (0.00357 Hartree) but still greater than Gaussian error limits for energies.
Natural bond orbital analysis
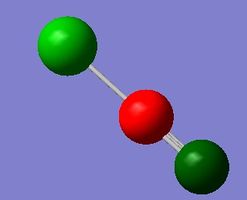
Figure 7 - Qualitative picture of the charge distribution on the BH3 (green suggests electron poor, red suggests electron rich)
The natural bond orbital results show that the boron atom in BH3 is relatively electron deficient in comparison to the hydrogen atoms which are electron rich. More quantitative results from the NBO calculation follow.
 Summary of Natural Population Analysis:

                                       Natural Population
                Natural  -----------------------------------------------
    Atom  No    Charge         Core      Valence    Rydberg      Total
 -----------------------------------------------------------------------
      B    1    0.33161      1.99903     2.66935    0.00000     4.66839
      H    2   -0.11054      0.00000     1.11021    0.00032     1.11054
      H    3   -0.11054      0.00000     1.11021    0.00032     1.11054
      H    4   -0.11054      0.00000     1.11021    0.00032     1.11054
 =======================================================================
   * Total *    0.00000      1.99903     6.00000    0.00097     8.00000
       (Occupancy)   Bond orbital/ Coefficients/ Hybrids
 ---------------------------------------------------------------------------------
     1. (1.99853) BD ( 1) B   1 - H   2
                ( 44.48%)   0.6669* B   1 s( 33.33%)p 2.00( 66.67%)
                                            0.0000  0.5774  0.0000  0.0000  0.0000
                                            0.8165  0.0000  0.0000  0.0000
                ( 55.52%)   0.7451* H   2 s(100.00%)
                                            1.0000  0.0000
     2. (1.99853) BD ( 1) B   1 - H   3
                ( 44.48%)   0.6669* B   1 s( 33.33%)p 2.00( 66.67%)
                                            0.0000  0.5774  0.0000  0.7071  0.0000
                                           -0.4082  0.0000  0.0000  0.0000
                ( 55.52%)   0.7451* H   3 s(100.00%)
                                            1.0000  0.0000
     3. (1.99853) BD ( 1) B   1 - H   4
                ( 44.48%)   0.6669* B   1 s( 33.33%)p 2.00( 66.67%)
                                            0.0000  0.5774  0.0000 -0.7071  0.0000
                                           -0.4082  0.0000  0.0000  0.0000
                ( 55.52%)   0.7451* H   4 s(100.00%)
                                            1.0000  0.0000
     4. (1.99903) CR ( 1) B   1           s(100.00%)
                                            1.0000  0.0000  0.0000  0.0000  0.0000
                                            0.0000  0.0000  0.0000  0.0000
     5. (0.00000) LP*( 1) B   1           s(100.00%)
The summary of the population analysis shows that the boron atom in the BH3 model has a 'natural charge' of 0.33161 and each hydrogen atom has a natural charge of -0.11054. This distribution of electron density is in line with what would be expected for the BH3 molecule. The boron atom in BH3 is sp2 hybridised, each of its three sp2 being used to bond to each hydrogen 1s orbital. This leaves an unoccupied p orbital on the boron atom which is low in energy, making BH3 a good Lewis acid. These results are further seen to be sensible as 3 x -0.11054 = 0.33161 which means that the molecule carries no overall charge, as expected for neutral BH3.
Analysis of the TlBr3 molecule using Gaussian
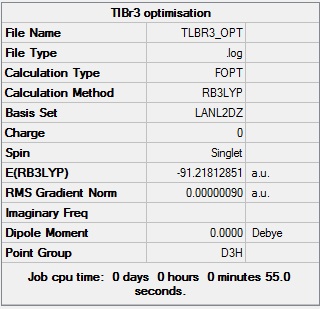
Thallium is the heaviest element in group 3 of the periodic table. Computational analysis of thallium molecules requires a pseudo-potential to model the core electrons of its 81 electron configuration. A model of TlBr3 was optimised using the B3LYP method with the LanL2DZ basis set, having constrained the symmetry of the model to D3h further to the point group problems highlighted earlier for BH3
Optimisation results
Tl - Br bond length: 2.65 Å
Br - Tl - Br bond angle: 120.0o
Figure 8 shows that the energy of the TlBr3 model was calculated to be -91.21813 Hartree. Figure 8 also shows that the model was identified as having the D3h symmetry, as expected.
IR results
IR frequency analysis was performed for the TlBr3 model using the same method and basis set as before with Gaussian, B3LYP and LanL2DZ respectively.
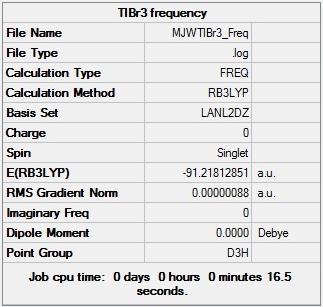
Figure 9 shows that the energy for TlBr3 model was again calculated to be -91.21813 Hartree which suggests that the IR frequency results presented here are in fact for the model in its most optimised form for the method and basis set used. Unlike with BH3, the point group after the IR frequency analysis was identified as being D3h, no change from the orgiginal optimisation.
|
|---|
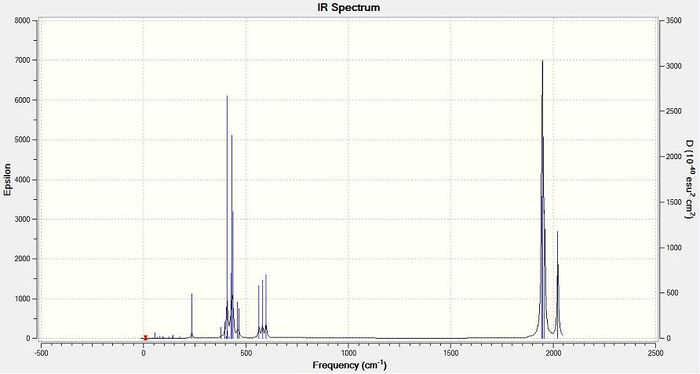
As for BH3, six molecular vibrations for the TlBr3 molecule were identified in the Gaussian calculation but only three peaks are present in the calculated IR spectrum, two of which are overlapping (Figure 8). There are two reasons for this. Firstly, molecular vibration four is completely symmetrical and not associated with a change in dipole moment and thus has an intensity of 0; molecular vibrations must be associated with a change in dipole moment to be IR active. Secondly, there are two pairs of degenerate molecular vibrations for TlBr3 (one&two and five&six) and thus there are two pairs of superimposed peaks. This rationalisation accounts for the three peaks which appear to be 'missing' from the calculated IR spectrum.
The IR frequencies calculated for TlBr3 are approximately 100 times smaller than for BH3. This is because the bromine atoms are much heavier than the hydrogen atoms in BH3. Simply speaking, Gaussian effectively assumes that the Tl - Br and B - H bonds act as harmonic oscillators for which the frequency of oscillation is inversely proportional to the square root of the mass of the atom bonded to B or Tl. The greater mass of bromine than hydrogen means the frequency of oscillation is reduced significantly for TlBr3
Analysis of Mo(CO)4L2 complexes using Gaussian
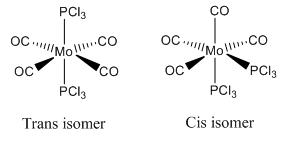
The aim of this investigation was to analyse the different stereoisomers of the Mo(CO)4(PCl3)2 complex using Gaussian. An analysis of the stereoisomers of the same complex with PPh3 ligands substituted for PCl3 ligands would perhaps be more elucidating but was deemed too computationally demanding - Cl atoms were felt to be a good substitute for the phenyl groups. The two possible stereoisomers are shown in Diagram 1.
First optimisation
The B3LYP method was used with the LANL2DZ basis set (pseudo-like potential) for optimisation. Loose convergence criteria were set for the first optimisations to ensure convergence.
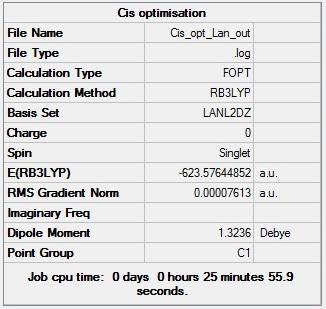
Figure 11 - Summary of Cis Mo(CO)4(PCl3)2 optimisation results |
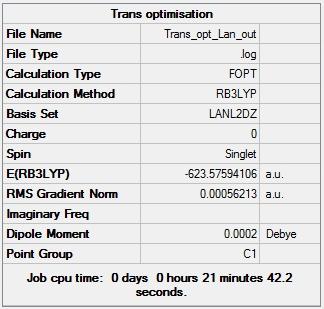
Figure 12 - Summary of Trans Mo(CO)4(PCl3)2 optimisation results |
|---|
Figures 11 and 12 show that the Cis and Trans isomers of the Mo complex have total energies of -623.57645 Hartree and -623.57594 Hartree respectively. The trans isomer was identified as having effectively no dipole moment too and the cis isomer as having a dipole moment of 1.32D. Figures 9 and 10 also show that the first optimisations for the Cis and Trans isomers converged (both RMS gradient norms < 0.001).
| Cis isomer | Trans isomer | |||||||||||||||||||||||||||||||||||||||||||
|---|---|---|---|---|---|---|---|---|---|---|---|---|---|---|---|---|---|---|---|---|---|---|---|---|---|---|---|---|---|---|---|---|---|---|---|---|---|---|---|---|---|---|---|---|
| Optimisation 1 |
|
|
Second optimisation
The output from the first optimisations were then adjusted to help further optimise the complexes. Bond angles and bond lengths were left alone but dihedral angles were changed manually. The complexes were then optimised using the B3LYP method with the LanL2DZ basis set, this time with tighter convergence criteria (int=ultrafine scf=conver=9).
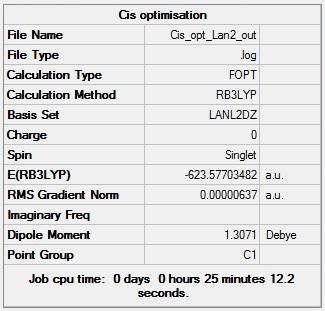
Figure 13 -Summary of Cis Mo(CO)4(PCl3)2 second optimisation results |
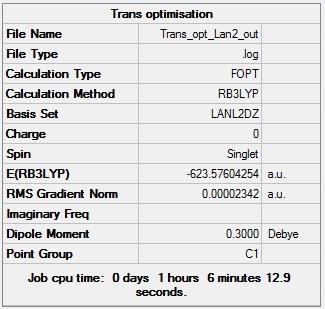
Figure 14 - Summary of Trans Mo(CO)4(PCl3)2 second optimisation results |
|---|
Figures 13 and 14 show that the results from the second optimisation are very similar to those from the first optimisation, the energies of the complexes both decreased very slightly but the cis isomer still had the lower energy than the trans isomer. The main change resulting from the second optimisation was the development of a dipole moment of 0.30 D in the trans isomer which had no dipole moment after the first optimisation. This development of a dipole moment is due to the rearrangement of the PCl3 groups w.r.t each other; their arrangement after the first optimisation was such that the complex had a centre of inversion and thus had no dipole moment but the centre of inversion was lost during the second optimisation. Figures 13 and 14 also show that second optimisations converged sufficiently (RMS Gradient < 0.001).
| Cis isomer | Trans isomer | ||||||||||||||||||||||||||||||||||||||||||||||||||||||||||
|---|---|---|---|---|---|---|---|---|---|---|---|---|---|---|---|---|---|---|---|---|---|---|---|---|---|---|---|---|---|---|---|---|---|---|---|---|---|---|---|---|---|---|---|---|---|---|---|---|---|---|---|---|---|---|---|---|---|---|---|
| Optimisation 2 |
|
|
The tabulated bond lengths and bond angles show that the P - Mo - P bond angle in the cis complex is greater than 90o. This deviation from a true octahedral geometry is likely to be due to steric clashing between the bulky PCl3 groups. It is therefore surprising that the cis complex is lower in energy than the trans complex despite steric clashing in the cis complex due to the close proximity of the PCl3 ligands. A possible explanation for the greater stability of the cis complex is destabilisation of the trans complex due to the trans effect: the trans arrangement of the PCl3 ligands results in a destabilisation of the complex. Although the energies of the cis and trans isomer are very close in energy, the energy difference is still within error limits for Gaussian error calculations (0.00001 Hartree). However, a better basis set may optimise the isomers further which could change the energy ordering of the cis and trans isomers. The 6-311G (d,p) basis set would be a good choice of basis set to check the energy orderings presented here. Also, as the energy difference is so small, it is possible that changing the PCl3 ligands to bulkier ones (PPh3 or PMe3 as examples) would make the steric clashing of the phosphine ligands in the cis complex more of a problem and increase its energy more than that of the trans complex leading to the opposite energy order for the isomers.
IR Results
IR frequency analysis was performed for the cis and trans isomer models using the same method and basis set as before with Gaussian, B3LYP and LANL2DZ respectively.
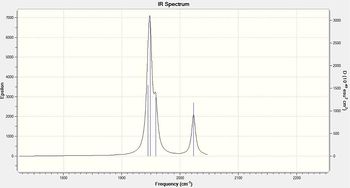
Figure 15 - Calculated infrared absorption spectrum for Cis Mo(CO)4(PCl3)2
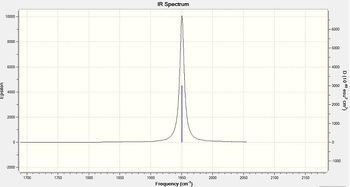
Figure 16 - Calculated infrared absorption spectrum for Trans Mo(CO)4(PCl3)2
| Cis complex | Trans complex | ||||||||||||||||||||||||||||||||||||||||
|---|---|---|---|---|---|---|---|---|---|---|---|---|---|---|---|---|---|---|---|---|---|---|---|---|---|---|---|---|---|---|---|---|---|---|---|---|---|---|---|---|---|
|
|
|
|
|---|---|
| Figure 15 - CO stretching region of the calculated IR spectrum for the Cis isomer | Figure 16 - CO stretching region of the calculated IR spectrum for the Trans isomer |
Gaussian calculated four carbonyl stretching peaks for both the cis and trans isomer. However, only the cis isomer shows four separate peaks, two of the calculated peaks for the trans isomer are of negligible intensity and the other two peaks have effectively the same frequency (to within the accuracy of the Gaussian calculation). Figures 15 and 16 show the CO stretching regions of the calculated IR spectra for the cis and trans isomers and the corresponding molecular vibrations are tabulated above.
Mini-project - Comparison between the molecules N2O, NO2 and N2S
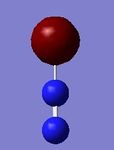
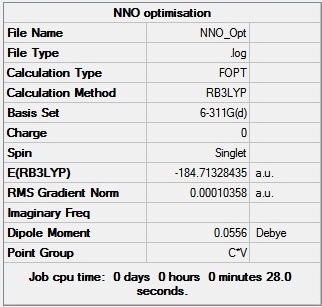
The aim of this project was to draw a comparison between the N2O, NO2 and N2S molecules using the computational chemistry techniques hitherto presented: optimisations, IR frequency analyses and MO / NBO analyses. The B3LYP method was used to optimise the structure of the N2O molecule with the 6-311G(d) basis set. An IR frequency analysis was then performed on the N2O molecule using the same method and basis set to check that the structure had successfully optimised.
Optimisation and IR results
N - N bond length: 1.13 Å
N - O bond length: 1.18 Å
N - N - O bond angle: 180.0 o
|

|
|---|---|
| Figure 17 - Summary of the N2O optimisation results | Figure 18 - Summary of the N2O frequency (IR) results |
Figures 17 and 18 show that the optimisation successfully converged (both RMS gradients < 0.001 and the calculated energies from both the optimisation and the IR calculation are the same). The N- N bond length was found to be smaller than the N - O bond length, this is because the N - N bond is a triple bond and the N - O bond is a single bond; triple bonds tend to be shorter than single bonds. Interestingly, the N2O molecule has been calculated to have a very low dipole moment (0.05 D).
|
|---|
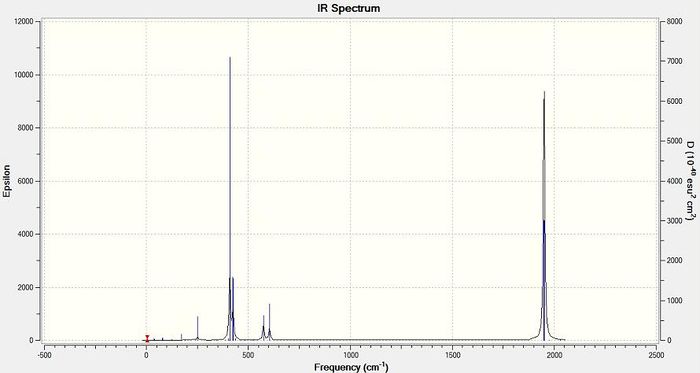
Figure 19 - Calculated IR spectrum for N2O
The IR results for N2 show four calculated peaks, two of which are degenerate (scissoring vibrations). All of the stretching vibrations for N2O have relatively high frequencies as nitrogen and oxygen atoms are relatively light; lighter atoms have higher stretching frequencies. Molecular vibration number 1 has the highest stretching frequency as this stretch is mainly N - N triple bond stretching. Triple bond stretching occurs at a higher frequency than double and single bond stretching which places this stretch at a higher frequency than vibration number 2, the N - O bond stretch.
MO Results
The B3LYP method was again used with the 6-311G(d) basis set to generate the molecular orbitals for the N2O molecule. The results are presented below.
|
Figure 20 - Energies of the calculated molecular orbitals for N2O |
|---|
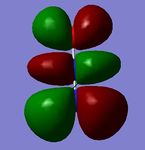
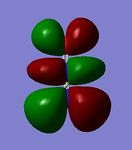
The first three calculated orbitals are the core s orbitals of the nitrogen and oxygen atoms, which are too low in energy to combine to form MOs. MOs 7&8, 10&11 and 12&13 have been calculated as degenerate by Gaussian as shown in Figure 20. N2O therefore has two pairs of degenerate HOMOs and LUMOs. The HOMOs for N2O have two nodal planes and the LUMOs have three which is why the LUMOs are higher in energy than the HOMOs. Interestingly, the LUMOs have been identified by Gaussian as having a negative energy and are therefore bonding orbitals. N2O therefore has low-lying LUMOs which makes it susceptible to nucleophilic attack. Natural bond orbital analysis was carried out in order to work out which atom is most susceptible to nucleophilic attack.
Natural bond orbital analysis
 Summary of Natural Population Analysis:

                                       Natural Population
                Natural  -----------------------------------------------
    Atom  No    Charge         Core      Valence    Rydberg      Total
 -----------------------------------------------------------------------
      N    1   -0.09296      1.99959     5.06872    0.02465     7.09296
      N    2    0.42267      1.99947     4.54271    0.03514     6.57733
      O    3   -0.32971      1.99978     6.31313    0.01680     8.32971
 =======================================================================
   * Total *    0.00000      5.99884    15.92456    0.07660
The NBO results show that the the termini of the N2O molecule are electron rich and the central nitrogen atom is electron poor. This result is in line with what would be expected for the molecule as oxygen is more electronegative than nitrogen and thus accommodates more electron density. This distribution of electron density can be rationalised by thinking of the N2 molecule donating a lone pair of electrons to the oxygen atom to complete its octet. This donation polarises the N2 molecule, leaving the charge distribution as calculated by Gaussian. This NBO analysis shows that the central nitrogen atom is most susceptible to nucleophilic attack.
NO2 Optimisation and IR results
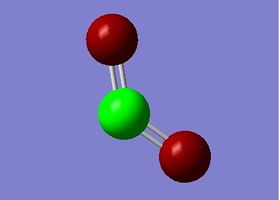
The B3LYP method was used to optimise the structure of the NO2 structure with the 6-311G(d) basis set. An IR frequency analysis was then performed on the NO2 molecule using the same method and basis set to check that the structure had successfully optimised.
N - O bond length: 1.19 Å
O - N - O bond angle: 134.2 o
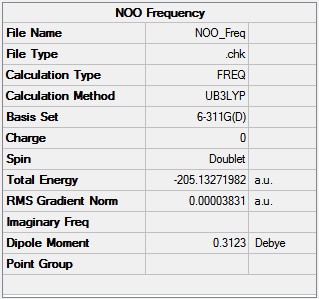
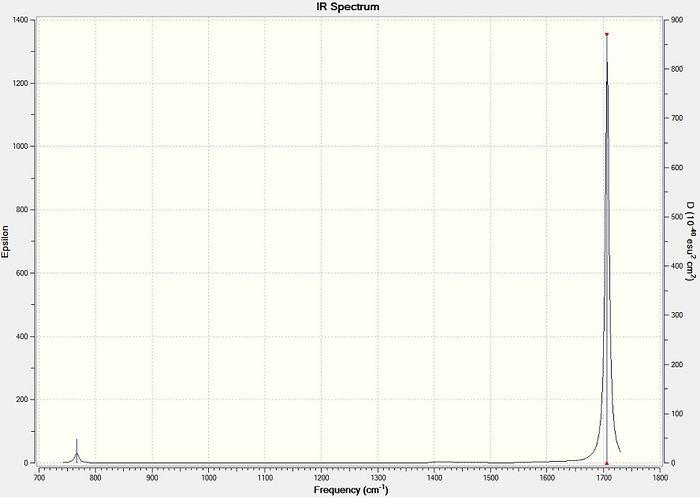
Figures 22 and 23 show that the optimisation and IR frequency calculations successfully converged (RMS gradient <0.001).
|
|---|
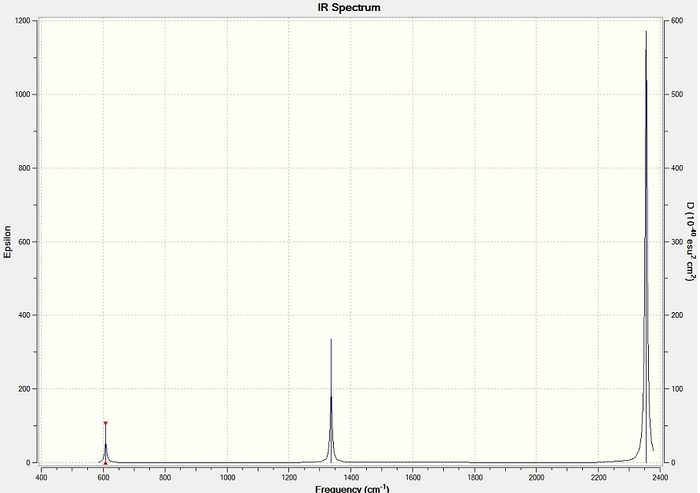
Figure 24 - Calculated IR spectrum for NO2
Figure 24 shows that there is effectively only one peak in the calculated IR spectrum for NO2 as the other two peaks are of almost negligible intensity. The main peak is the stretching peak which is of high intensity.
Natural bond orbital analysis
                                       Natural Population
                Natural  -----------------------------------------------
    Atom  No    Charge         Core      Valence    Rydberg      Total
 -----------------------------------------------------------------------
      N    1    0.51397      1.99970     4.41715    0.06918     6.48603
      O    2   -0.25699      1.99980     6.24150    0.01568     8.25699
      O    3   -0.25699      1.99980     6.24150    0.01568     8.25699
 =======================================================================
   * Total *    0.00000      5.99930    16.90016    0.10054
The natural bond orbital results show that the nitrogen atom in NO2 is electron deficient and the oxygen atoms are electron rich as would be expected from an electronegatitivy argument (oxygen is more electronegative than nitrogen). The non-linear structure of NO2 (C2v point group) means that the molecule carries a dipole moment of 0.31 D. Unfortunately, a comparison of the molecular orbitals in NO2 and N2O / N2S is not possible because the NO2 molecule is a free radical.
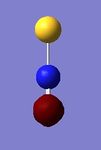
N2S optimisation and IR results
N - N bond length: 1.12 Å
N - S bond length: 1.59 Å
N - N - S bond angle: 180.0 o

|

|
|---|---|
| Figure 26 - Summary of the N2S optimisation results | Figure 27 - Summary of the N2S frequency (IR) results |
Figures 26 and 27 show that the optimisation and IR frequency calculation results successfully converged for the N2S molecule (RMS gradient < 0.001). The optimisation results show that the N - N bond length in N2S is approximately the same as in N2O. The N - S bond length, however, was found to be significantly larger than the N - O bond length in N2O. This greater bond length in N2S is due to the greater size of the sulfur atom than the oxygen atom, the valent sulfur orbitals are more diffuse so the sulfur atom must be situated further away from the nitrogen atom for efficient orbital overlap.
|
|---|
Figure 28 - Calculated IR spectrum for N2S
The IR results show that the molecular vibrations available to the N2S molecule are the same as for the N2O molecule, the frequencies of which are however slightly lower. The vibrations associated with N2S have lower frequencies for the reasons outlined earlier, the sulfur atom is heavier than the oxygen atom which decreases the vibrational frequencies of equivalent vibrations. The calculated IR spectrum for N2S also shows two degenerate scissoring vibrations as were present for the N2O molecule too. The degeneracy of these two vibrations is the result of the linearity of the molecule, the scissoring vibration can occur in two possible directions, both of which have the same energy.
MO Results
The B3LYP method was again used with the 6-311G(d) basis set to generate the molecular orbitals for the N2S molecule. The results are presented below.
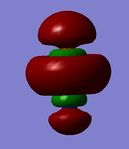
The first five calculated MOs for N2S are low-lying atomic orbitals which are too low in energy to interact. The data suggests that the molecule has two degenerate HOMOs and two degenerate LUMOs as was found for N2O, each pair of which has the same shape but is orientated along a complementary axis in space. The degenerate LUMOs for N2S are relatively low in energy, like for N2O, suggesting that the molecule is susceptible to nucleophilic attack. Natural bond orbital analysis follows in order to work out which atom in the molecule is most likely to be attacked by a nucleophile.
Natural bond orbital analysis
Natural Population
Natural  -----------------------------------------------
Atom  No    Charge         Core      Valence    Rydberg      Total
-----------------------------------------------------------------------
N    1    0.04453      1.99963     4.91903    0.03681     6.95547
N    2   -0.13333      1.99946     5.09748    0.03639     7.13333
S    3    0.08880      9.99925     5.87531    0.03664    15.91120
=======================================================================
* Total *    0.00000     13.99834    15.89181    0.10984    30.00000
The natural bond orbital analysis suggests that the terminal nitrogen and sulfur atoms are electron poor and the central nitrogen atom is electron rich. Interestingly, this is the opposite result to what was found for N2O. The terminal sulfur atom appears to carry the least electron density, it is therefore likely that the terminal sulfur atom is the part of the molecule most susceptible to nucleophilic attack.
Conclusion
The Gaussian calculations presented here showed that the N2O and N2S have very similar molecular orbitals and IR spectra but do not necessarily have the same reactivity: N2O is susceptible to nucleophilic attack at the central nitrogen atom and N2S is susceptible to nucleophilic attack at sulfur. A comparison was difficult to draw between the N2O and N2S molecules because one is a radical and the other is not which means they require different computational techniques to analyse.
An interesting follow up to this project involves the Lewis structures of N2O. This would involve using NBO analysis on two models of N2O to work out which of the two possible Lewis structures (Diagram 1) is the most accurate representation of N2O.
Stefan and R. Janoschek were able to work out which of the three possible Lewis structures for carbon monoxide (Diagram 2) is the most accurate representation of the molecule. They used an NBO treatment in Gaussian which suggested that structure 3 is the 'true' Lewis structure based on their criteria for the best Lewis structure.[2]
Note on accuracy
Gaussian energies have an error of ~10 kJ/mol associated with them
1 Joule = 2.29371269 × 10¹⁷ Hartree
10 kJ/mol = 2.29371269 × 10¹⁸ Hartree/mol = 3.80879906 x 10⁻⁶ Hartree/atom
Gaussian energies are therefore approximately accurate to the sixth decimal place in Hartrees.
Gaussian calculated dipole moments are accurate to approximately 0.01 D.
Gaussian calculated IR frequencies and intensities are traditionally reported to the nearest integer.
Gaussian calculated bond distances and bond angles are accurate to 0.01 Å and 0.1o respectively.
Gaussian output files
Gaussian output files for all of the computations used in this report have been deposited here. N.B DOI links are only available for those calculations which were run using the college's SCAN.
| TlBr3 optimisation output | Cis Mo complex optimisation output 1 DOI
Trans Mo complex optimisation output 1 DOI Cis Mo complex optimisation output 2 DOI Trans Mo complex optimisation output 2 DOI |
N2O optimisation output |
|---|

