Rep:Mod2:Jazz0611
Zain Khawaja - Computational Report (Module 2)
Introduction
It is possible to investigate the structures and bonding of inorganic complexes by computational means. Unlike most organic systems, inorganic compounds do not generally show straight forward bonding patterns. By computational means, we can differentiate between the energy of stable conformers. Moreover, it is possible to obtain thermodynamic information from the energy of the stable states, allowing us to locate the position of the transition states or activated complexes.
Borane (BH3)
Optimisation
When we optimise a structure, we are obtaining its most stable geometry. This is done so by solving the Schrödinger equation for the nuclear positions and electrons to find the energy. We assume the Born-Oppenheimer approximation when solving the Schrödinger equation, thus assuming that nuclear position is fixed and we solve the energy for the electrons. Thus we obtain an energy that is dependent on the nuclear position - we can call this energy E(R) where R represents all the collective nuclear coordinates. If we move the nuclei into a new position, and solve then we obtain a different energy E(R') since we have changed the distance and therefore the electrostatic interactions between the nuclei, which affects the total energy E(R').
The potential energy curve E(R) can be represented by the dissociation curve of a diatomic molecule (Figure 1), where in the same way, energy E is dependent on nuclear position R. As we can see, the optimised energy of the molecule is situated in the trough (this is also the equilibrium bond distance). Therefore, if we obtain an energy E(R) from solving the Schrödinger equation, and also an energy E(R') after moving the nuclei slightly, we can compare the energy of this new configuration to the energy of the old configuration. If the energy is lower, we "move" in that direction i.e. down the potential energy curve closer to the optimised energy (trough point). This process is repeated and we gradually approach the lowest energy configuration.
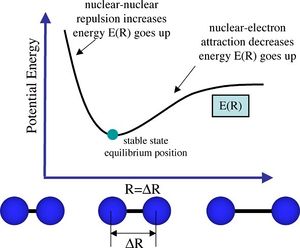
Therefore, this was demonstrated by optimising the structure of borane (BH3). The borane molecule was drawn on GaussView and prior to optimisation, the B-H bond lengths were set to 1.5Å (having previously been 1.18Å). The method used was B3LYP (this method determines the type of approximations that are made in solving the Schrödinger equation) and the basis set used was 3-21G (the basis set determines the accuracy - in this case, this basis set has a low accuracy but results in a rapid calculation). The optimisation was then run using Gaussian and the optimised structure can be visualised here:
The optimised molecule was analysed by opening the .log file on GaussView. The data obtained is summarised in Table 1:
| Bond Length | 1.19Å |
|---|---|
| Bond Angles | 120° |
| File Type | .log |
| Calculation Type | FOPT |
| Calculation Method | RB3LYP |
| Basis Set | 3-21G |
| Final Energy | -26.46 a.u. |
| Gradient | 0.00000285 a.u. |
| Dipole Moment | 0.00 |
| Point Group | D3h |
| Calculation time | 8.0 seconds |
It is important to analyse the gradient. This is because the optimised structure will lie at the point on the potential energy surface where the gradient is zero (the first derivative is zero). In this case we require the gradient to be zero, or close to zero (i.e. <0.001). This is the case for our gradient (0.00000285) therefore we know the optimisation is complete. The bond length and bond angles found (1.19Å, 120°) agree with literature values as quoted by Wade and co-workers.[2]
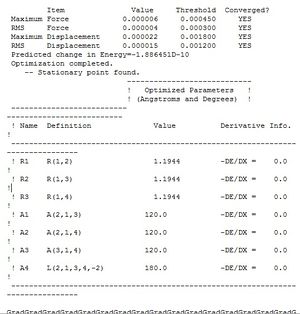
The "real output" .log file was examined. This can be seen in Figure 2. Essentially, we can use it to check that our forces have converged (under the heading "Converged?" it says "YES" for each of the "Item" parameters e.g. "Maximum Force", "RMS Force", etc.).
Analysis on GaussView also allowed us to obtain graphs of the Total Energy and Root mean squared gradient, both as functions of number of optimisation steps (Figure 3).
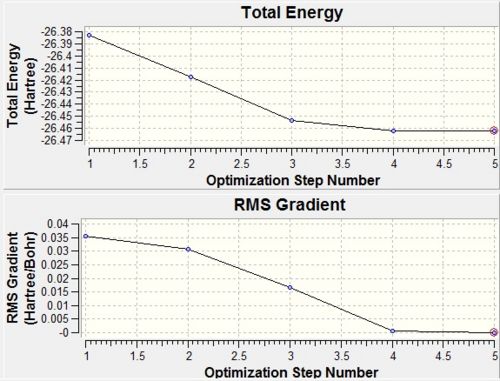
The first graph shows the energy of the borane molecule (in Hartrees) at each step of the optimisation. The root mean squared is a statistical measurement of the magnitude of a varying quantity, thus in this case measures the deviation of the bond length from the equilibrium bond length. As we can see, the gradient is tending to zero as each successive optimisation reduces the energy of the molecule. We see this zero gradient for the final optimisation step (looking at the RMS Gradient graph). We can see the molecular arrangement at each optimisation step in Figure 4:

Molecular Orbital Analysis
Figure 5 shows the molecular orbital diagram for Borane. Using Gaussian and the optimised structure of borane, we can compute the molecular orbitals of borane and their energies (Table 2).
The completed population analysis was published and can be seen here: DOI:10042/to-7697

| "Real MO" | LCAO MO | Symmetry | Energy/Hartrees |
|---|---|---|---|
Homo -3  |
|||
Homo -2  |
 |
||
Homo -1  |
|||
Homo  |
|||
Lumo  |
|||
Lumo +1  |
|||
Lumo +2  |
|||
Lumo +3  |
We can see from the results obtained that the computed MOs obtained from the Gaussian computational method correlate well with the theoretical LCAO MOs. We can see blending of the lobes in the same phase, this is a computerised effect but makes it easier to visualise the MOs and observe the overall charge distribution and where the phase boundaries lie.
One problem we tend to have in general is that it is very hard to guess the relative spacings of the 2e' and 3a1' antibonding orbitals and whether the 2e' degenerate orbitals lie above the 3a1' in terms of energy. We can see from the table that the energy of the three orbitals is almost the same (-0.179 Hartrees compared with -0.166 Hartrees, a difference of 0.013 Hartrees so the displacement is not costly in terms of energy) so in reality these orbitals are in fact interchangable. However, on the basis that we see, from our results, a strong s-s interaction between the Boron 1s and 2s and hydrogen orbitals (the MOs produce energies of -6.730 and -0.517 Hartrees respectively), and also on the assumption that in a strong interaction, the antibonding orbital is always destabilised more than the bonding is stabilised, we assume that the s-s interactions are greater than s-p for borane, therefore the 3a1' antibonding orbital is higher in energy (only slightly) than the degenerate 2e' orbitals. If we were to assume the other assumption instead, a1' energy levels are more stable than e' (s-s interactions more stabilised) then we would draw the 2e' energy levels above the 3a1'. Of course in reality, where we draw these energy levels does not matter as they are quite far from the HOMO-LUMO region where the principle reactivity of borane takes place.
In conclusion, we can state that molecular orbital theory is a very useful qualitative technique which we can use to accurately visualise what the "real" molecular orbitals look like, given the precise correlation shown from our computed results.
Natural Bond Orbital Analysis
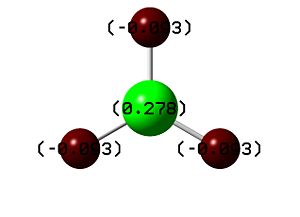
Using the .log file from the population analysis, we were able to carry out natural bond orbital analysis. This allowed us to examine the charge distribution, which is displayed on the molecule (positive charge is green coloured, negative charge is red coloured). As expected, we see that the Lewis deficient boron is coloured green, and displayed as highly positively charged relative to the hydride-like hydrogen atoms (Figure 6). We can see this reflected quantitatively - borane had a numerical charge distribution of +0.278 and each hydrogen -0.093 respectively.
Further NBO analysis took place by reviewing the .log file. If we scroll down to find the heading "Bond orbital/Coefficients/Hybrids which outlines the distribution of the electron density in the bond, we can see that the number under "BD" corresponds to the boron in each B-H bond contributing 45.37% of the electron density. Essentially this means that 45.37% of the bond is contributed by the boron orbitals, which have a hybridisation of 33.33%s and 66.67%p. Moreover, 54.63% of the bond (the remaining percentage) comes from the hydrogen orbital which is hybridised 100.00%s. This distribution of electron density proves the sp3 hybridization in borane. This data can be viewed by clicking on the NBO Analysis link given at the beginning of this section, which opens the .log file and the data can be found when scrolled down to the relevant headings.
Vibrational Analysis
On the potential energy surface, we know that the optimised structure is the energy minimum (located on the trough). As discussed before, the first derivative and therefore the gradient at this point is equal to zero. To determine a maximum or minimum point, we can calculate the second derivative. A positive second derivative signifies a minimum point, and vice-versa for a negative second derivative.
This is the basis of frequency analysis. The frequency analysis is effectively calculating the second derivative of the potential energy surface. If we obtain every frequency as positive, we have found a minimum point. If one value is negative, we have found a transition state, however if we obtain more than one negative value, we must note that the optimisation has failed or is incomplete.
A frequency analysis of borane was undertaken to ensure we have minimum structures and the results are tabulated in Table 3:
Furthermore, the IR spectrum of borane was computed using GaussView and can be seen below (Figure 7):
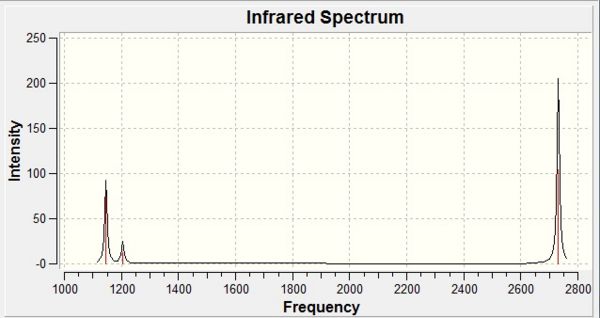
As expected due to the 3N-6 rule for non-linear molecules, Gaussian computed six vibrations for borane, however our IR spectrum shows only three of these vibrations. By observing our table of frequencies above, we can explain this effect. As seen, the fourth vibration (symmetric A1') which occurs at about 2593cm-1 has an intensity of 0, since it is a symmetric vibration therefore involves no overall change in dipole moment and hence is not seen on the spectrum. This leaves five vibrations to account for, however four of these vibrations are caused by two sets of degenerate E' orbitals. These appear as two peaks at 1205cm-1 and 2731cm-1 respectively and this leaves the remaining A2' orbital frequency which appears at 1146cm-1.
Thallium Tribromide (ThBr3)
Optimisation
In the same way as for borane, thallium tribromide was optimised using Gaussian. It was necessary to use the DFT B3LYP method as before, however a different basis set was used for this molecule (not 3-21G as for borane). In this case, pseudo potentials and a larger basis set (LANL2DZ) was used due to the larger and heavier thallium and bromine atoms (relative to boron and hydrogen). Moreover, the symmetry of the molecule was restricted to D3h and was set so the molecule was unable to change symmetry during the course of the calculation. The optimisation was then run on Gaussian and the optimised structure can be visualised here:
The optimised molecule was analysed by opening the .log file on GaussView and the data obtained was summarised in Table 4 below:
| Bond Length | 2.65Å |
|---|---|
| Bond Angles | 120° |
| File Type | .log |
| Calculation Type | FOPT |
| Calculation Method | RB3LYP |
| Basis Set | LANL2DZ |
| Final Energy | -91.22 a.u. |
| Gradient | 0.00000090 a.u. |
| Dipole Moment | 0.00 |
| Point Group | D3h |
| Calculation time | 11.0 seconds |
The results above show the optimised bond length obtained was 2.65Å and the optimised bond angle calculated was 120°. Blixt and co-workers reported a bond length for the complex as 2.52Å.[3] Thus our computed model lies fairly close to the literature.
Vibrational Analysis
Once again, a vibrational frequency analysis was carried out using the same method and basis set as above in the optimisation to ensure that optimisation had resulted in the minimum energy geometry (minimum stationary point i.e. second derivative of energy). The method and basis set were kept the same as differing methods and basis sets compute different total energies, and this would not allow us to compare our final energies. The results are tabulated in Table 5:
| File Type | .log |
|---|---|
| Calculation Type | FREQ |
| Calculation Method | RB3LYP |
| Basis Set | LANL2DZ |
| Final Energy | -91.22 a.u. |
| Gradient | 0.00000088 a.u. |
| Dipole Moment | 0.00 |
| Point Group | D3h |
| Calculation time | 28.0 seconds |
We can see that the final energy matches the final energy of optimisation (-91.22 a.u. respectively) which implies that a minimum was reached and that after frequency analysis the structure has still retained the minimum energy geometry. Moreover, the "real" output .log file was examined and the two lines labelled "Low Frequencies" were studied. These are the motions of the center of mass of the molecule and, as shown in Figure 8, are smaller than the first vibration listed. The top line of low frequencies corresponds to the six degrees of freedom and the bottom line of low frequencies are the "real" frequencies for the molecule. The "low frequencies" are -3.4213, -0.0026, -0.0004, 0.0015, 3.9367, and 3.9367.

In Table 5a below, showing the real vibrations calculated for TlBr3:
Occasionally, GaussView does not draw a chemical bond where we expect it to be. This does not mean that the bond does not exist, as for all the calculations, as we will see later on, Gaussian still incorporates the assumed interaction between two atoms that lie within a "bonds" distance away from each other into the calculations. The reason that we do not see a bond occasionally lies down to the memory of the program itself. GaussView has a set database of bond lengths it can compute and if a bond is longer than the limit that GaussView holds, it will not recognise that a bond is drawn between the two atoms however it still recognise an interaction between the atoms.
Essentially, a chemical bond is a connection between two atoms. This connection could either be an attractive interaction or a repulsive interaction. If we call it a bond, i.e. it is an attractive connection, then we can either have an ionic or covalent bond. In inorganic chemistry, bonding is not as simple as in organic chemistry, and a bond can be brought about by various interactions (electrostatic attraction of opposite charges, sharing of electrons, donation of electrons, hydrogen bonding, etc.). In a computational sense, a chemical bond is the combination of of one coordinate where an atom lies to another coordinate. The interaction between these two coordinates is computed as a molecular orbital, formed as a result of a linear combination of atomic orbitals.
Stereoisomers of [Mo(CO)4Cl2]
Abstract
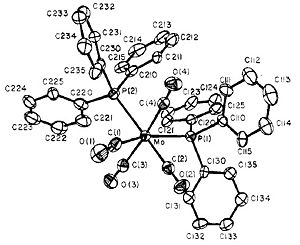
Unfortunately, we are unable to investigate the thermal stability and special characteristics of the stereoisomers of the complex [Mo(CO)4(PPh3)2] (shown in Fig 8a) since the triphenyl phosphine ligands are too large and therefore costly in terms of consumption of computational time and effort. Replacing the phenyl rings with less computationally demanding chlorine atoms has the advantage that chlorine is known to have a similar electronic contribution to the bonding like phenyl groups do. Moreover, sterically, chlorine atoms are similarly large to phenyl groups. Therefore computational analysis was performed for the complex [Mo(CO)4(PCl)2].
Optimisation
Both the cis and the trans isomers of the molybdenum complex were optimised in two steps to ensure an accurate minimum geometry was obtained. If clicked, the jmol buttons below show the structures of the cis and trans isomers respectively before optimisation.
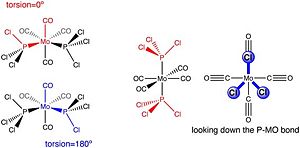
The first optimisation was carried out using the B3LYP method and a basis set LANL2MB (which is more accurate than 3-21G), with an additional keyword 'opt=loose' implying that this initial optimisation was loose and rough. The second optimisation involved the same method, but this time with a more accurate basis set LANL2DZ. Moreover, before optimisation, the structures of both isomers were altered so as to maximise the minimisation. For the cis conformer, a chlorine atom was made to point upwards so that it aligned parallel to the axial Mo-CO bond (this involved changing the torsion angle between the CO bond and the P-Cl bond to 0°) whilst another chlorine atom from the opposite P atom was made to point down so that it also aligned parallel to an axial Mo-CO bond (this involved changing the torsion angle between the same CO bond that was picked and the P-Cl bond to 180°). For the trans conformer, both PCl3 groups were eclipsed and ensured that one P-Cl bond was parallel to an Mo-CO bond. These changes are outlined in Figure 9. Moreover, the results of both optimisation steps for each isomer were compiled and can be seen in Table 6:
| Isomer | ||||
|---|---|---|---|---|
| P-Cl Bond Length (Å) | 2.41 | 2.24 | 2.40 | 2.24 |
| Mo-P Bond Length (Å) | 2.52 | 2.51 | 2.48 | 2.45 |
| Calculation type | FOPT | FOPT | FOPT | FOPT |
| Calculation method | RB3LYP | RB3LYP | RB3LYP | RB3LYP |
| Basis set | LANL2MB | LANL2DZ | LANL2MB | LANL2DZ |
| Final Energy (au) | -617.53 | -623.58 | -617.52 | -623.58 |
| Gradient (au) | 0.00021 | 0.000035 | 0.00010 | 0.000032 |
| Dipole moment (Debye) | 8.48 | 1.31 | 0.00 | 0.30 |
| DOI | DOI:10042/to-7758 | DOI:10042/to-7759 | DOI:10042/to-7760 | DOI:10042/to-7761 |
The first thing that was noticed after the first optimisation was the disappearance of the P-Cl bonds. As we have discussed earlier, these bonds have in fact not disappeared but the bond distance is simply at a value that is too high to GaussView to register. We can see that all the gradients obtained are lower than 0.001 a.u. thereby implying that the optimisations were successful.
We obtained a Mo-P bond length of 2.51Å for the cis-isomer and a shorter 2.45Å for the trans-isomer. This correlates fairly well with the literature value of 2.58Å for the cis-isomer of [Mo(CO)4(PCl3)2] and 2.50Å for the trans-isomer of [Mo(CO)4(PCl3)2], quoted by Hogarth and co-workers[6] . We must bear in mind that our complex contains chlorines as part of the phosphorus-based ligand whereas the literature has quoted bond lengths with the use of this different complex. In this sense we didn't expect our computed bond lengths to be concordant with the literature but the fact that they are close bears a great positive in accounting for the accuracy of our results.
As shown by the values, the cis-isomer has a dipole moment, unlike the trans isomer, where the dipoles cancel out due to the symmetry. In terms of energy, we can see that the energy decreases the more optimised the molecule is. Table 7 shows the summarised energy values:
| Isomer | Cis-isomer (1st opt) | Trans-isomer (1st opt) | Cis-isomer (2nd opt) | Trans-isomer (2nd opt) |
|---|---|---|---|---|
| Energy / Hartrees or a.u. | -617.53 | -617.52 | -623.58 | -623.58 |
| Energy / kJ/mol | -1621312 | -1621304 | -1637201 | -1637199 |
Judging by the energy values given in Table 7, we could conclude that cis isomer is more stable after the first optimisation. The energy difference attributed to this is that the cis isomer is 8 kJ/mol lower in energy. Moreover, after the second optimisation, the cis isomer is again more stable by 2 kJ/mol. We would initially expect the trans isomer would be the more stable since the bulky PCl3 ligands are furthest away from each other however we can explain this special stabilisation in the cis isomer by looking at the trans interactions. In the cis isomer, the Cl ligands are trans to CO ligands (as opposed to other Cl ligands in the trans isomer) which are much better π-acceptors, thereby making the cis conformation more stable (this trans interaction stabilises the conformation more than it is destabilised by the steric clash of the bulky PCl3 ligands).
By increasing the L ligand size, say from chlorine to bromine ligands or even from chlorine to triphenyl phosphine, we are increasing the steric clash in the cis isomer, thus destabilising it relative to the trans isomer. In this case, a larger L ligand would bring about increased stability in the trans conformation. Cotton et al reported the ease of isomerisation of the cis-Mo(CO)4(PR3)2 to trans-Mo(CO)4(PR3)2. Therefore, for cis-Mo(CO)4(PPh3)2 "steric forces actually overcome that part of the primary bonding forces within the molecule that tend to minimise the number of trans CO pairs" i.e. the PPh3 ligand is bulky enough to destabilise the cis relative to trans isomer!
Vibrational Frequency Analysis
Frequency analysis was performed on the cis and trans molybdenum isomers to confirm the optimised structures obtained were the energy minima (i.e. the lowest energy isomer possible, via calculation of the second derivative). Moreover, we were able to find out how many carbonyl vibrational bands could be found for each complex. We expected four bands for the cis isomer, and only one band for the trans isomer. The same method and basis sets were applied to the calculation to ensure that results could match accordingly.
Frequency analysis of cis-isomer
Frequency analysis of trans-isomer
Table 8 below shows the calculated frequencies for both sets of isomers that are in the low frequency region. Moreover, the .log files for both sets of calculations were examined to ensure that all low frequencies were positive so as to ensure that optimisation was to the minimum energy. As we will see, each isomer has two vibrations, both of which are low frequency vibrations (for both isomers) occurring at very low intensities. The low frequency vibrations correspond to bond movements (wagging) in the PCl3 ligands and at room temperature we know these vibrations would occur as they are low frequency therefore very little energy is required to produce them. These movements are marked by the blue arrows and the molecule has been rotated so that we can see the majority of these displacement vetors:
| Isomer | "Form of the low frequency vibration" | Frequency/cm-1 | Intensity |
|---|---|---|---|
 |
|||
 |
|||
 |
|||
 |
Tables 9 and 10 corresponds to the tabulated computed IR frequencies for the carbonyl ligand in the cis and trans isomers respectively:
| Frequency / cm-1 | Intensity | Literature Frequency[7] / cm-1 |
|---|---|---|
| 1946 | 768 | 1899 |
| 1949 | 1494 | 1905 |
| 1959 | 629 | 1922 |
| 2023 | 601 | 2019 |
| Frequency / cm-1 | Intensity | Literature Frequency [7] / cm-1 |
|---|---|---|
| 1950 | 1475 | 1895 |
| 1951 | 1467 | 1895 |
| 1977 | 0.7 | - |
| 2031 | 4 | - |


Comparison of the computed frequencies with those proposed by Cotton and co-workers[7] shows fairly good correlation, considering that Cotton and his co-workers were characterising the molybdenum complex with PPh3 ligands instead of the ones we have used here (PCl3). Moreover we can attribute some of the discrepancies to possible errors in the computational method (too low a basis set being used as not enough time, approximations that were made, or simple Gaussian error).
According to the literature values, we expect to obtain four carbonyl stretches for the cis isomer and only one carbonyl stretch for the trans (1895 cm-1). The IR spectra of the two respective isomers (Figure 9 and 10) show, along with out computed values from tables 9 and 10, that there are four vibrational C=O stretches for the cis isomer (all all vibrations are IR active due to the asymmetry present) and two stretches for the trans isomer. Thus our trans isomer has two IR inactive vibrations (close to zero intensity) and two vibrations are virtually the same frequency occurring at fairly similar intensities. These are in fact degenerate due to the symmetry in the trans-isomer (which is not present in the cis, therefore these peaks are not degenerate on the cis spectrum) thus we just about see two peaks on the spectrum but they are fairly overlapping and occur so close together that we assume it is just one degenerate peak.
Mini Project - Exploring bonding in main group halides
Introduction
For my mini project, I wanted to explore the bonding in main group halides, in particular by exploring the bonding of Aluminium halide dimers. We know that the BH3 molecule is electron deficient and likes to dimerise to form B2H6. We know that this structure consists of two bridging hydrogens that link the borons from each side and a set of two terminal hydrogen atoms bonded to each boron. This creates a three-centre-four-electron interaction that is one of the chemical phenomena that we will look at later.
A similar situation exists for the AlCl3 monomer. The aluminium is also electron deficient and therefore the molecule dimerises to form Al2Cl6. The structure of this dimer is shown in Figure 12.

Now, we can look at the effect of halide substitution into each dimer. Using computational methods, we can analyse the Al2Cl6 dimer and look at the effect if we replace two of the chlorine atoms with two bromine atoms to form a dimer Al2Cl4Br2. This dimer has four conformers which are shown in Figure 13-16 respectively. We can see that the bromines can take up bridging positions, leaving the four chlorides as terminal, or they could take geminal conformation (where both bromines are on the same atom) or a cis and trans conformation. Moreover, we can replace a further two chlorines with bromines to form the dimer Al2Cl2Br4, this structure is shown in Figure 17. Only this conformer of this dimer will be investigated.
 |
 |
 |
 |

I want to investigate which of these conformations is the most stable - whether the bromine atoms prefer one end of the molecule, or the most stable conformation is when both are in the bridging position or whether they prefer to be on the different sides. This will be studied through the use of Gaussian optimisations, frequency analysis and molecular orbital and natural bond orbital analysis. We will also look at the effect of the bromine atoms on the vibrational spectra and be able to see what the molecular orbitals look like.
Optimisation
Optimisation would allow us to find the most stable configuration for each dimer but also allow us to compare the energies of each dimer so we could prove which is the most stable. This would allow us to partially assess the effect of the bromine atoms on the final energy, the relative energy and the geometry around each aluminium, chlorine and bromine atom.
The six dimers were optimised using Gaussian and the method B3LYP and basis set 6-31G. This basis set can be used as the molecule are not too big, but due to the size of the bromines, the calculation with the 3-21G basis set would take far too long. It was necessary to set the maximum number of cycles to 50, so that each calculation would converge in a shorter space of time. Table 11 shows the energy and geometry values obtained for each optimised dimer structure.
| Dimer | Al2Cl6 | Al2Cl4Br2 (bridging) | Al2Cl4Br2 (geminal) | Al2Cl4Br2 (cis) | Al2Cl4Br2 (trans) | Al2Cl2Br4 |
|---|---|---|---|---|---|---|
| 3D Optimised structure | ||||||
| Energy / a.u. | -3246.32 | -7469.13 | -7469.13 | -7469.13 | -7469.13 | -11691.94 |
| Energy / kJmol-1 | -8.52x10⁶ | -19.6x10⁶ | -19.6x10⁶ | -19.6x10⁶ | -19.6x10⁶ | -30.7x10⁶ |
| Terminal Al-Cl Bond Length (Å) | 2.17 | 2.18 | 2.17 | 2.17 | 2.17 | - |
| Bridging Al-Cl Bond Length (Å) | 2.41 | - | 2.40, 2.42 | 2.41 | 2.41 | 2.41 |
| Terminal Al-Br Bond Length (Å) | - | - | 2.29 | 2.29 | 2.29 | 2.29 |
| Bridging Al-Br Bond Length (Å) | - | 2.52 | - | - | - | - |
| Terminal Bond angle (°) | 123.3 | 123 | 122.5 (Cl-Al-Cl), 129.0 (Br-Al-Br) | 125.7 | 125.7 | 128.1 |
| Bridge Bond angle (°) | 93.6 | 89.6 | 92.8 | 92.5 | 92.8 | 92.0 |
| DOI for calculation | DOI:10042/to-7932 | DOI:10042/to-7934 | DOI:10042/to-7935 | DOI:10042/to-7937 | DOI:10042/to-7936 | DOI:[1] |
The energy in atomic units or Hartrees, which is conventially given in 2 decimal places rounds to the same value for geminal, bridging, cis and trans dimers, thus Table 12 shows the energies in their full value. No rounding up or down will occur here (values in full figures, no significant figures or decimal places rounding applied) so that full comparison can be made. This is unorthodox however allows a full comparison of the energies to be made in order to identify the lowest energy dimer. The table includes a difference in energy relative to the lowest energy dimer:
| Dimer | Al2Cl4Br2 (bridging) | Al2Cl4Br2 (geminal) | Al2Cl4Br2 (cis) | Al2Cl4Br2 (trans) |
|---|---|---|---|---|
| Energy / a.u. | ||||
| Energy / kJmol-1 | ||||
| Difference in energy relative to lowest energy dimer / kJmol-1 (3sf) |
| Dimer | Dipole moment / Debye |
|---|---|
The 3D models of the optmised structures show that each dimer, very much like the B2H6 molecule, optimises to a structure with two bridging atoms and two sets of terminal atoms, with a D3h point group, as reported by Aarset and co-workers.[8]
Comparison of the energies shows that the replacement of two chlorine atoms by two bromine atoms has a largely stabilising effect. In the case of adding two bromine atoms, we are lowering the energy of the dimer. A lower, more negative energy means a more stable structure, therefore we are greatly stabilising the dimer with two bromine and four chlorine atoms relative to the dimer with six chlorines. As shown, if we were to replace a further two chlorine atoms with two bromines, the energy of this Al2Cl4Br2 dimer is even lower and this dimer is even more stable relative to the others. Closer analysis of the energy values evaluates that the cis form of the Al2Cl4Br2 dimer is the lowest energy and therefore most stable conformation, followed by the trans, followed by the dimer with bromines in the bridging position, followed by the geminal (in that repective order). For the dimer Al2Cl6, Mains and co-workers reported an energy of -3241.18 which is quite consistent with our computed value.[9]
In general, the bridging bond length is shorter than a terminal (outer bond) bond length since the bridging bonds involve 3-centre-4-electron interactions. As a result, the 3 centres (two Al and one halogen bridging atom) have greater electron demand for the four electrons, so the electron cloud is more diffuse and spread over the 3 centres (rather than two for a terminal bond). As a result, the bonds are weaker and therefore longer. Furthermore, Al-Cl bonds were found to be shorter than Al-Br bonds (by about 0.12Å) because Al-Cl bonds are stronger bonds, due to better orbital overlap (the Cl orbitals are less diffuse allowing for more efficient orbital overlap).
The value obtained for the terminal Al-Cl bond length of 2.17Å agreed fairly well with the literature value 2.08Å reported by Hadipour and Elmi when reporting the results from the ab initio HF/6-311G optimisation of the Al2Cl6 dimer[10]. Moreover, our bridging Al-Cl bond length of 2.41Å and bridging Al-Cl-Al bond angle of 93.6° is a little longer than the reported 2.28Å and 89.3°.[10] Discrepancies in these values (our bond lengths are a little higher) could possibly be attributed to the method and basis set used. Hadipour and Elmi used the Hartree Fock method with a 6-311G basis set whereas we used a DFT-B3LYP method with a basis set 6-31G. If we consider the slight difference in basis set (thereby attaining a slight energy difference in scale) then we can assume the results fit well to the literature. From the same paper, we were able to obtain the terminal Al-Br bond length (2.24Å)[10], bridging Al-Br bond (2.45Å)[10] and bridging Al-Br-Al bond angle (90°)[10] which correlate well with our values of 2.29Å, 2.51Å and 89.6 respectively. We must bear in mind that Hadipour and Elmi obtained the Al-Br type bond lengths and angles from optimisation of the Al2Br6 but as our results show, addition of two more bromines to form Al2Cl2Br4 does not alter the bond length so we assume the bond length for Al2Br6 can be comparable to our results.
Frequency analysis
Frequency analysis was performed in order to confirm that each optimisation had reached the minima. The same method and basis set were utilised.
The DOI links for each calculation (for the six dimers) are here:
The obtained IR Spectra of all six dimers are shown below:
Comparing our results to the literature[8] we can see that some of our stretches appear close to literature values. Al-Br stretches appear at a lower frequency since these bonds are weaker. For the Al2Cl4Br2 and Al2Cl2Br4 dimers, the observed stretches at 595, 506 cm-1 and 595, 560, 506 cm-1 respectively appear according to the literature[11]
Molecular orbital analysis
Molecular orbital analysis was performed on the Al2Cl6 and cis-Al2Cl4Br2 dimers respectively and compared to literature. The method used was still the same as in the optimisation, and full NBO analysis was also ensured to take place so that the MOs would compute.
| Homo -3 |  |
 |
|---|---|---|
| Homo -2 |  |
 |
| Homo -1 |  |
 |
| Homo |  |
 |
| Lumo |  |
 |
| Lumo +1 |  |
 |
| Lumo +2 |  |
 |
| Lumo +3 |  |
 |
The dimer Al2Cl6 which has D2h symmetry comprises 24 occupied valence orbitals, of which 8 are shown (HOMO-3, HOMO-2, HOMO-1, HOMO, LUMO, LUMO+1, LUMO+2, LUMO+3). The lower lying orbitals are comprised of mainly halide s contribution. Orbitals higher up show more contribution from the terminal halide and are non-bonding MOs. We can see that the HOMO-3 for Al2Cl6 consists entirely of terminal chlorine contribution (no electron density can be seen above the bridging chlorines). HOMO-1 and HOMO MOs show the terminal chlorine contribution and a combination of terminal and bridging chlorine contribution in the xy plane for both. This pattern for the HOMO-1 MOs, which has 3b1g symmetry and is non-bonding, was reported by Whitehead and Berksoy on the wavefunction contour diagram of the non-bonding terminal chlorine 3b1g orbital on the xy plane.[12] Moreover they computed charge density plots which show the position of the electron density for the dimer. They reported that the electron density was most dense at the Al and Cl and becomes less dense away from the positions of the nuclei. In our computed MOs, we cannot see any electron density above the Al atoms until the LUMO and higher where here the aluminium p-orbitals are combining with chlorine p-orbitals to form the MO. The LUMO, LUMO+1, LUMO+2 and LUMO+3 show greater contribution from the Al rather than chlorines (terminal or bridging) and this is because aluminium is less electronegative than chlorine so at the energy where these MOs are located, the aluminium p-orbitals (which are higher in energy than chlorine p-orbitals) are contributing greater to the bonding in the molecular orbital.
We can compare the orbitals of the dimer Al2Cl6 to the cis-Al2Cl4Br2 dimer. We can see that comparing the HOMOs, the bromine orbitals are more diffuse relative to the chlorine orbitals as bromine is a larger atom and is also less electronegative so has a greater, less polarised electron cloud.
Conclusion
In conclusion, through optimisation we see that addition of bromine to the Al2<Cl6 complex has an overall stabilising effect. We can link this to the fact that bromines are less electronegative so this relieves the electron deficiency on the aluminium compared with if six chlorines were present, making the aluminium seem more electron deficient and therefore more reactive towards further dimerisation to form even more branched dimers. Frequency analysis was utilised to show the vibrational stretches and show that the optimisations had reached the minimum stage and using the molecular orbitals, we were able to show the bonding in the dimers and the principle areas of electron density and bond interactions.
The above project simply proved that computational chemistry is a valuable tool for being able to observe bonding and structure and distinguish between stable structures. Aluminium trihalide dimers are very difficult to observe on IR spectra due to their reactive nature so it was useful to observe this by computational means.
Evaluation
References
- ↑ http://www.huntresearchgroup.org.uk/teaching/teaching_comp_lab_year3/3b_understand_opt.html
- ↑ W.W.Porterfield, M.E.Jones, K.Wade, Journal of Inorganic Chemistry, 1990, 29, (16), pp 2919-2923 :DOI:10.1021/ic00341a012
- ↑ J.Blixt, J.Glaser et al, J. Am. Chem. Soc., 1995, 117 (18), pp 5089–5104 :DOI:10.1021/ja00123a011
- ↑ F.A.Cotton, D.J.Darensbourg, S.Klein, B.W.S.Kolthammer, Inorg. Chem., 21, (1982), p294-299 :DOI:10.1021/ic00131a055
- ↑ http://www.huntresearchgroup.org.uk/teaching/teaching_comp_lab_year3/10b_MoC4L2_opt.html
- ↑ G. Hogarth, T. Norman, Inorganica Chimica Acta, 1997, '254', 167-171 DOI:10.1016/S0020-1693(96)05133-X
- ↑ 7.0 7.1 7.2 F. A. Cotton et al, J. Inorg. Chem, 1982, 21, 2661-2666 DOI:10.1021/ic00137a026
- ↑ 8.0 8.1 K.Aarset et al, J. Phys. Chem. A, 1999, 103 (11), pp 1644–1652 DOI:10.1021/jp9842042
- ↑ G.J.Mains et al, J. Phys. Chem. A, 2001, 105 (17), pp 4371–4378 DOI:10.1021/jp004549w
- ↑ 10.0 10.1 10.2 10.3 10.4 N.L.Hadipour, F.Elmi, Chemical Physics Letters, (2003), 371, pp 56–61 DOI:doi:10.1016/S0009-2614(03)00005-8
- ↑ M.I.Shilina et al, Journal of Molecular Catalysis A: Chemical, (1999) 146, 1-2, pp 335-341
- ↑ M.A.Whitehead, E.M.Berksoy, ‘’J. Chem. Soc.’’, Faraday Trans. 2, ‘’’1988’’’, 84(10), pp 1707-1717


