Rep:Mod2:BMWWiki
Benjamin Wild Wiki, Module 2
Sacred cows make the best hamburger.
--Mark Twain
BH3
GaussView Optimisation
Using GaussView 5.0.9, BH3 was optimised in the trigonal planar geometry with bonds set to 1.5Å to allow optimisation techniques to find the correct bond. To the right you can see the results obtained using the calculation type and basis sets named in the table. 3-21G is the basis set used, and is a relatively low level basis set which results in fast computation. This is adequate for BH3 optimisation as it is a simple molecule and was placed in the configuration sought after prior to optimisation.
These results show the correct point group for BH3, the correct bond lengths and angles in comparison to the literature (1.19001Å and 120° degrees respectively[1]). It can also be seen from the gradient that there is a close match to a stationary point (the optimisation searches for a gradient of zero for the first derivative). The dipole moment calculated is zero showing that all atoms and bonds are equally located away from one another.
By looking into the log file output from the Gaussian optimisation sent to SCAN, it could be seen that the optimisation had followed through to completion as it stated that there had been full convergence (below).
Item               Value     Threshold  Converged?
 Maximum Force            0.000413     0.000450     YES
 RMS     Force            0.000271     0.000300     YES
 Maximum Displacement     0.001610     0.001800     YES
 RMS     Displacement     0.001054     0.001200     YES
 Predicted change in Energy=-1.071764D-06
 Optimization completed.
    -- Stationary point found.
By looking again at the log file, it can be seen that the calculated RMS gradients are all below 0.001 showing that a stationary point has been reached (showing the molecule's energy has reached a level of optimisation).
                           ----------------------------
                           !   Optimized Parameters   !
                           ! (Angstroms and Degrees)  !
 --------------------------                            --------------------------
 ! Name  Definition              Value          Derivative Info.                !
 --------------------------------------------------------------------------------
 ! R1    R(1,2)                  1.1935         -DE/DX =    0.0004              !
 ! R2    R(1,3)                  1.1935         -DE/DX =    0.0004              !
 ! R3    R(1,4)                  1.1935         -DE/DX =    0.0004              !
 ! A1    A(2,1,3)              120.0            -DE/DX =    0.0                 !
 ! A2    A(2,1,4)              120.0            -DE/DX =    0.0                 !
 ! A3    A(3,1,4)              120.0            -DE/DX =    0.0                 !
 ! D1    D(2,1,4,3)            180.0            -DE/DX =    0.0                 !
 --------------------------------------------------------------------------------
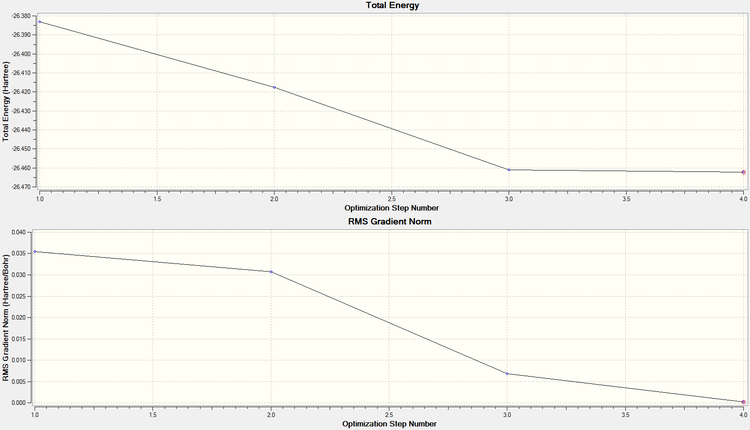
In order to check that the stationary point is in fact a minimum (rather than a maximum/ inflection point), the graphs of optimisation step number against RMS gradient, and energy were looked at. From these, it can be seen that 4 steps were taken to minimise the energy, and by the 4th step it can be seen from the RMS gradient graph (showing the first derivative of the energy graph) that a low enough value is reached (below 0.001) to warrant no further calculations.
Definition for existence of a bond:
Vibrational results for BH3
| No | Form of vibration | Frequency | Intensity | Symmetry D3h point group |
No | Form of vibration | Frequency | Intensity | Symmetry D3h point group |
|---|---|---|---|---|---|---|---|---|---|
| 1 |  Animation of Vibration at 1144 Wag (umbrella motion) |
1144 | 92.9 | A" | 4 |  Animation of Vibration at 2598 Symmetric stretch |
2598 | 0.00 | A' |
| 2 |  Animation of Vibration at 1203 Scissor |
1203 | 12.3 | E' | 5 |  Animation of Vibration at 2737 Asymmetric stretch |
2737 | 104 | E' |
| 3 |  Animation of Vibration at 1203 Rock |
1203 | 12.3 | E' | 6 |  Animation of Vibration at 2737 Asymmetric stretch |
2737 | 104 | E' |
By performing vibrational analysis on the optimised BH3 molecule, it can be seen if it is a transition state or a ground state conformation of the molecule. It does this by acting as a calculator of the second derivative: negative frequencies produced relate to optimisation of a transition state; positive frequencies relate to a ground state (as shown here).
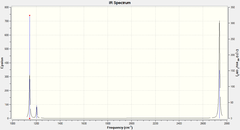
Looking at the IR spectrum generated (above), it can be seen that there are only 3 peaks, which is counter-intuitive when you think about the different vibration modes produced by BH3. Vibration mode 4 has an intensity of 0 as it does not involve a change in dipole moment, as is easily accounted for. There is also degeneracy between 2&3 and 5&6, which works to intensify these peaks. This justification compares well with the IR spectrum output
MO results for BH3[2]
Molecular orbitals were calculated using a Gaussian calculation which calculated energy and took into account NBO's by using the DFT/B3LYP method and 6-31G basis set (providing a limited accuracy). The molecular orbitals calculated are shown in the below table, with the graphical representations output also displayed on a molecular orbital diagram (equivalent to the output molecular orbitals).
 |
|
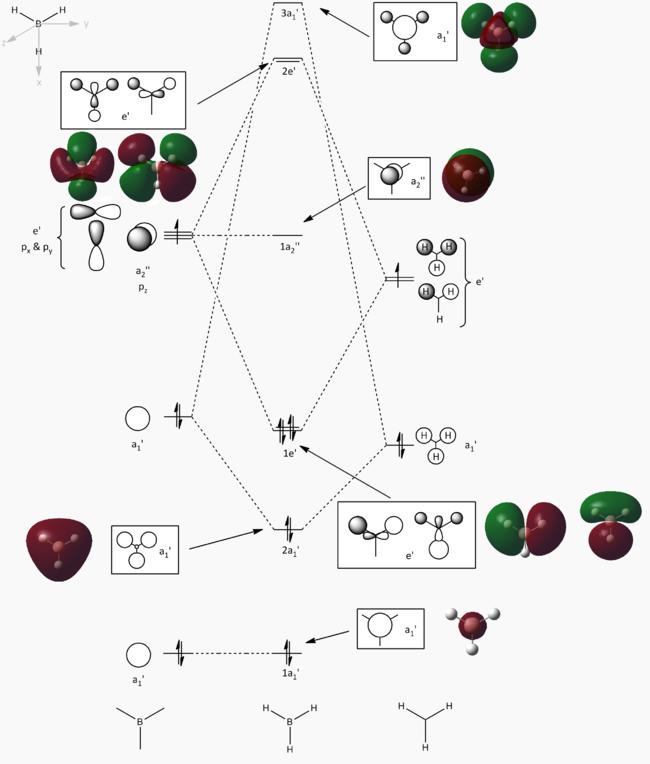 |
The 1s orbital on B has been assumed to be too low in energy to take part in bonding interactions within BH3, and so has had no further stabilisation. From Dr. Hunt's second year course, it was possible to construct a molecular orbital diagram. The diagram initially constructed would have placed the 3a1' orbital below the 2e' orbitals, however the calculation performed placed the 3a1' orbital above the 2e' orbitals (this has been reflected in the molecular orbital diagram above). The rest of the molecular orbitals calculated do seem to correlate to what is expected, and the fact that most reactivity of a molecule is via their HOMO and LUMO orbitals, the calculation can be taken as accurate.
By viewing the shapes of the real MOs in comparison to the LCAOs, it can be seen that there is a strong correlation between the orbitals. LCAO theory is however a qualitative approach to MO theory, and does not provide much information on the relative energies of the molecular orbitals. The computed "real" MOs on the other hand do provide accurate guidance to the energies of each level which is more useful for determining the stabilities of HOMOs and LUMOs.
NBO results for BH3
From the output file of the NBO calculation, the charge distributions in the BH3 molecule could be extracted (below). By loading file in GaussView, it was possible to graphically represent the charge distribution using colours (here, green is positive, red is negative). The molecule basically summarises the information displayed in the table.

 Summary of Natural Population Analysis:

                                       Natural Population
                Natural  -----------------------------------------------
    Atom  No    Charge         Core      Valence    Rydberg      Total
 -----------------------------------------------------------------------
      B    1    0.33161      1.99903     2.66935    0.00000     4.66839
      H    2   -0.11054      0.00000     1.11021    0.00032     1.11054
      H    3   -0.11054      0.00000     1.11021    0.00032     1.11054
      H    4   -0.11054      0.00000     1.11021    0.00032     1.11054
 =======================================================================
   * Total *    0.00000      1.99903     6.00000    0.00097     8.00000
The data seen here conforms with what is to be expected, with B being electron deficient due to it's low lying pz orbital (BH3 is a strong lewis acid), having a charge of 0.332. It can also be seen here that the charge distribution between the H atoms is equal, each having the same charge of -0.111. The charges all cancel to make the molecule neutral overall.
| Atom | Percentage contribution to bond |
Percentage s character |
Percentage p character |
|---|---|---|---|
| B | 44.48 | 33.33 | 66.66 |
| H | 55.52 | 100.00 | 0.00 |
| LP* | - | 100.00 | 0.00 |
There are three bonds in the BH3 molecule, each of which are equal. From the .log of the NBO, bond contributions can analysed. The table to the right summarises the results for BH3. The output file shows that that the first three NBO's are of equal bond orbital contributions for each B-H bond. 44.48% of each B-H bond is of B contribution, the remaining being H contribution. Each B contributes 33.33% from an s orbital, and 66.66% from a p orbital whereas H contributes 100% from an s orbital. There is no lone pair on B and so the vacant lone pair orbital (LP*) is calculated. This wrongly shows as 100% s contribution, when it should be 100% pz. This wrongly calculated donation could be due to the low level basis set used.
TlBr3
Pseudopotentials
Due to the large size of TlBr3, and its high number of electrons (151), in comparison to BH3, pseudopotentials are favoured so as to reduce costs with respect to the computation required. The pseudopotential models core orbitals of an atom, in the knowledge that core orbitals do not contribute heavily to bonding, and so the main computation is performed on the valence orbitals where most chemical bond occurs.
GaussView Optimisation
|
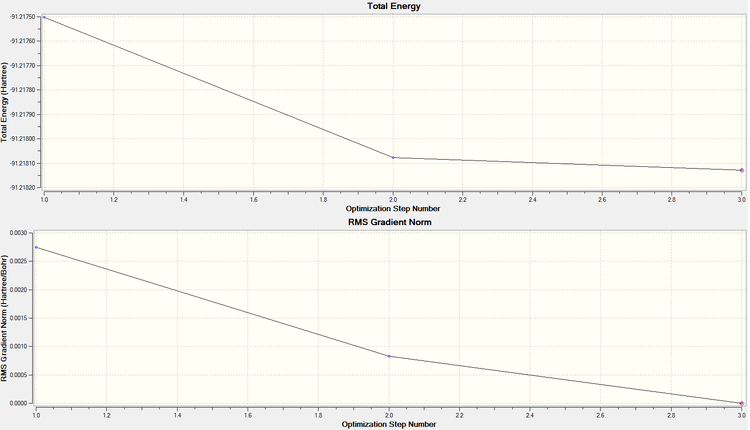 |
TlBr3 was locked in the D3h point group prior to sending to scan using the calculation types stated below so as to speed up the calculation, and to avoid the possibility of the optimisation leading to a false minima. A summary of of the results obtained from the calculation is shown on the right.
From these results, it can be seen that a stationary point has been reached (and because it had been locked in D3h, we know it is a minimum). The graphs to the right show that it took three steps to optimise the molecule fully. Also, in comparing the literature value for the bond distance (2.52Å[3]) to the one calculated, it can be seen that there is a relatively good agreement between the two.
From the below, taken from the output file, one can see that there was full convergence, and an RMS gradient below 0.001 was found. Frequency analysis will confirm whether or not this is a global minimum.
         Item               Value     Threshold  Converged?
 Maximum Force            0.000002     0.000450     YES
 RMS     Force            0.000001     0.000300     YES
 Maximum Displacement     0.000022     0.001800     YES
 RMS     Displacement     0.000011     0.001200     YES
 Predicted change in Energy=-5.660901D-11
 Optimization completed.
    -- Stationary point found.
Vibrational results for TlBr3
| No | Form of vibration | Frequency | Intensity | Symmetry D3h point group |
No | Form of vibration | Frequency | Intensity | Symmetry D3h point group |
|---|---|---|---|---|---|---|---|---|---|
| 1 |  Animation of Vibration at 46.43 Scissor |
46.43 | 3.69 | E' | 4 |  Animation of Vibration at 165.3 Symmetric stretch |
165.3 | 0.00 | A1' |
| 2 |  Animation of Vibration at 46.43 Rock |
46.43 | 3.69 | E' | 5 |  Animation of Vibration at 210.7 Asymmetric stretch |
210.7 | 25.5 | E' |
| 3 |  Animation of Vibration at 52.14 Wag (umbrella) |
52.14 | 5.85 | A2" | 6 |  Animation of Vibration at 210.7 Asymmetric stretch |
210.7 | 25.5 | E' |
As with BH3, it can be seen from vibrational analysis that ground state configuration of TlBr3 has been obtained (there are no negative frequencies in the below IR spectrum).

Again, there are only 3 peaks, even though there are 6 recorded vibrations in TlBr3. The symmetric stretch can again be accounted for (4 - no change in dipole moment). There is also degeneracy with 1&2 and 5&6, intensifying these peaks.
Below are the reported low frequencies from the output file. Although there are some frequencies below 0, they are no larger in magnitude than -10 and so can neglected. The lowest real frequency is at 46.43.
 Low frequencies -- -3.4213   -0.0026
                    -0.0004   0.0015
                     3.9367    3.9367
 Low frequencies --  46.4289   46.4292
                     52.1449
Definition of a bond
Classically, chemists illustrate a bond as a physical linkage between two atoms, depicted as a solid line. This is a very simplistic approach, depicting the overlap of valence orbitals of each orbital, and the sharing of their electrons in a VSEPR type approach. From the quantum mechanics courses undertaken in 1st and 2nd years, we know that there are further intricacies to be taken into account when describing a bond. Quantum mechanics demonstrates that atoms have orbtials (electron density probabilities), which can overlap with another orbital of the same symmetry when positioned close enough to the other atom. The overlap of these orbitals forms a combined electron density, which is shared between the two atoms, providing stabilisation due to electrostatic attraction and having the nuclei rest at an inter-nuclear distance R. The weaker the bond is, the more electrons will be occupying orbitals with nodes present. In summary, a bond can be thought of as the probability of finding electrons located in an region located between two atoms (orbital).
Mo(CO)4(PCl3)2
Pseudopotentials were again used in the calculation of Mo(CO)4(PCl3)2's optimisation and the vibrational analysis. Initially, Mo(CO)4(PCl3)2 was optimised using the B3LYP method and pseudopotential basis set LANL2MB, with the optimisiation set to loose to obtain a fast, low level optimisation. This was done for the cis- and trans- isomers respectively.
Cis-Mo(CO)4(PCl3)2
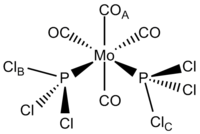
After optimisation with the low level pseudopotential mentioned earlier, the compound was altered to reduce the torsion between COA and ClB to 0°, and COA and ClC to 180° to ensure the correct minimum was obtained. The next method used was B3LYP with a LANL2DZ pseudopotential, and an increased electronic convergence (int=ultrafine scf=conver=9). Below is a table summarising these results.
| File Type | .log | .log |
|---|---|---|
| Calculation Type | FOPT | FOPT |
| Calculation Method | RB3LYP | RB3LYP |
| Basis Set | LANL2MB[4] | LANL2DZ[5] |
| Charge | 0 | 0 |
| Spin | Singlet | Singlet |
| Final Energy (RB3LYP)/a.u. |
-617.525 | -623.577 |
| RMS Gradient/a.u. | 9.95×10⁻⁵ | 7.57×10⁻⁶ |
| Dipole Moment | 8.46 | 1.31 |
| Bond | Calculated Bond Length |
Literature Bond Length |
|---|---|---|
| Mo-C | 2.06 | |
| C-O | 1.17 | |
| Mo-P | 2.51 | |
| P-Cl | 2.24 | |
| Bond | Calculated Angle |
Literature Angle |
| C-Mo-C | 87.1,89.7, 89.1,178.4 |
|
| P-Mo-C | 91.9,89.4, 89.2,176.1 |
You would expect C-Mo-C bond angles to be either 90° or 180°, and all P-Mo-C bond angles to be 90° or 180°. The results obtained are close to this, but there is a slight disparity which is likely to be due to the calculation method and basis set used being relatively low level, therefore having a reduced accuracy.
Trans-Mo(CO)4(PCl3)2
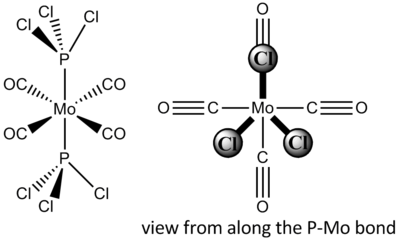
After optimisation with the low level pseudopotential mentioned earlier, the compound was altered to the view shown on the right (looking along the P-Mo bond) to ensure the correct minimum was obtained. The next method used was B3LYP with a LANL2DZ pseudopotential, and an increased electronic convergence (int=ultrafine scf=conver=9). Below is a table summarising these results.
| File Type | .log | .log |
|---|---|---|
| Calculation Type | FOPT | FOPT |
| Calculation Method | RB3LYP | RB3LYP |
| Basis Set | LANL2MB[6] | LANL2DZ[7] |
| Charge | 0 | 0 |
| Spin | Singlet | Singlet |
| Final Energy (RB3LYP)/a.u. |
-617.522 | -623.576 |
| RMS Gradient/a.u. | 1.13×10⁻⁴ | 2.79×10⁻⁵ |
| Dipole Moment | 0.00 | 0.305 |
| Bond | Calculated Bond Length |
Literature Bond Length |
|---|---|---|
| Mo-C | 2.06 | |
| C-O | 1.17 | |
| Mo-P | 2.44 | |
| P-Cl | 2.24 | |
| Bond | Calculated Angle |
Literature Angle |
| C-Mo-C | 90.5,89.5, 179.0 |
|
| P-Mo-C | 88.7,91.3, 90.0,90.0 |
You would expect C-Mo-C bond angles to be either 90° or 180°, and all P-Mo-C bond angles to be 90°. The results obtained are close to this, but there is a slight disparity which is likely to be due to the calculation method and basis set used being relatively low level, therefore having a reduced accuracy.
From the above results, the cis- isomer is shown to be slightly more stable than the trans- isomer (by 2.63 kJ/mol). The low energy difference between the two isomers allows isomerisation to occur at room temperature. This theory is backed up by isomerisation stated in the literature[8]. Some of this increased stability could be attributed to the trans- effect, which states that some ligands, when placed in the trans- position to another ligand, could become more destabilised than when placed trans- to another ligand. When both PR3 groups are trans- to each other, the compound is slightly more unstable than when placed in the cis- position. The CO groups have a smaller trans- effect than the PR3 groups, and so stabilise PR3 when placed trans- to them.
The preference for cis- over trans- is however not backed up by the results seen in the literature[9]. Literature places more emphasis on the steric clashing of PR3 groups in cis- position, which contributes to a greater instability in comparison to the trans- isomer. Ph3 is a larger R group that Cl, and using the basis set used above is more likely to provide results coinciding with literature. To improve the computation with PCl3 so as to conform with the literature, a higher basis set such as 6-311G(d,p) could be used.
Vibration results for Mo(CO)4(PCl3)2
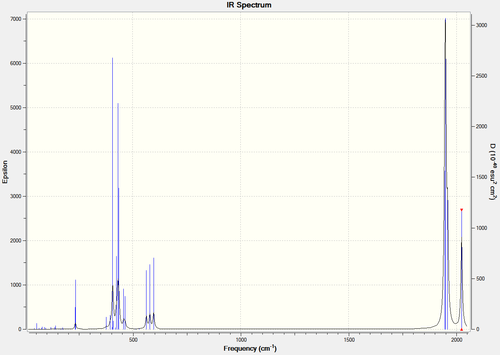
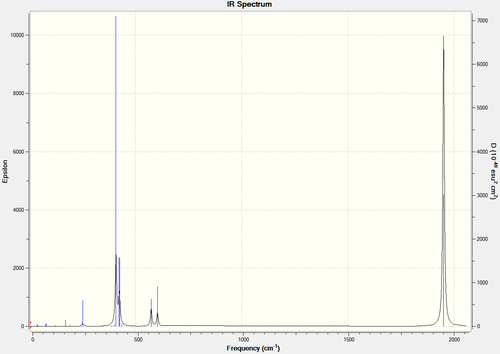
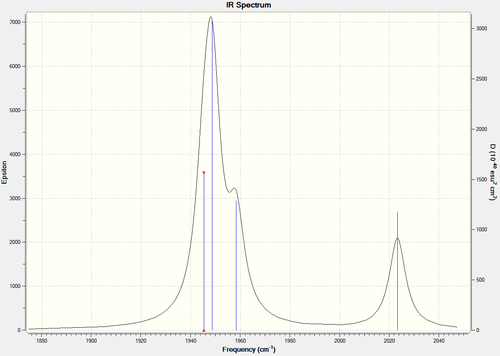
By comparing the IR spectra of each the cis- and trans- isomers, it can be seen that there are differences between the two, mainly attributed to the CO bonds. Below are the IR spectra of each, and also a magnified version of the CO region in each.
| Cis-(CO)4(PCl3)2[10] | Trans-(CO)4(PCl3)2[11] |
|---|---|
 |
 |
 |
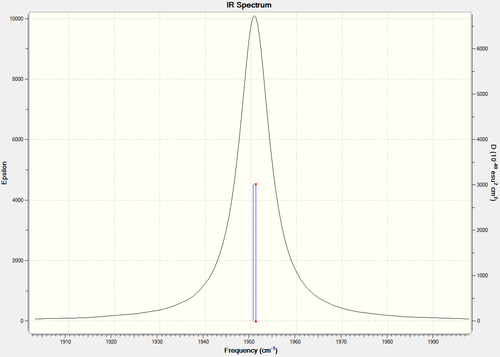 |
You would expect there to be two peaks for CO, due to the two types of CO present (axial and equatorial), however there are four CO vibrational modes in the cis- isomer (combined into two peaks): 1945, 1948, 1958, 2023. You would expect there to be one peak for CO, due to the axial only position of CO, however there are also four CO vibrational modes in the trans- isomer, which are all combined in one peak as they should be degenerate (due to the increased symmetry of the trans isomer): 1950, 1951, 1977, 2031. There is a slight lack of degeneracy in the vibrational modes (cis- should have two sets of degenerate CO vibrations, trans- one set of degenerate CO vibrations) which is likely to be due to inaccuracies with the calculation basis set used. Using a higher basis set would increase accuracy and is likely to to provide results more in the line of what is expected (if you look at the bond angles in the sections above, you can see that they are not perfect).
Mini-Project: Preference for bridging versus terminal ligands in magnesium dimers[12]
Outline
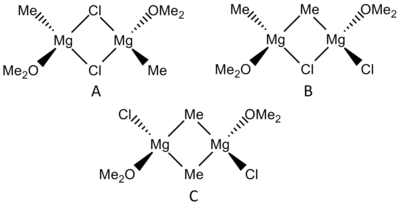
In this mini-project, I wish to investigate the relative stabilities of magnesium dimers (right) in order to determine the likelihood of observing the dimer at normal temperature and pressure. To do this, I will compare the molecular orbitals, natural bonding orbitals and vibrational data obtained from computational techniques. I will also look into how the bond lengths and dihedral angles in the dimers alter, giving further indication of their stability (long bonds with small angles would make the dimer more unstable). If there is sufficient time, I will also look into the NMR spectra of the compounds.
These three compounds have the same molecular formula, however differ in the positioning of either Cl or Me (isomers of each other). I would expect the stability to decrease A>C>B initially because of the loss of symmetry in B. Although A and C would have the same symmetry, I would expect A to be slightly more stable that C due to the fact that the hydrogens on the Me groups would invoke a greater level of steric hindrance in the already strained bridging ligand in comparison to Cl.
Results
The three dimers (A, B & C) where initially optimised using a Gaussian calculation with B3LYP as the method, and 6-31G as the basis set. After the initial optimisation, they were optimised once more, this time using 6-311G as the basis set, and scf=conver=9 in the keywords to increase the accuracy of the calculation. Below is a summary of the results.
| A[13] | B[14] | B*[15] | C[16] | C*[17] | |
|---|---|---|---|---|---|
| File Type | .log | .log | .log | .log | .log |
| Calculation Type | FOPT | FOPT | FOPT | FOPT | FOPT |
| Calculation Method | RB3LYP | UB3LYP | RB3LYP | RB3LYP | RB3LYP |
| Basis Set | 6-311G(d,p) | 6-311G(d,p) | 6-311G(d,p) | 6-311G(d,p) | 6-311G(d,p) |
| Charge | 0 | 0 | 0 | 0 | 0 |
| Spin | Singlet | Doublet | Singlet | Singlet | Singlet |
| Final Energy (RB3LYP)/a.u. |
-1710.908 | -1710.239 | -1710.901 | -1709.642 | -1710.898 |
| RMS Gradient/a.u. | 5.14×10⁻⁶ | 5.93×10⁻⁶ | 8.07×10⁻⁶ | 4.61×10⁻⁶ | 4.03×10⁻⁶ |
| Dipole Moment | 2.00×10⁻⁴ | 1.99 | 1.92 | 2.05×10⁻² | 1.97 |
| Bridging ligand bond lengths/Å |
Cl-Mg 2.464, 2.438, Cl-Mg 2.438, 2.464 |
Cl-Mg 2.411, 2.465 C-Mg 2.208, 2.281 |
Cl-Mg 2.469, 2.400 C-Mg 2.228, 2.288 |
C-Mg 2.115, 3.011, C-Mg 3.010, 2.115 |
C-Mg 2.251, 2.268, C-Mg 2.259, 2.259 |
| Dimers | Energy Difference/kJmol-1 |
|---|---|
| A & B* | 18.4 |
| A & C* | 26.3 |
| B* & C* | 7.9 |
As can be seen from the left table, a spin doublet has been produced in dimer B. The calculation method had also been set to UB3LYP (unrestricted). This led me to inspect the molecule that had been submitted more closely. Upon inspection I noticed that the bridging methyl group only had two hydrogens, rather than the required three. This was down to my eagerness to get the jobs submitted, and resulted in me not thinking carefully about how a bridging ligand coordinates. After recalling the material covered in last year's lecture courses, I realised that the bridging methyl should have three hydrogens as the bonding electron from carbon is shared between the two atoms (3c-2e). This also lead me to check the compound submitted for dimer C, finding that I had done the same here (putting only 2 hydrogens on bridging methyls). I altered the compounds in GaussView and then resubmitted them to SCAN, the summaries are marked in the table to the left under B* and C*.
The table to the left shows that the energy stabilities decrease A>B>C, which is counter to what was hypothesised. Although B has a reduced symmetry in comparison to C, it is now apparent that the lack of symmetry is not as large an energetic factor as the increased steric hindrance of the methyl bridging ligands. It could also be noted that because of the high electronegativity of chlorine in comparison to carbon, it is a better bridging ligand between strongly electrophilic metal centres. By looking into the NBO and MO data calculated, more clarity will hopefully be shed on this situation.
MO data
| Orbital | A | B | C |
|---|---|---|---|
| LUMO+3 | |||
| LUMO+2 | |||
| LUMO+1 | |||
| LUMO | |||
| HOMO | |||
| HOMO-1 | |||
| HOMO-2 | |||
| HOMO-3 | |||
| HOMO-4 | |||
| HOMO-5 | |||
| HOMO-6 | |||
| HOMO-7 | |||
| HOMO-8 | |||
| HOMO-9 | |||
| HOMO-10 |
Looking at the molecular orbitals produced by the 128 electron species A, B and C around the HOMO-LUMO region, it can be seen that their forms are rather complex and do not map closely to atomic orbitals. However, when comparing the HOMO and LUMO regions of each dimer some trends that confirm the relative stabilities of isomers in comparison to each other.
In comparing the HOMO regions of each, one can see that due to symmetry, dimer A has a greater stability in comparison to the others, and the fact that there is no clear preferred position for electrophilic attack. Dimer B has a large region of electron density located towards one end of the molecule, and due to the lack of symmetry in the molecule, it is clear that this results in less stability than A. Dimer C has a very high density of electrons located around the bridging methyl groups. Due to the close proximity of these groups, the size of the orbtials, and the nodes formed, C is the most unstable allowing for electrophilic attack into the most unstable region of the molecule (bridging bonds).
In comparing the LUMO regions of each dimer, it is again apparent that A has the most stability in comparison to the others due to symmetry. With such symmetry, there is no preferred position of nucleophilic attack. In comparison, there are clear regions of attack in B and C due to their orbital densities being located at one end of the dimer. C has a more clearly defined region, and is why it is less stable than B.
Looking at the energies of the HOMO and LUMO orbitals in each, it is apparent that these dimers are more susceptible to electrophilic attack due to the high energy of the HOMOs. The LUMOs are represented as bonding, however they are all very close to zero in their energetic value, therefore not particularly susceptible to nucleophilic attack.
Due to the fact that dimer A is the most stable of the three, I will look further into the molecular orbitals. Having looked from LUMO+3 - HOMO-10, I decided that there was not that much information to be gained, and so decided to look at lower lying molecular orbitals, and the point from which atomic orbitals move to molecular orbitals.
Upon inspecting the MOs calculated from the bottom up, it can be seen that up until level 29 (HOMO-35), the MOs represented are essentially AOs. Beauty in the symmetry of orbitals as one moves from level 29 and up can be viewed, further confirming why dimer A is the most stable of the dimers. Below I have selected an interesting orbital to look at in slightly more detail.
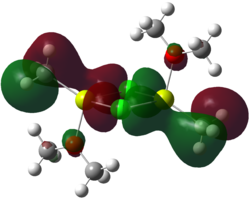
Here it can be seen that there is a strong overlap between the px orbital on chlorine, and the pz on the methyl group's carbon. There are two of these strong overlaps, and there is again symmetry in the molecule, and a center of inversion. Overlaps like this, help to stabilise the dimer and contribute to the thermodynamic preference of A over B and C. Another example of this type of stabilisation is shown in the HOMO-7, where again the px of Cl overlaps this time with the pz of O.
NBO data
| A[18] | B[19] | C[20] |
|---|---|---|
 |
 |
 |
 |
 |
 |
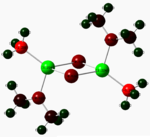
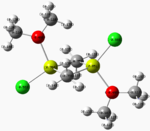
Electronegative groups in the above dimers (particularly oxygen and chlorine) act to cause an increased electron deficiency in the magnesium metal centres. This effectively increases the electron density around the non-metal atoms (more so about the aforementioned electronegative atoms) and further confirms the theory that these dimers are more susceptible to electrophilic attack than nucleophilic attack, and helps pin-point the possible regions of attack.
Bridging data for A:
    17. (1.97772) BD ( 1)Mg  18 -Cl  29
                (  7.32%)   0.2706*Mg  18 s( 23.92%)p 3.09( 73.87%)d 0.09(  2.21%)
                                            0.0000 -0.0009  0.4868 -0.0461  0.0060
                                           -0.0002  0.0005 -0.4353 -0.0306 -0.0084
                                           -0.0020  0.0005 -0.3602 -0.0233 -0.0116
                                           -0.0020 -0.0002 -0.6435 -0.0610  0.0019
                                           -0.0067  0.0673  0.1024  0.0773  0.0287
                                           -0.0174
                ( 92.68%)   0.9627*Cl  29 s( 28.10%)p 2.56( 71.82%)d 0.00(  0.08%)
                                            0.0000 -0.0001  0.5301 -0.0071 -0.0006
                                            0.0000  0.0001  0.6398 -0.0021 -0.0011
                                            0.0001  0.0000  0.3770 -0.0027 -0.0019
                                            0.0001  0.0000  0.4082  0.0029 -0.0022
                                           -0.0003  0.0090  0.0216  0.0135  0.0044
                                            0.0079
    18. (1.97651) BD ( 1)Mg  18 -Cl  30
                (  7.00%)   0.2647*Mg  18 s( 22.76%)p 3.30( 75.05%)d 0.10(  2.19%)
                                            0.0000 -0.0009  0.4740 -0.0531  0.0076
                                           -0.0001  0.0007 -0.3706 -0.0214 -0.0119
                                           -0.0025  0.0005 -0.2628 -0.0184 -0.0041
                                           -0.0006  0.0001  0.7339  0.0664 -0.0037
                                            0.0075  0.0417 -0.1158 -0.0713  0.0316
                                            0.0264
                ( 93.00%)   0.9643*Cl  30 s( 27.30%)p 2.66( 72.62%)d 0.00(  0.08%)
                                            0.0000 -0.0002  0.5225 -0.0060 -0.0005
                                            0.0000  0.0001  0.5888 -0.0038 -0.0014
                                            0.0001  0.0000  0.3106 -0.0012 -0.0008
                                            0.0001  0.0000 -0.5320 -0.0020  0.0022
                                            0.0004  0.0040 -0.0195 -0.0105  0.0029
                                            0.0158
    19. (1.97651) BD ( 1)Mg  19 -Cl  29
                (  7.00%)   0.2647*Mg  19 s( 22.76%)p 3.30( 75.05%)d 0.10(  2.19%)
                                            0.0000  0.0009 -0.4740  0.0531 -0.0076
                                            0.0001  0.0007 -0.3706 -0.0214 -0.0119
                                           -0.0025  0.0005 -0.2628 -0.0184 -0.0041
                                           -0.0006  0.0001  0.7339  0.0664 -0.0037
                                            0.0075 -0.0417  0.1158  0.0713 -0.0316
                                           -0.0264
                ( 93.00%)   0.9643*Cl  29 s( 27.30%)p 2.66( 72.62%)d 0.00(  0.08%)
                                            0.0000  0.0002 -0.5225  0.0060  0.0005
                                            0.0000  0.0001  0.5888 -0.0038 -0.0014
                                            0.0001  0.0000  0.3106 -0.0012 -0.0008
                                            0.0001  0.0000 -0.5320 -0.0020  0.0022
                                            0.0004 -0.0040  0.0195  0.0105 -0.0029
                                           -0.0158
    20. (1.97772) BD ( 1)Mg  19 -Cl  30
                (  7.32%)   0.2706*Mg  19 s( 23.92%)p 3.09( 73.87%)d 0.09(  2.21%)
                                            0.0000  0.0009 -0.4868  0.0461 -0.0060
                                            0.0002  0.0005 -0.4353 -0.0306 -0.0084
                                           -0.0020  0.0005 -0.3602 -0.0233 -0.0116
                                           -0.0020 -0.0002 -0.6435 -0.0610  0.0019
                                           -0.0067 -0.0673 -0.1024 -0.0773 -0.0287
                                            0.0174
                ( 92.68%)   0.9627*Cl  30 s( 28.10%)p 2.56( 71.82%)d 0.00(  0.08%)
                                            0.0000  0.0001 -0.5301  0.0071  0.0006
                                            0.0000  0.0001  0.6398 -0.0021 -0.0011
                                            0.0001  0.0000  0.3769 -0.0027 -0.0019
                                            0.0001  0.0000  0.4082  0.0029 -0.0022
                                           -0.0003 -0.0090 -0.0216 -0.0135 -0.0044
                                           -0.0079
   345. (0.04065) BD*( 1)Mg  18 -Cl  29
                ( 92.68%)   0.9627*Mg  18 s( 23.92%)p 3.09( 73.87%)d 0.09(  2.21%)
                                            0.0000 -0.0009  0.4868 -0.0461  0.0060
                                           -0.0002  0.0005 -0.4353 -0.0306 -0.0084
                                           -0.0020  0.0005 -0.3602 -0.0233 -0.0116
                                           -0.0020 -0.0002 -0.6435 -0.0610  0.0019
                                           -0.0067  0.0673  0.1024  0.0773  0.0287
                                           -0.0174
                (  7.32%)  -0.2706*Cl  29 s( 28.10%)p 2.56( 71.82%)d 0.00(  0.08%)
                                            0.0000 -0.0001  0.5301 -0.0071 -0.0006
                                            0.0000  0.0001  0.6398 -0.0021 -0.0011
                                            0.0001  0.0000  0.3770 -0.0027 -0.0019
                                            0.0001  0.0000  0.4082  0.0029 -0.0022
                                           -0.0003  0.0090  0.0216  0.0135  0.0044
                                            0.0079
   346. (0.04595) BD*( 1)Mg  18 -Cl  30
                ( 93.00%)   0.9643*Mg  18 s( 22.76%)p 3.30( 75.05%)d 0.10(  2.19%)
                                            0.0000 -0.0009  0.4740 -0.0531  0.0076
                                           -0.0001  0.0007 -0.3706 -0.0214 -0.0119
                                           -0.0025  0.0005 -0.2628 -0.0184 -0.0041
                                           -0.0006  0.0001  0.7339  0.0664 -0.0037
                                            0.0075  0.0417 -0.1158 -0.0713  0.0316
                                            0.0264
                (  7.00%)  -0.2647*Cl  30 s( 27.30%)p 2.66( 72.62%)d 0.00(  0.08%)
                                            0.0000 -0.0002  0.5225 -0.0060 -0.0005
                                            0.0000  0.0001  0.5888 -0.0038 -0.0014
                                            0.0001  0.0000  0.3106 -0.0012 -0.0008
                                            0.0001  0.0000 -0.5320 -0.0020  0.0022
                                            0.0004  0.0040 -0.0195 -0.0105  0.0029
                                            0.0158
   347. (0.04595) BD*( 1)Mg  19 -Cl  29
                ( 93.00%)   0.9643*Mg  19 s( 22.76%)p 3.30( 75.05%)d 0.10(  2.19%)
                                            0.0000  0.0009 -0.4740  0.0531 -0.0076
                                            0.0001  0.0007 -0.3706 -0.0214 -0.0119
                                           -0.0025  0.0005 -0.2628 -0.0184 -0.0041
                                           -0.0006  0.0001  0.7339  0.0664 -0.0037
                                            0.0075 -0.0417  0.1158  0.0713 -0.0316
                                           -0.0264
                (  7.00%)  -0.2647*Cl  29 s( 27.30%)p 2.66( 72.62%)d 0.00(  0.08%)
                                            0.0000  0.0002 -0.5225  0.0060  0.0005
                                            0.0000  0.0001  0.5888 -0.0038 -0.0014
                                            0.0001  0.0000  0.3106 -0.0012 -0.0008
                                            0.0001  0.0000 -0.5320 -0.0020  0.0022
                                            0.0004 -0.0040  0.0195  0.0105 -0.0029
                                           -0.0158
   348. (0.04065) BD*( 1)Mg  19 -Cl  30
                ( 92.68%)   0.9627*Mg  19 s( 23.92%)p 3.09( 73.87%)d 0.09(  2.21%)
                                            0.0000  0.0009 -0.4868  0.0461 -0.0060
                                            0.0002  0.0005 -0.4353 -0.0306 -0.0084
                                           -0.0020  0.0005 -0.3602 -0.0233 -0.0116
                                           -0.0020 -0.0002 -0.6435 -0.0610  0.0019
                                           -0.0067 -0.0673 -0.1024 -0.0773 -0.0287
                                            0.0174
                (  7.32%)  -0.2706*Cl  30 s( 28.10%)p 2.56( 71.82%)d 0.00(  0.08%)
                                            0.0000  0.0001 -0.5301  0.0071  0.0006
                                            0.0000  0.0001  0.6398 -0.0021 -0.0011
                                            0.0001  0.0000  0.3769 -0.0027 -0.0019
                                            0.0001  0.0000  0.4082  0.0029 -0.0022
                                           -0.0003 -0.0090 -0.0216 -0.0135 -0.0044
                                           -0.0079
Bridging data for B:
    13. (1.88189) BD ( 1)Mg  15 -Cl  25
                (  6.60%)   0.2569*Mg  15 s( 18.58%)p 4.32( 80.35%)d 0.06(  1.06%)
                                            0.0000 -0.0073  0.4293  0.0367  0.0108
                                           -0.0006 -0.0044  0.3740 -0.0080 -0.0085
                                            0.0029  0.0021 -0.2795 -0.0054  0.0043
                                           -0.0049 -0.0023  0.7650  0.0075  0.0090
                                           -0.0036 -0.0578  0.0698 -0.0410  0.0252
                                            0.0108
                ( 93.40%)   0.9664*Cl  25 s( 52.09%)p 0.92( 47.85%)d 0.00(  0.06%)
                                            0.0000  0.0001  0.7217 -0.0087 -0.0007
                                            0.0000 -0.0002 -0.0254  0.0004  0.0000
                                            0.0000  0.0001  0.1144 -0.0007 -0.0008
                                            0.0000  0.0001 -0.6817  0.0002  0.0041
                                            0.0005 -0.0078  0.0017 -0.0078  0.0050
                                            0.0211
    15. (1.83401) BD ( 1)Mg  15 - C  27
                (  8.61%)   0.2934*Mg  15 s( 30.53%)p 2.26( 69.08%)d 0.01(  0.39%)
                                            0.0000 -0.0068  0.5520 -0.0250 -0.0016
                                            0.0006 -0.0044  0.4665  0.0044 -0.0173
                                           -0.0062  0.0021 -0.2680 -0.0075  0.0117
                                            0.0049 -0.0015 -0.6315 -0.0304  0.0304
                                            0.0080 -0.0150 -0.0460  0.0179  0.0284
                                           -0.0198
                ( 91.39%)   0.9560* C  27 s( 36.52%)p 1.74( 63.47%)d 0.00(  0.01%)
                                            0.0000  0.6031 -0.0387  0.0000 -0.0133
                                           -0.0048  0.0007  0.0547  0.0042 -0.0009
                                            0.7920 -0.0649 -0.0007 -0.0073 -0.0010
                                            0.0031  0.0061  0.0002
   343. (0.09251) BD*( 1)Mg  15 -Cl  25
                ( 93.40%)   0.9664*Mg  15 s( 18.58%)p 4.32( 80.35%)d 0.06(  1.06%)
                                            0.0000 -0.0073  0.4293  0.0367  0.0108
                                           -0.0006 -0.0044  0.3740 -0.0080 -0.0085
                                            0.0029  0.0021 -0.2795 -0.0054  0.0043
                                           -0.0049 -0.0023  0.7650  0.0075  0.0090
                                           -0.0036 -0.0578  0.0698 -0.0410  0.0252
                                            0.0108
                (  6.60%)  -0.2569*Cl  25 s( 52.09%)p 0.92( 47.85%)d 0.00(  0.06%)
                                            0.0000  0.0001  0.7217 -0.0087 -0.0007
                                            0.0000 -0.0002 -0.0254  0.0004  0.0000
                                            0.0000  0.0001  0.1144 -0.0007 -0.0008
                                            0.0000  0.0001 -0.6817  0.0002  0.0041
                                            0.0005 -0.0078  0.0017 -0.0078  0.0050
                                            0.0211
   345. (0.06300) BD*( 1)Mg  15 - C  27
                ( 91.39%)   0.9560*Mg  15 s( 30.53%)p 2.26( 69.08%)d 0.01(  0.39%)
                                            0.0000 -0.0068  0.5520 -0.0250 -0.0016
                                            0.0006 -0.0044  0.4665  0.0044 -0.0173
                                           -0.0062  0.0021 -0.2680 -0.0075  0.0117
                                            0.0049 -0.0015 -0.6315 -0.0304  0.0304
                                            0.0080 -0.0150 -0.0460  0.0179  0.0284
                                           -0.0198
                (  8.61%)  -0.2934* C  27 s( 36.52%)p 1.74( 63.47%)d 0.00(  0.01%)
                                            0.0000  0.6031 -0.0387  0.0000 -0.0133
                                           -0.0048  0.0007  0.0547  0.0042 -0.0009
                                            0.7920 -0.0649 -0.0007 -0.0073 -0.0010
                                            0.0031  0.0061  0.0002
Bridging data for C:
    10. (1.81181) BD ( 1)Mg  11 - C  21
                (  8.21%)   0.2865*Mg  11 s( 25.42%)p 2.92( 74.25%)d 0.01(  0.33%)
                                           -0.0001 -0.0115  0.5038 -0.0133  0.0052
                                            0.0002  0.0060 -0.4375  0.0112  0.0129
                                           -0.0015  0.0020 -0.2350  0.0070  0.0093
                                            0.0013  0.0001 -0.6997  0.0447  0.0616
                                            0.0093  0.0289  0.0304  0.0101  0.0375
                                           -0.0004
                ( 91.79%)   0.9581* C  21 s( 36.69%)p 1.73( 63.30%)d 0.00(  0.01%)
                                           -0.0001  0.6044 -0.0393 -0.0001  0.0020
                                            0.0042  0.0000  0.0785  0.0015 -0.0010
                                            0.7890 -0.0663 -0.0005  0.0052 -0.0006
                                            0.0036  0.0063  0.0030
    11. (1.81214) BD ( 1)Mg  11 - C  25
                (  8.21%)   0.2865*Mg  11 s( 24.87%)p 3.01( 74.75%)d 0.02(  0.38%)
                                            0.0001  0.0113 -0.4985 -0.0071  0.0020
                                           -0.0001 -0.0060  0.4537 -0.0061 -0.0105
                                           -0.0005 -0.0020  0.2006 -0.0172 -0.0092
                                            0.0034 -0.0001 -0.7037  0.0409  0.0624
                                            0.0106 -0.0228  0.0285  0.0247 -0.0337
                                            0.0269
                ( 91.79%)   0.9581* C  25 s( 36.69%)p 1.73( 63.30%)d 0.00(  0.01%)
                                            0.0001 -0.6045  0.0387  0.0001 -0.0158
                                           -0.0006  0.0004 -0.0379  0.0105 -0.0010
                                            0.7918 -0.0656 -0.0007 -0.0044  0.0004
                                           -0.0019 -0.0068 -0.0038
   340. (0.07251) BD*( 1)Mg  11 - C  21
                ( 91.79%)   0.9581*Mg  11 s( 25.42%)p 2.92( 74.25%)d 0.01(  0.33%)
                                           -0.0001 -0.0115  0.5038 -0.0133  0.0052
                                            0.0002  0.0060 -0.4375  0.0112  0.0129
                                           -0.0015  0.0020 -0.2350  0.0070  0.0093
                                            0.0013  0.0001 -0.6997  0.0447  0.0616
                                            0.0093  0.0289  0.0304  0.0101  0.0375
                                           -0.0004
                (  8.21%)  -0.2865* C  21 s( 36.69%)p 1.73( 63.30%)d 0.00(  0.01%)
                                           -0.0001  0.6044 -0.0393 -0.0001  0.0020
                                            0.0042  0.0000  0.0785  0.0015 -0.0010
                                            0.7890 -0.0663 -0.0005  0.0052 -0.0006
                                            0.0036  0.0063  0.0030
   341. (0.07310) BD*( 1)Mg  11 - C  25
                ( 91.79%)   0.9581*Mg  11 s( 24.87%)p 3.01( 74.75%)d 0.02(  0.38%)
                                            0.0001  0.0113 -0.4985 -0.0071  0.0020
                                           -0.0001 -0.0060  0.4537 -0.0061 -0.0105
                                           -0.0005 -0.0020  0.2006 -0.0172 -0.0092
                                            0.0034 -0.0001 -0.7037  0.0409  0.0624
                                            0.0106 -0.0228  0.0285  0.0247 -0.0337
                                            0.0269
                (  8.21%)  -0.2865* C  25 s( 36.69%)p 1.73( 63.30%)d 0.00(  0.01%)
                                            0.0001 -0.6045  0.0387  0.0001 -0.0158
                                           -0.0006  0.0004 -0.0379  0.0105 -0.0010
                                            0.7918 -0.0656 -0.0007 -0.0044  0.0004
                                           -0.0019 -0.0068 -0.0038
Bonding in each is roughly sp3, with some additional d bonding. In dimer B there is increased p bonding character for the Cl, and decreased for the Me. This is likely to be due to the higher electronegativity of Cl. It is interesting to note that in the log files for the dimers that in A, there is data present for the bridging groups bonding to each of the metal centers, whereas in B and C it only shows data for the bridging of groups to one of the metal centres. This further strengthens the argument that A is more thermodynamically stable than B and C.
Vibrational data
| A[21] | B[22] | C[23] |
|---|---|---|
 |
 |
 |
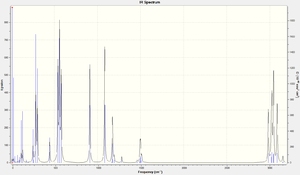
Looking at the output files it could be seen that there had been convergence in each of the dimers (the negative values are not large, below -20) and so stable optimisation has been performed. A:
 Low frequencies ---  -15.6869   -9.5552    0.0023    0.0024    0.0026   10.4888
 Low frequencies ---   11.9954   26.8824   37.6739
B:
 Low frequencies ---   -4.1060   -0.0021   -0.0021   -0.0014   12.4317   16.1570
 Low frequencies ---   26.9753   32.9118   38.3372
C:
 Low frequencies ---   -0.0029   -0.0026   -0.0020    6.1687   10.8138   15.4441
 Low frequencies ---   29.2528   34.1510   36.1944
13C NMR data
| A[24] | B[25] | C[26] |
|---|---|---|
 |
 |
 |
Conclusion
The calculations above disprove my hypothesis that on stability (A>C>B) to prove that A>B>C, which is concordant with the results in the literature. By looking into the "real" MOs calculated, a better picture was painted for some reasons as to why the stability was as such. LCAO would have fallen down her due to the large number of electrons in these dimers, and for the fact that energy levels would have been very hard to calculate.
In this project I encountered some problems which resulted in a lack of time to fully analyse some sections in the mini-project. The main problem was the fact that by the time I had realised that I was missing hydrogens in the bridging methyls in B and C, the SCAN service was down and the calculations required a long time period to complete (each took over two hours on the SCAN service to complete when back online). Also, I didn't fathom the complexity of such a complexity fully before starting it, and this made it difficult to complete fully in the last days.
References
- ↑ M. Schuurman et al, The Ab Initio Limit Quartic Force Field of BH3, Wiley, Vol 26, Issue 11, 2005, DOI:10.1002/jcc.20238
- ↑ DOI:http://hdl.handle.net/10042/to-9560
- ↑ J. Blixt et al, Structure of thallium(III) chloride, bromide, and cyanide complexes in aqueous solutionDOI:10.1021/ja00123a011
- ↑ DOI:http://hdl.handle.net/10042/to-9700
- ↑ DOI:http://hdl.handle.net/10042/to-9703
- ↑ DOI:http://hdl.handle.net/10042/to-9704
- ↑ DOI:http://hdl.handle.net/10042/to-9705
- ↑ G. Hogarth & T. Norman, Crystal structures of trans-[Mo(CO)4(PPh3)2] and 1,4-bis(diphenylphosphino)-2,5-difluorobenzene, Inorganica Chimica Acta, 254 (1997), 167-171
- ↑ L. Hirsivaara et al, Intramolecular hydrogen bonding and cation pi-interactions affecting cis-trans isomerization in tungesten hexacarbonyl derivatives of 2-pyridyldiphenylphosphane and triphenylphosphane, Elsevier, Inorganic Chemistry Communication, 3 (200), 580-510
- ↑ DOI:http://hdl.handle.net/10042/to-9906
- ↑ DOI:http://hdl.handle.net/10042/to-9907
- ↑ H. Lioe et al, Preference for bridging versus terminal ligands in magnesium dimers, Springer, 17 (2011), 1325-1334
- ↑ DOI:http://hdl.handle.net/10042/to-9908
- ↑ DOI:http://hdl.handle.net/10042/to-9909
- ↑ DOI:http://hdl.handle.net/10042/to-9911
- ↑ DOI:http://hdl.handle.net/10042/to-9910
- ↑ DOI:http://hdl.handle.net/10042/to-9912
- ↑ DOI:http://hdl.handle.net/10042/to-9913
- ↑ DOI:http://hdl.handle.net/10042/to-9915
- ↑ DOI:http://hdl.handle.net/10042/to-9914
- ↑ DOI:http://hdl.handle.net/10042/to-9918
- ↑ DOI:http://hdl.handle.net/10042/to-9916
- ↑ DOI:http://hdl.handle.net/10042/to-9917
- ↑ DOI:http://hdl.handle.net/10042/to-9919
- ↑ DOI:http://hdl.handle.net/10042/to-9920
- ↑ DOI:http://hdl.handle.net/10042/to-9921

