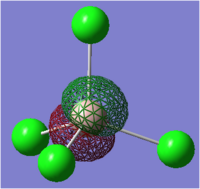
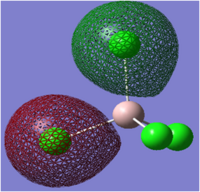
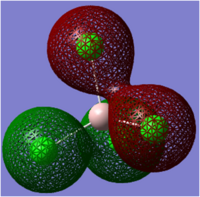
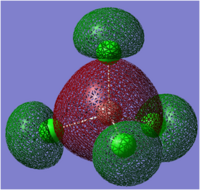
Rep:Mod2:388108
Module 2: Bonding (Ab initio and density functional molecular orbital)
Brian Wilson
Introduction
Chemistry is the science dealing with construction, transformation and properties of molecules. Theoretical chemistry is the subfield where mathematical methods are combined with fundamental laws of physics to study processes of chemical relevance.
Molecules are traditionally considered as composed of a collection of charged particles, positive nuclei and negative electrons. The only important physical force for chemical phenomena is the Coulomb interaction between these charged particles.
Given a set of nuclei and electrons, theoretical chemistry can attempt to calculate a variety of characteristics such as:
Which geometrical arrangements of the nuclei correspond to stable molecules? What are their relative energies? How do different molecules interact?
Over the past fifty years electronic computers have become generally available for researchers all over the world. This has spawned a new field in chemistry- computational chemistry, where the computer is used as an experimental tool, much like, for example, an NMR spectrometer.
During this investigation a variety of molecules will be examined using computational methods and the data produced to will be used compare numerous parameters with expected or literature values. The final section will apply the skills learned to investigate the key parameters of four anions, two of which are often used in ionic liquids.
General Performance Overview of DFT
Ecact DFT is an ab initio theory and like other such theories its quality with respect to energetic predictions is usually judged based on its performance for atomization energies. The most important features of the general performance of DFT are outlined below:[1]
1. For a given level of accuracy, hybrid DFT methods are the most efficient, showing mean errors almost equal in quality to the much more expensive multilevel methods.[2]
2. Hybrid DFT functionals offer some improvement over corresponding pure DFT functionals (such as BLYP/6-31G(d)).
3. Increasing basis set size does not always lead to improved accuracy during DFT calculations, although it must ultimately lead to a converged prediction.
4. Because of the non-dynamical correlation problem associated with the partially filled metal d-orbitals bonding energies are usually very poorly predicted by MO theory methods, until quite high levels are used to account for electron correlation.[3]
5. Investigations have found that the pure DFT functional BLYP badly underestimates activation energies for H-atom transfer reactions.
Boron-Centered Small Molecules
In this exercise, Pople's density functional theory (DFT)[4] method is used to optimise the structures of molecules BH3 and BCl3. The basis set[5] used here 3-21G is a low level basis set since the molecules are small and symmetrical. Analysis of the characteristics of these compounds, such as their molecular orbitals (MOs) and vibrational spectra was then completed.
Borane
Optimisation
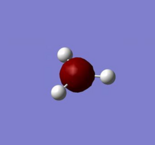
The results of optimising BH3, from an initial arbitrary bond length of 1.5Å are shown below and can also be viewed below:
Media:Bw08BH3 optimisation.gjf Media:Bw08BH3 OPTIMISATION.LOG
Media:BH3 optimisation Freq Ful NBO.gjf Media:BH3 OPTIMISATION FREQ FUL NBO.LOG.
The optimised structure compares favourably with data compiled by Schuurman et al:[6] bond length = 1.19 Å, bond angle = 120.0°, molecular geometry = trigonal planar and point group = D3h.
BH3
|
|---|
| File Type | .log |
| Calculation Type | FOPT |
| Calculation Method | RB3LYP |
| Basis Set | 3-21G |
| Final Energy / a.u. | -26.462 |
| RMS Gradient Norm / a.u. | 0.00000285 |
| Dipole Moment / Debye | 0.00 |
| Point Group | D3h |
| Job Time / s | 13.0 |
| Final B-H Bond Length / Å | 1.194 |
| Final B-H Bond Angle / o | 120.0 |
The plot of energy against optimisation number shows that four steps were required to obtain this optimised geometry, of minimum energy. The first derivative (RMS gradient norm) of energy with respect to the optimisation step number is very close to zero at after the four optimisation and therefore the calculation was stopped automatically after this step. Further optimisations could have been carried out but as the data produced is consistent with literature, there is no real benefit of doing so.

It is important to also carry out a frequency analysis to ensure that the energy is minimized and that the geometry is not a local transition state (maximum point) where the first derivative of energy also is equal to zero.
Vibrational Calculation and Interpretation
Frequency Analysis was conducted to determine that the optimised structure of BH3 is indeed the one of minimum potential energy. Another use of this computation is the prediction of infrared frequencies. The lack of any low or negative vibrations confirmed that the structure was minimized.
| No. | Form of Vibration | Calculated Frequency / cm-1 | Intensity | Literature Frequency[7]: / cm-1 | Symmetry (D3h Point Group) |
|---|---|---|---|---|---|
| 1 | 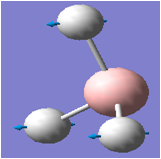 |
1146 | 93 | 1159 | A2" |
| 2 | 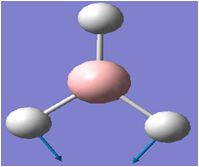 |
1205 | 12 | 1202 | E' |
| 3 | 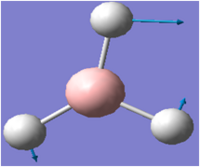 |
1205 | 12 | 1202 | E' |
| 4 | 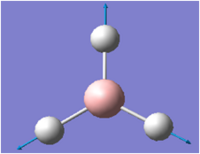 |
2593 | 0 | IR inactive | A1' totally symmetric |
| 5 | 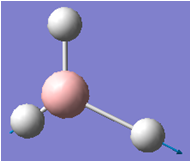 |
2731 | 104 | 2506 | E' |
| 6 | 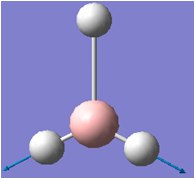 |
2731 | 104 | 2616 | E' |
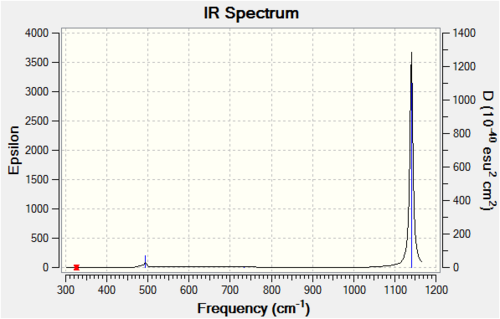
The spectrum produced during this computation is shown on the right.
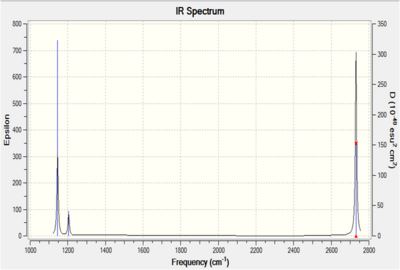
Comparison of the computed spectrum and literature data enables important inferences to be made. Firstly, there are only five peaks reported in the experimental data, compared to the six peaks shown in the infrared spectrum to the right (peaks overlapping so not accurately depicted).
Closer inspection indicates that the peak which is missing is the symmetric stretching frequency, which has an intensity of zero. This is because a vibration is only infrared active (hence observed) when there is a change in dipole moment. During the symmetric stretch there is no change in dipole moment during stretching of the B-H bonds, therefore no absorption is observed at 2593cm-1. As this vibrational mode is completely symmetrical (having the symmetry label A1’) no infrared absorption is seen.
The computed vibrational frequencies are most accurate for the lower frequencies, which are the wagging and rocking rocking modes, having errors of approximately 1% and 0.2% respectively. However, for the asymmetric stretching modes, which occur at a much higher frequency, the average percentage error is much larger, at 7%. The larger error at the higher frequency is expected to be due to the fact that anharmonicity is not taken into account by Gaussian, which assumes harmonic oscillation at all frequencies.
Calculation of the Molecular and Natural Bond Orbitals
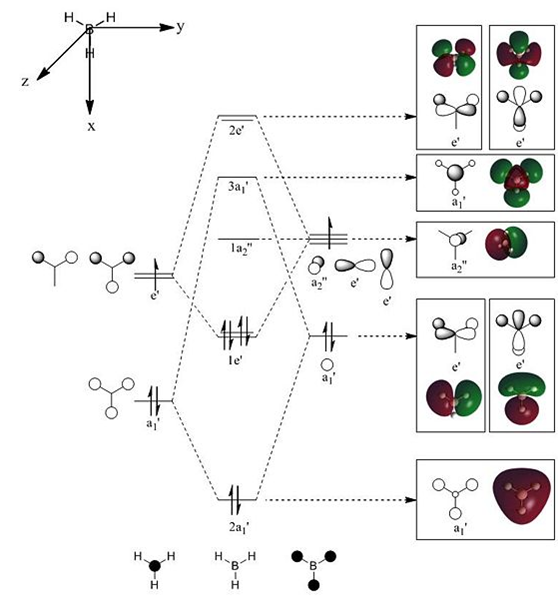
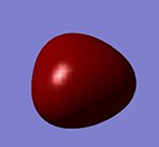
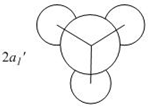
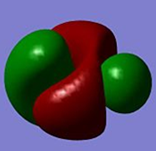
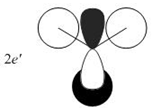
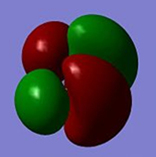
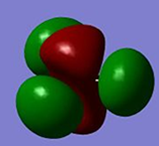
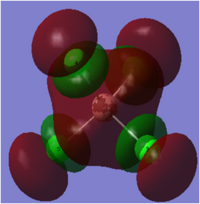
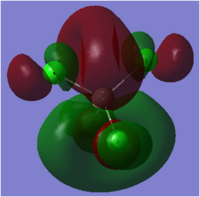
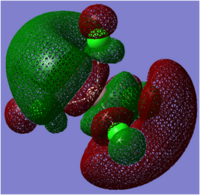
Mulliken Population Analysis of BH3 was conducted with Gaussian to determine the molecular orbitals of the molecule. The log file of the calculation can be viewed at Media:BH3 OPTIMISATION FREQ FUL NBO.LOG .
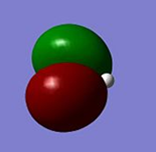
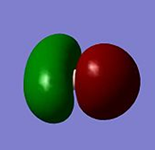
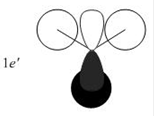
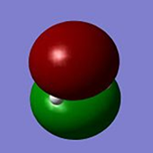
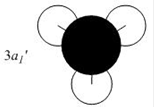
Qualitative MO theory is unable to accurately predict the quantitative energy ordering of the orbitals proposed. For the case of BH3, computational calculations show that the energy of the 2e' orbital is lower than that of the 3a1' orbital, by 8 kJ mol-1. However, the qualitative LCAO method is incapable of determining which orbital is of higher energy since both arrangements, i.e. one where the 2e' orbital is lower in energy than 3a1' orbital and the other where the 2e' orbital is higher in energy than 3a1' orbital, are possible when there is no quantitative information relating to the energies of the atomic orbitals, degree of mixing or splitting energies.
Frequency Analysis
Value
The aim of optimisation is to find the ground state conformation of a molecule, which is the lowest energy conformation. The gradient of potential energy plotted against the parameter being varied (for example bond length or variable R) is equal to zero when this lowest energy is reached. As observed for borane above the RMS (root mean square) gradient norm is less than 0.001, therefore the gradient is almost zero. Yet this particular point where the gradient is almost zero can either be be a ground state or a relative transition state which is not the minimum energy point. The second derivative must therefore be found. If the second derivative is negative then we have a maximum point (transition state) and if it is positive then we have a minimum point.
Therefore, frequency analysis is necessary to determine that the optimised structure is indeed the ground state structure of the molecule. Another important use of this computation is the prediction of molecular vibrational frequencies, which correspond to the infrared spectrum of the molecule.
Limitations
One drawback of frequency analysis is that the frequency calculation must be carried out in a separate step with the same method and basis set as that used during optimisation. This is because the it must be computed in the same manner as the optimisation for it to be an accurate representation of the second derivative of potential energy. The use of a different method would render the frequency analysis incompatible with the optimisation and hence is not useful for the computation. Yet this analysis is highly valued as it enables confirmation of whether the proposed minimum energy conformation is realistic by examining the vibrations recorded to find whether any negative vibrations which are large in magnitude are recorded which would indicate that the geometry has not been optimised.
What is a Chemical Bond?
‘When the formulae of inorganic compounds are considered even a superficial observer is struck with the general symmetry of their construction; the compounds of nitrogen, phosphorous, antimony and arsenic especially exhibit the tendency of these elements to form compounds containing three or five equivalents of other elements, and it is in these proportions that their affinities are best satisfied.’
This comment by Frankland in 1852 illustrates the body of knowledge which was available to chemists in the middle of the 19th century and which led to rapid advances in the concept of valency. [8] Rapid developments within organic chemistry at this time led Kekulé in 1857 to deduce that carbon was tetravalent, and he also introduced the important idea that carbon atoms could form bonds with one another. [9]
Further work by Kekulé led to the explanation of isomerism in a range of benzene derivatives. This helped in Pasteur’s groundbreaking work based on optical isomerism of tartaric acid and in 1874 van’t Hoff’s interpretation of Pasteur’s results marked the beginning of our picture of a molecule of atoms joined by bonds. Early attempts at an electronic theory of valence, following the discovery of the electron in 1897, suffered from the limitation that the electrons were considered to be at rest. It was not until 1913 that Bohr introduced a dynamic model for the electrons in an atom which gave satisfactory of many features of atomic spectral lines.[10] Electronic theories of bonding supported by the Bohr model were successfully developed by Lewis into a broad rationalization of chemical bonding types. In the Lewis theory of valence there are two main types of chemical bonds: ionic and covalent. A covalent bond is an electron pair shared between two neighbouring atoms. An ionic bond is the electrostatic force of attraction between ions of opposite charge. Metallic bonds are often defined as the electrostatic force of attraction experienced by two or more metal atoms for the delocalized electron between them. Weak bonding interactions can result from electrostatic interactions experienced between dipoles, which can either be permanent dipoles or induced dipoles. Hydrogen bonding results from strong electrostatic interactions which can have a large impact on molecular structure and function.
The driving force for bond formation is identified as the pairing of electrons between atoms so as to obtain stable octets: the inert gas electronic structure.[11] This idea of electron pairing had an important influence on the first quantitatively successful theories of the chemical bond that were a description of electron sharing in wave mechanical terms.
Loss Of Bonds In Gaussian
Gaussian draws bonds based on distance criteria. This is not because bonds between the atoms do not exist, but is due to programming constraints inherent in this program. Gaussview has a database of bond lengths which indicate to the system when bonds should be drawn. When the calculated distance between atoms does not lie within the specified limit, a bond is not recognized and is therefore not drawn. This occurs most commonly for inorganic compounds, since the bond lengths in the database are mainly based on those observed for organic compounds.
Boron trichloride
The results from optimisation of BCl3, with its point group restricted to D3h are shown below and can be viewed below:
Input file- Media:BCl3 final optimisation.gjf
Output file- Media:BCL3 FINAL OPTIMISATION.LOG
| File Type | .log |
| Calculation Type | FOPT |
| Calculation Method | RB3LYP |
| Basis Set | LANL2MB |
| Final Energy / a.u. | -69.4393 a.u. |
| RMS Gradient Norm / a.u. | 0.00000932 |
| Dipole Moment / Debye | 0.00 |
| Point Group | D3h |
| Job Time / s | 13.0 |
| B-Cl Bond Length / Å | 1.87 |
| Cl-B-Cl Bond Angle / o | 120.0 |
When the computation was repeated without restricting the point group, Gaussian still produced the molecule with the point group D3h, indicating that the programme recognises BCl3 to have D3h symmetry as expected for its trigonal planar geometry.
The optimised BCl3 structure compares well to literature data [12] for the bond angle = 120.0o, molecular geometry = trigonal planar and point group = D3h.
However, the experimental bond length of 1.75 Å is significantly different from the computed bond length (1.87 Å). This computed bond length corresponds to that of BCl3- at 1.88 Å. This result is expected to be due to the LANL2MB basis set used to run the optimisation, which is more suitable for elements with atomic number larger than Zn, which have filled 3d orbitals.
Frequency analysis was then carried out for BCl3 which can be viewed at:
Input file- Media:BCl3 final optimisation freq.gjf
Output file- Media:BCL3 FINAL OPTIMISATION FREQ.LOG
The results are consistent with literature data as compared below.[13]
| No. | Form of Vibration | Calculated Frequency / cm-1 | Intensity | Literature Frequency[12]/ cm-1 | Symmetry (D3h Point Group) |
|---|---|---|---|---|---|
| 1 | 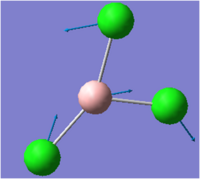 |
214 | 4 | 243 | E' |
| 2 | 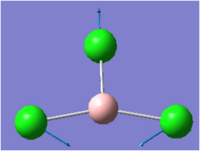 |
214 | 4 | 243 | E' |
| 3 | 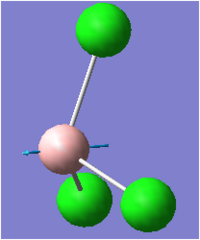 |
377 | 44 | 462 | A2" |
| 4 | 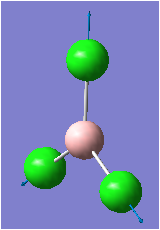 |
417 | 0 | 471 | A1' |
| 5 | 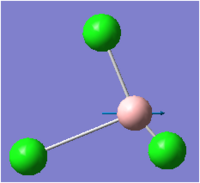 |
939 | 259 | 958 | E' |
| 6 | 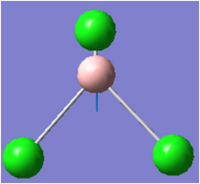 |
939 | 259 | 958 | E' |

As expected for this non-linear compound, 3N-6 = 6 vibrational modes were outputted, with five of these vibrations being observed in the infrared spectrum. Once again, the totally symmetric A1' stretch has no change in dipole moment and hence is not infrared active.
It is also interesting to note that whereas BH3 dimerises under normal conditions, BCl3 exists as the monomer due to electron donation from a filled p-orbital on chlorine into the vacant p orbital on boron. This reduces the electron deficiency at the boron atom and stabilises the monomer. This also results in a shorter than expected B-Cl bond length of 1.75 Å, in comparison to similar compounds. Boron trichloride is a colourless gas under standard conditions and is a highly valuable reagent in organic synthesis. This compound is a strong Lewis acid due to its low energy LUMO and readily forms adducts with tertiary amines, phosphines and halide ions.
Thallium Tribromide
Thallium is a toxic compound, hence computational techniques are especially useful when studying the compound below, TlBr3.
TlBr3
|
|---|
The results of optimising TlBr3 are shown below along with the optimised structure shown above.
The input and output files for both the optimisation and frequency analysis are located below-
Media:TlBr3 optimisation.gjf Media: BwilsonTLBR3 OPTIMISATION.LOG
Media:TlBr3 optimisation freq.gjf Media:TLBR3 OPTIMISATION FREQ1.LOG
| Calculation Type | FOPT |
| Calculation Method | RB3LYP |
| Basis Set | LANL2DZ |
| Charge | 0 |
| Spin | Singlet |
| E(RB3LYP) | -91.2181 a.u. |
| RMS Gradient Norm | 0.000000900 |
| Dipole Moment | 0.0000 Debye |
| Point Group | D3H |
| Job cpu time | 15.0 seconds |
The optimisation was run using the calculation method DFT-B3LYP with the basis set LANL2DZ. The symmetry of the thallium (III) bromide was tightly restricted to the D3h point group so that the optimisation would produce a molecule with high symmetry. The optimisation returned a molecule that had converged and with gradient 0.0000170a.u. suggesting it was a success. The bond length (2.65Å) showed good correlation to the literature (2.5153Å) further indicating it had successfully optimised. The slight difference is probably due to the fact that the basis set used is not perfect. The bond angles were also 120.0°. The input files for this optimisation are linked below:
To confirm that a molecule is at a minimum a frequency analysis must be run. The same basis set as used for the optimisation must be used for the frequency analysis. This is because the frequency analysis is effectively the second derivative of the curve of potential energy and so if the basis set is changed so too will the potential energy curve and so the results could not be compared to one another.

| Tl-Br bond distance | Br-Tl-Br bond angle |
|---|---|
| 2.65 Å | 120.0 o |
| Low frequencies (cm-1) | -3.4226 | -0.0026 | -0.0004 | 0.0015 | 3.9361 | 3.9361 |
| "Real" normal frequencies (cm-1) | 46 | 46 | 52 | 165 | 211 | 211 |
The low frequencies correspond to the vibrational modes of the centre of mass of the molecule. Six 'low frequencies' were recorded as shown above. As none of these are below -5 cm-1 this confirms that the optimal geometry has been reached and the structure is at a minimum and not a maximum energy point.
Use of Vibrational Spectroscopy to Identify Mo(CO)4L2 Isomers
Physical techniques are widely used to obtain structural information at a molecular level in both organic and inorganic chemistry.[14] [15]A quick and convenient laboratory bench-top analysis of a sample will often allow chemists to gain a detailed insight into a structural problem with recourse to single crystal X-ray diffraction studies. Infrared spectroscopy is one such spectroscopic technique.
Mononuclear metal carbonyl complexes are well suited to study by infrared spectroscopy since intense absorptions due to the CO oscillations usually occur in the range 2,100-1,750 cm-1. Furthermore, this region is generally free from interference from absorptions due to other functional groups. [16]
An additional benefit of infrared spectroscopy which will be explored during this investigation is that by using group theory, the number of infrared active CO absorptions for a particular geometrical isomer can be used to determine the particular isomer present. [17] Hence four carbonyl absorption bands are expected from a cis-[M(CO)4(L2)] complex, whereas one band is expected from the trans-isomer. [18]
Both the cis and trans isomers of Mo(CO)4(PPh3)2) were synthesised and characterised during the second year synthesis laboratory in each case in high yields of over 80 %. Firstly Mo(CO)6 is used to make the disubstituted piperidine complex, which is then converted to the cis isomer of Mo(CO)4(PPh3)2. Thermal isomerisation then completes the synthesis of the trans isomer.


During this experiment the metal carbonyl substitution reactions went via a dissociative mechanism involving Mo-P bond cleavage. Sterics and electronics of the metal and ligands involved during the reaction affect the mechanistic pathway. As the triphenylphosphine ligand is large and the complexes are all 18 electron complexes, a dissociative mechanism prevails. As triphenylphosphine is a relatively soft ligand and Molybdenum is a relatively soft metal, this makes the reactions thermodynamically favourable.
The point group of each isomer was determined after considering the symmetry elements as shown below
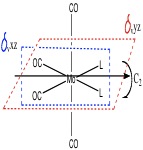

Hence the cis-isomer belongs to the C2v whereas the trans isomer belongs to the D4h point group.
Infrared spectroscopy confirmed the successful synthesis of each compound as one CO absorption was observed for the trans isomer, compared to four for the cis isomer.
Vibrational Frequencies of Mo(CO)4(PCl3)2 Isomers
As PPh3 is a relatively large and difficult ligand to compute, the geometrical isomerism of the complex where L=PCl3 was modeled. The final optimisation gave the results shown in table 9.
| Property | cis-Mo(CO)4(PCl3)2 | Trans-Mo(CO)4(PCl3)2 |
|---|---|---|
| File Type | .log | .log |
| Calculation Type | FOPT | FOPT |
| Calculation Method | RB3LYP | RB3LYP |
| Basis Set | LANL2DZ | LANL2DZ |
| Final Energy / a.u. | -623.5772 | -623.5761 |
| Final Energy / kJ mol-1 | -1637201 | -1637199 |
| RMS Gradient Norm / a.u. | 0.00000772 | 0.00002444 |
| Dipole Moment / Debye | 1.31 | 0.3041 |
| Point Group | C2v | D4h |
| Job Time | 1 h 22 min 42.1 s | 49 min 43.6 s |
Trans- input and output files:
Cis- input and output files:
The output files indicate that the cis isomer is more stable by approximately 3kJ/mol but in practise both isomers can be isolated. This is expected to be due to a balance between electronic and steric factors. Electronically, the trans effect in the metal complex favours the cis-isomer. As CO ligands are strong π-acceptors and have a very strong trans effect, resulting in the preferred orientation of the ligands such that there are less CO ligands opposite each other. This is achieved in the cis-isomer where there is only one pair of CO ligands which are trans to each other, while in the trans-complex there are 2 pairs of CO ligands which are trans to each other.
Yet steric effects favour the trans isomer as there is less steric repulsion between the two large PCl3 ligands are trans to one another. It has been shown that as the steric size of the substituent R is altered, (for example R=nBu3) the mechanism of isomerisation and hence complex activity can be 'tuned' by a large amount. [19] The PPh3 ligand is much larger than the PnBu3 ligand. The cone angle of PPh3 is 145° whereas that of PnBu3 is 132°. Hence for the bulkier PPh3 ligand Mo-P cleavage is a more favourable process for the stereochemical rearrangement than transformation to a trigonal prismatic intermediate where steric interactions are greatly increased.
For [Mo(CO)4(PnBu3)2] the cis to trans isomerisation mechanism is commonly referred to as the “Bailar twist”. This can be visualized as proceeding by a 60° counterclockwise rotation of the two triangular octahedral faces, which is less sterically hindered for the smaller PnBu3 ligand. This process is clearly dependent on the steric size of the ligand, so the larger PPh3 cannot proceed via this process and instead goes via a dissociative mechanism. The [Mo(CO)4(PnBu3)2] isomerisation proceeds through this non-bond-breaking process.
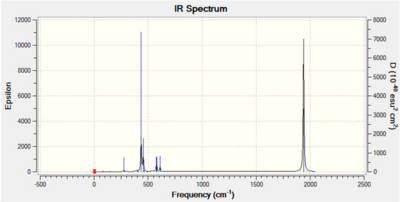
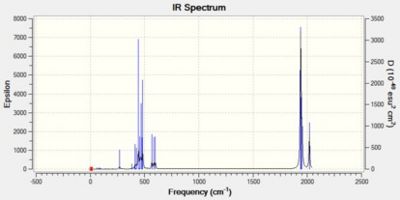
The results from the optimisation and frequency analysis are shown below.
| Trans Isomer | Cis Isomer | ||||||
|---|---|---|---|---|---|---|---|
|
|
| Calculated Frequency / cm-1 | Experimental Frequency[20] / cm-1 | Point Group (C2v Symmetry) |
|---|---|---|
| 1945 | 1986 | B2 |
| 1949 | 1994 | B1 |
| 1958 | 2004 | A1 |
| 2023 | 2072 | A1 |
| Calculated Frequency / cm-1 | Experimental Frequency / cm-1 [21] | Point Group (D4h Symmetry) [22] |
|---|---|---|
| 1950 | 1896 | Eu |
| 1951 | 1896 | Eu |
| 1977 | - | B1g |
| 2031 | - | A1g |
It is clear from the tables above that there is very good agreement between the computed vibrational spectra and the literature data. As expected, the percentage error increases as the stretching frequency increases due to an increase in anharmonicity which is not taken into account during this procedure. For the trans isomer, two of the vibrational modes (A1g and B1g) do not involve a change in dipole moment and hence are not infrared active. Four absorptions are computed and oberved experimentally for the cis isomer. This highlights a general rule for infrared activity noted by Darensbourg: 'the more symmetric the molecule the fewer infrared active bonds are to be expected'.
The vibrational frequency of an uncoordinated C=O bond is 2143cm-1 whereas a coordinated carbonyl is lower due to backbonding. Donation of electron density from the filled metal d-orbital to the C=O π* antibonding orbital weakens the bond and lowers its stretching frequency. The carbonyls in the trans isomer are all in the same environment and therefore experience the same amount of backdonation and as a result the stretches for the two trans pairs are the same, 1896cm-1. The carbonyl ligands in the cis complex are in different environments, two axial and two equatorial, therefore the amount of backdonation varies.
Low-Frequency Vibrations of Mo(CO)4(PCl3)2 Isomers
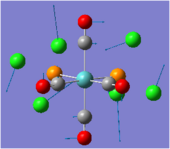
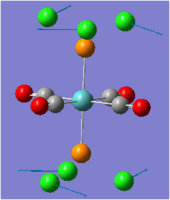
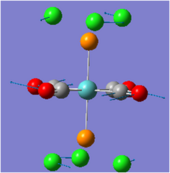
Each of these four vibrations involve the rotation of the PCl3 ligand about the Mo-P bond. This happens as the amount of energy required to rotate a bond is very small compared with a stretching or bending motion. Hence the ground state vibrational levels for these modes are significantly depopulated at room temperature.[23] These vibrational potentials are also anharmonic, and therefore, the spacing between adjacent energy levels decreases for higher energy vibrational states. This anharmonicity is responsible for the temperature dependence of the frequency shifts.
Mini Project: Ionic Liquids
Room-temperature ionic liquids are typically composed of organic cations (for example, 1-butyl-3-methylimidazolium) and inorganic cations, and have a long, useful history.[24] There has been a rapid increase in interest in their applications mainly due to the realization that these materials, formerly used for specialized electrochemical applications, may have greater utility as reaction solvents. [25]
Ionic liquids often have a melting temperature which is below the boiling temperature of water and most of them are liquids at room temperature.[26] The low vapor pressure, variable miscibility, favourable solvation behaviour and high thermal stability of ionic liquids contrast favourably with the characteristics of traditional volatile organic solvents.[27] This makes ionic liquids attractive as being perceived as ‘green’ and more suitable for use in the acadameic environment, particularly for synthesis and catalysis. Their wide electrochemical window, high conductivity, high ionic mobility and wide operating temperature range make them useful candidates for use as electrolytes in advanced electrochemical devices.[28] Due to the strong Coulombic attractions within these liquids, they have a high viscosity, orders of magnitude higher than organic solvents. This presents a major disadvantage in many industrial applications, also impacting on conductivity and hence their use in electrochemical devices.
Research at the U.S. Air Force Academy initiated the field of ionic liquids and initial efforts their resulted in a patent for a thermal battery making use of the NaCl/AlCl3 electrolyte.[29] NaCl/AlCl3 has a eutectic composition with a melting point of 107°C. Chloroaluminates are a class of salts which are not simple binary mixtures, because the Lewis acid-base chemistry of the system leads to the formation of Cl-, [AlCl4]-, [Al2Cl7]-, [Al3Cl10]- (although not all of these are in the same mixture. Later research has found that dialkylimidazolium cations are one of the most attractive to use, a common cation currently used being 1-ethyl-3-methylimidazolium [EMIM]. [EMIM]Cl mixed with AlCl3 made ionic liquids with melting temperatures over a wide range of compositions. Soon, interest in this area was expanding as organic reactions such as those involving Friedel-Crafts chemistry were explored using this ionic liquid, and they were found to work excellent as both solvents and catalysts.
The pyridinium- and imidizolium-based chloroaluminate ionic liquids share the disadvantage of being reactive with water. Further work at the U.S. Air Force Academy identified the tetrafluoroborate and hexafluorophosphate salts as stable towards hydrolysis. These salts were expected to be useful as battery electrolytes, but have proven to be more useful for other applications.[30]
Ions Studied
During this Mini-Project I will compute and compare key parameters for [AlCl4]-, [BF4]-, [AlF4]- and [BCl4]-.

This will include optimization of each structure, followed by frequency analysis and charge distribution calculations. The input and output files for each calculation will be provided, along with the key data produced. This will be followed by analysis and discussion of the results obtained.
Effects of Ion Sizes on Salt Melting Points
The charge, size and distribution of charge on the respective ions are the main factors influencing the melting points of the salts. Within a similar series of salts, however, small changes in the shape of the ions can have an important influence on the melting points of the salts.
As the size of the anion increases, the melting point of the salt decreases, reflecting the weaker Coulombic interactions in the crystal lattice and increasing covalency of the ions.
Complex anions, formed when halide slats are combined with Lewis acids (e.g. AlCl3) produce ionic liquids with reduced melting points through the formation of eutectic compositions. The molar ratio of the two reactants can influence the melting point of the resulting mixed salt system through speciation equilibria. The position of the equilibrium can have a large impact on ionic liquid melting point, as a phase diagram must be drawn according to the mol fraction of AlCl3.
[AlF4]-
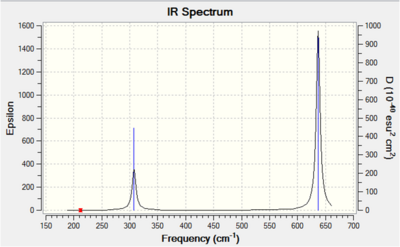
[AlF4]- was optimised using the conditions sumarised in table 13.

Input Files
Media:ALF4-OPTIIMISATIONpop=full.gjf
Output Files
Media:ALF4-OPTIIMISATIONPOP=FULL.LOG
| File Type | .log |
| Calculation Type | FOPT |
| Calculation Method | RB3LYP |
| Basis Set | 6-31G |
| Final Energy / a.u. | -642.08 |
| RMS Gradient Norm / a.u. | 0.00008812 |
| Dipole Moment / Debye | 0.000 |
| Point Group | Td |
| Job Time / s | 45 |
| Al-F Bond Length / Å | 2.25 |
| F-Al-F Bond Angle / o | 109.47 |
| Vibration number | Symmetry Label and Form of Vibration | Computed Frequency / cm-1 | Literature Frequency[31] / cm-1 | Intensity |
|---|---|---|---|---|
| 1 |  |
212 | 193 | IR inactive |
| 2 |  |
212 | 193 | IR inactive |
| 3 | 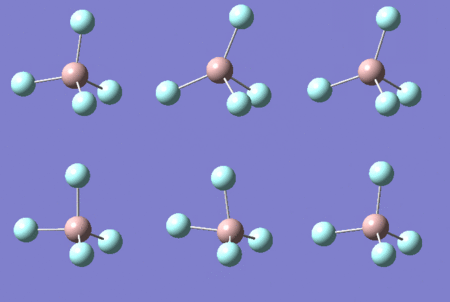 |
308 | 308 | Weak |
| 4 |  |
308 | 301 | Weak |
| 5 |  |
308 | 301 | Weak |
| 6 |  |
460 | 450 | IR inactive |
| 7 | 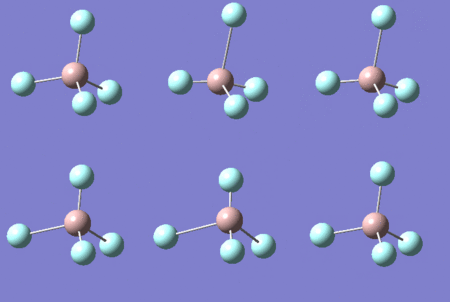 |
637 | 621 | Strong |
| 8 | 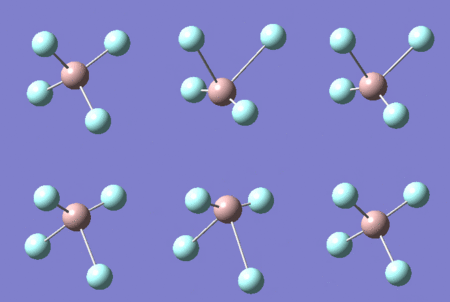 |
637 | 621 | Strong |
| 9 | 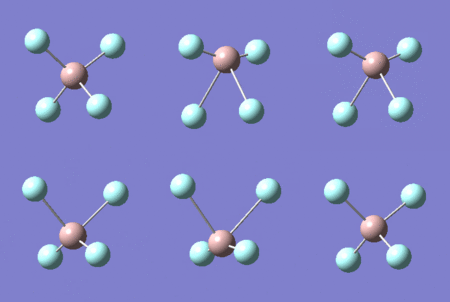 |
637 | 621 | Strong |
Each non-linear ion has 3N-6= (3x5)-6=9 vibrational modes. Six of these arise from the two triply degenerate vibrational modes which are infrared active and hence six absorptions are expected to be observed. As the vibrational modes are degenerate, two bands are observed. The intensity of each absorption is explained in the infrared spectral analysis section.
[AlCl4]-
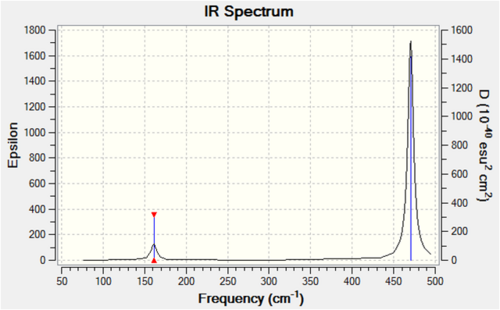
Optimisation, frequency analysis, charge distribution calculation and NBO analysis was carried out for [AlCl4]-, the results can be viewed below.

Input files
Media:FINALALCL4- second NBO.gjf
Output files
Media:FINALALCL4- SECOND NBO.LOG
| File Type | .log |
| Calculation Type | FOPT |
| Calculation Method | RB3LYP |
| Basis Set | 6-31G |
| Final Energy / a.u. | -2083.53 |
| RMS Gradient Norm / a.u. | 0.00000074 |
| Dipole Moment / Debye | 0.000 |
| Point Group | Td |
| Job Time / s | 41 |
| Al-Cl Bond Length / Å | 2.25 |
| Cl-Al-Cl Bond Angle / o | 109.47 |
| Vibration number | Symmetry Label and Form of Vibration | Computed Frequency / cm-1 | Literature Frequency[32] / cm-1 | Intensity |
|---|---|---|---|---|
| 1 | (E) symmetric bend. First of the doubly degenerate low frequency vibrational modes which is IR inactive as there is no change in dipole moment. | 101 | 115 | IR inactive |
| 2 | (E) symmetric bend. Second of the doubly degenerate low frequency vibrational modes which is IR inactive as there is no change in dipole moment. | 101 | 115 | IR inactive |
| 3 | (T2) The first of the triply degenerate bending modes. As one Cl-Al-Cl bond angle increases, the other decreases. | 161 | 145 | Weak |
| 4 | (T2) The second of the triply degenerate bending modes. | 161 | 145 | Weak |
| 5 | (T2</sub)>) The third of the triply degenerate bending modes. | 161 | 145 | Weak |
| 6 | (A1) Simultaneous elongation or shortening of all Al-Cl bonds, which involves no change in dipole moment. | 305 | 315 | IR inactive |
| 7 | (T2) The first of the triply degenerate stretching vibrations which involves a large change in dipole moment. All four atoms move considerably during this vibration. Large change in dipole moment observed. | 470 | 485 | Strong |
| 8 | (T2) The second of the triply degenerate stretching vibrations which involves a large change in dipole moment. | 470 | 485 | Strong |
| 9 | (T2) The third of the triply degenerate stretching vibrations which involves a large change in dipole moment. | 471 | 485 | Strong |
[AlCl4]- Natural Bonding Orbital Analysis
Analysis of the key natural bonding orbitals of [AlCl4]- was carried out, the input and output files can be found in the previous section.
The NBO analysis indicates that the HOMO is the lone pair of electrons on chlorine. This observation is exemplified in the Friedel Crafts alkylation reaction shown below. Key species highlighted in red.

Hence the NBOs give us a clear indication of the likely reactivity of this ion, enabling informed predictions of chemical reactivity to be made.
[BCl4]-
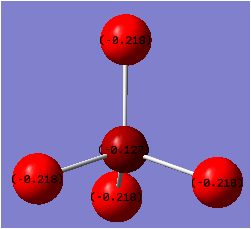
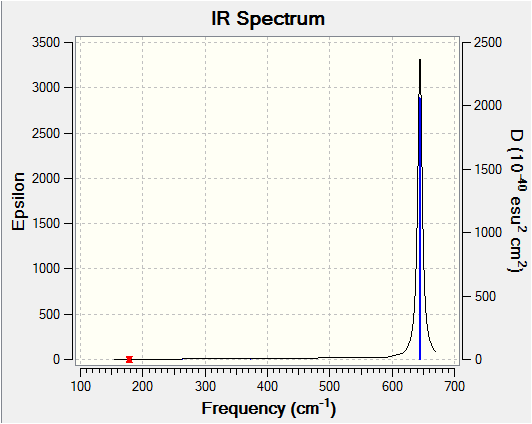
Optimisation of [BCl4]- was carried out using the conditions sumarised in table 17. They infrared spectrum can also be viewed below.
Input files
Output files
| File Type | .log |
| Calculation Type | FOPT |
| Calculation Method | RB3LYP |
| Basis Set | 6-31G |
| Final Energy / a.u. | -1865.82 |
| RMS Gradient Norm / a.u. | 0.00000571 |
| Dipole Moment / Debye | 0.000 |
| Point Group | Td |
| Job Time / s | 106 |
| B-Cl Bond Length / Å | 1.92 |
| Cl-B-Cl Bond Angle / o | 109.47 |
| Vibration number | Symmetry Label and Form of Vibration | Computed Frequency / cm-1 | Literature Frequency[33] / cm-1 | Intensity |
|---|---|---|---|---|
| 1 | [(E) symmetric bend. First of the doubly degenerate low frequency vibrational modes which is IR inactive as there is no change in dipole moment. | 178 | 191 | IR inactive |
| 2 | (E) symmetric bend. Second of the doubly degenerate low frequency vibrational modes which is IR inactive as there is no change in dipole moment. | 178 | 191 | IR inactive |
| 3 | (T2) The first of the triply degenerate bending modes. As one Cl-B-Cl bond angle increases, the other decreases. | 263 | 271 | Very weak |
| 4 | (T2) The second of the triply degenerate bending modes. As one Cl-B-Cl bond angle increases, the other decreases. | 263 | 275 | Very weak |
| 5 | (T2) The third of the triply degenerate bending modes. As one Cl-B-Cl bond angle increases, the other decreases. | 263 | 275 | Very weak |
| 6 | (A1) Simultaneous elongation or shortening of all B-Cl bonds, which involves no change in dipole moment. | 373 | 385 | IR inactive |
| 7 | (T2) The first of the triply degenerate stretching vibrations which involves a large change in dipole moment. All four atoms move considerably during this vibration. Large change in dipole moment observed. | 644 | 721 | Strong |
| 8 | (T2) The second of the triply degenerate stretching vibrations which involves a large change in dipole moment. All four atoms move considerably during this vibration. Large change in dipole moment observed. | 645 | 721 | Strong |
| 9 | (T2) The third of the triply degenerate stretching vibrations which involves a large change in dipole moment. All four atoms move considerably during this vibration. Large change in dipole moment observed. | 646 | 721 | Strong |
There is a large disagreement between the literature and computed (T2) degenerate stretches which is expected to be due to the anharmonicity of the bond at high vibrational modes. Detailed discussion of the information collected is carried out in the comparison section.
[BF4]-
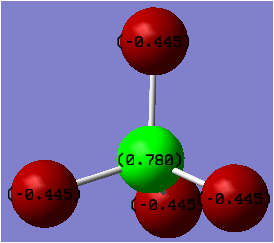
[BF4]- is a common anion used in ionic liquids, for example [EMIM]BF4 (1-Ethyl-3-methylimidazolium tetrafluoroborate). This ionic liquid is stable to water, increasing its attractiveness. The computed data are attached and the information collected can be viewed below.
Input files
Output files
| File Type | .log |
| Calculation Type | FOPT |
| Calculation Method | RB3LYP |
| Basis Set | 6-31G |
| Final Energy / a.u. | -424.43 |
| RMS Gradient Norm / a.u. | 0.00000011 |
| Dipole Moment / Debye | 0.000 |
| Point Group | Td |
| Job Time / s | 47 |
| B-F Bond Length / Å | 1.92 |
| F-B-f Bond Angle / o | 109.47 |
| Vibration number | Symmetry Label and Form of Vibration | Computed Frequency / cm-1 | Literature Frequency[34] / cm-1 | Intensity |
|---|---|---|---|---|
| 1 | (E) symmetric bend. First of the doubly degenerate low frequency vibrational modes which is IR inactive as there is no change in dipole moment. | 326 | 341 | IR inactive |
| 2 | (E) symmetric bend. Second of the doubly degenerate low frequency vibrational modes which is IR inactive as there is no change in dipole moment. | 326 | 341 | IR inactive |
| 3 | (T2) The first of the triply degenerate bending modes. As one F-B-F bond angle increases, the other decreases. | 494 | 505 | Weak |
| 4 | (T2) The second of the triply degenerate bending modes. As one F-B-F bond angle increases, the other decreases. | 494 | 505 | Weak |
| 5 | (T2) The third of the triply degenerate bending modes. As one F-B-F bond angle increases, the other decreases. | 494 | 505 | Weak |
| 6 | (A1) Simultaneous elongation or shortening of all B-F bonds, which involves no change in dipole moment. | 733 | 743 | IR inactive |
| 7 | (T2) The first of the triply degenerate stretching vibrations which involves a large change in dipole moment. All four atoms move considerably during this vibration. Large change in dipole moment observed. | 1140 | 1102 | Strong |
| 8 | (T2) The second of the triply degenerate stretching vibrations which involves a large change in dipole moment. All four atoms move considerably during this vibration. Large change in dipole moment observed. | 1140 | 1102 | Strong |
| 9 | (T2) The third of the triply degenerate stretching vibrations which involves a large change in dipole moment. All four atoms move considerably during this vibration. Large change in dipole moment observed. | 1140 | 1102 | Strong |
All of the infrared absorptions agree with literature publications, yet as observed previously the inaccuracy of this method increases as the vibrational frequency increases due to anharmonicity not being taken into account. Yet the infrared absorptions are closest to the literature values for this ion.
Comparison of Data Collected
Infrared Spectra
For each spectrum the T2 degenerate stretch has a much larger absorption intensity and in no case is the intensity of this absorption less than four times the intensity of the T2 degenerate bend. The strength of and infrared absorption is directly proportional to the change in dipole moment which occurs during the vibration. During the T2 degenerate bend there is only a minor change in the position of the central atom and two of the bond lengths change considerably as shown above for [AlF4]-. Hence the change in dipole moment is relatively small during this vibration, resulting in a weak intensity, for example for [BCl4]- the intensity of this absorption had a value of just 0.003.
On the other hand, during the T2 degenerate stretches all of the bond lengths change by a much larger amount and the position of the central atom changes considerably during the vibration, resulting in a large change in dipole moment, as observed using the Gaussian program. This larger change in dipole is reflected in the much larger absorption intensity of this vibrational mode, reaching a value of 360 units for [BF4]-.
There is no clear trend in absorption intensity for each of the four ions, but the [BF4]- ion has the largest intensity T2 degenerate stretch. This could be related to the fact that the bond lengths in this ion are the shortest, therefore any change in the bond length during vibrations result in the greatest relative change in the distance between charges in this ion, and hence a high absorption intensity.
Bond Length
For each ion the central atom is sp3 hybridised and the geometry is tetrahedral.
| Bond | Computed Bond Length/Å | Literature Bond Length/Å | Difference/Å | % Difference |
| Al-Cl | 2.25 | 2.15 | 0.1 | 4.65 |
| Al-F | 1.73 | 1.69 | 0.04 | 2.37 |
| B-Cl | 1.92 | 1.84 | 0.08 | 4.35 |
| B-F | 1.44 | 1.43 | 0.01 | 0.70 |

All of the bond lengths computed agree with literature values to within 0.1Å, confirming that the geometries have been optimised successfully.[35] All of the ions were found to be tetrahedral, with a bond angle of 109.47°, which is consistent with the literature.
As expected, the shortest bond length is observed for [BF4]- 1.44Å. This bond is predicted to be short due to the strong interaction of the sp3 hybridised orbitals which are the smallest in this ion and have a similar size, enabling maximum orbital overlap in this ion.
There is then an increase in bond length as we go to [AlF4]-. This is consistent with the fact that as the difference in size of the interacting orbitals increases, on going to the larger Al atom, the extent of orbital overlap will decrease and the bond length will increase. However, this bond length is relatively short (2nd shortest of the four ions) which can be attributed to the fact that the largest ionic character of bonding is observed in this ion where the electronegativity difference between the two atoms involved in bonding is at its greatest.
The bond length increases as we go to [BCl4]-, comparing favourably with literature data. Compared to [AlF4]- there is a smaller electronegativity difference between the two atoms involved in bonding in this ion, contributing to the larger bond length of 1.92Å observed.
Finally, the largest bond length (2.25Å) is observed for [AlCl4]- which is consistent with theory. As there is a smaller electronegativity difference between Al-Cl compared to Al-F, the ionic character of the bond is expected to be lower, contributing to the longer Al-Cl bond length. Although Al and Cl are in the same period their orbital sizes are expected to be similar, but as both of these atoms are in the third period the orbitals involved in bonding are largest in this ion. Hence as the orbitals involved in bonding are more diffuse, the resulting bond formed is expected to be the longest in this case, which is indeed observed.
HOMO-LUMO Gap Comparison
An NBO analysis was completed for each ion; the input and output files are included in the previous sections. The magnitude of the HOMO-LUMO energy gap was found to increase as the bond length decreased. Analysis of the output files showed that HOMO-LUMO energy gap for [BF4]- was approximately twice that for [AlCl4]-. For [AlF4]- the gap was slightly larger than the HOMO-LUMO gap in [BCl4]-.
This information is consistent with the theory outlined above. Hence for [BF4]- the interacting orbitals are in the same period and are the smallest and of similar size, resulting in the largest splitting energy. The HOMO involves overlap of adjacent p orbitals on the halogen. As the p orbitals are smallest for fluorine this results in the lowest energy HOMO for this ion as the orbital overlap integral is largest for this ion. The LUMO involves an antibonding interaction between the s orbitals of central atom and the p orbitals of the halogen. The shorter the bond length, the larger the energy of the LUMO, as the s-p antibonding interaction is largest between those atoms which have similar sized, compact orbitals. Hence the largest antibonding interaction is expected for [BF4]- which also has the highest energy LUMO and the largest HOMO-LUMO gap.
In [AlCl4]- the orbitals involved in bonding are larger and more diffuse, resulting in a lower interaction and therefore a lower amount of orbital mixing and splitting, causing the HOMO-LUMO gap to be relatively small.
Total Energies
The stabilities of each ion in the gas phase is summarised in the table below.

Yet this does not provide extremely useful information for each ion and is not important during this investigation.
Charge Distribution
It was expected that as the electronegativity difference between the two atoms involved in bonding increases, the magnitude of the positive charge located on the central atom will also increase. This is what was observed, although the difference in electronegativity was found to be not as accurate in some cases.

| Ion | Charge on central atom |
|---|---|
| [AlF4]- | +1.288 |
| [BF4]- | +0.7804 |
| [AlCl4]- | +0.7801 |
| [BCl4]- | -0.127 |
The main factor in determining the magnitude of the positive charge on the central atom was found to be the presence of absence of the fluorine atom. When fluorine is present, there is a large electron withdrawal from the central atom, resulting in the largest positive charge located on the Al atom in [AlF4]-. As Boron is slightly less electropositive than Aluminium, the larger positive charge is seen on the the Al atom in [AlF4]-.
The electronegativity difference between B-F is 1.94 whereas it is 1.55 for Al-Cl. Hence a much larger positive charge is expected to be located on the Boron atom in [BF4]- than on the Aluminium atom in [AlCl4]-. This was the case, however there was only a 0.0004 unit of charge difference in each case. One reason for the lower than expected positive charge located on the B atom in [BF4]- could linked to the similar size of the B and F orbitals, which has been found to result in partial electron donation from the filled p orbtals on F to the electron deficient Boron centre.[36]
Another interesting observation made during the analysis of charge distribution was that in [BCl4]- there was computed to be a small negative charge located on the central Boron atom. This could have resulted from the fact that the electronegativity difference is smallest for these two atoms or due to an incorrect output or input file. Yet as there is a large difference in orbital size between Boron and Chorine this may contribute to the lower than expected electron withdrawal effect from the central Boron atom.
Further Applications
[BX4]- and [AlX4]- anions where (X=F, Cl, Br) are currently being investigated due to their use as superhalogen anions.[37] Superhalogens are molecules with electron affinities larger than those of the halogen atoms (fluorine 3.40eV, chlorine 3.62eV). Such species are of great importance in chemistry since they can be used for the oxidation of counterpart systems with relatively high ionisation potentials (such as O2 or Xe) and enable the synthesis of unusual chemical compounds (for example, containing noble gas atoms.[38] Additionally, molecules possessing high electron affinities are widely used in production of organic superconductors.
[BF4]- and [AlF4]- have been optimised by Gustav and co-workers, who found that they strongly bond an extra electron (the calculated EAs were 6.75 and 7.93eV respectively).[39] During the charge distribution analysis, the largest negative charge was found on these atoms, which is consistent with their findings.[40] Calculation of the vertical detachment energies for each compound by Gustav highlighted the use of these anions in superconductor production, stressing their importance beyond computational studies.
Mini Project- Conclusion
This mini-project highlighted the use of computational methods to accurately predict a variety of parameters for four ions, of which [BF4]- is a commonly used anion in ionic liquids.
Firstly, the infrared spectra were computed and compared with literature values. Each of the nine vibrational modes were predicted correctly in each case and Gaussian also enabled the prediction of which peaks were infrared inactive. An additional advantage of this method was the ability to detect infrared absorptions which are near the UV-region, which is difficult in the laboratory. Yet one limitation of this method was the greater inaccuracy at higher vibrational frequencies which results from anharmonicity of bonding not being taken into account. The absorption intensities and frequencies were also compared.
Bond angle and length analysis was then completed, which indicated highly accurate results in comparison to recently published results. In each case the ions were found to be tetrahedral and the largest percentage deviation from literature bond length was just 5%. The reasons for the different bond lengths were also provided, by comparison of the strength of orbital overlap and other important factors. HOMO-LUMO energy gaps were also compared, which were found to increase steadily as the bond length decreased. This can help to predict and compare the possible chemical properties of each ion in the gas phase.
Charge distribution analysis was completed and the results analysed by comparing the electronegativity difference of the atoms involved in bonding. As expected, the largest positive charge was seen on the Al atom in [AlF4]-, but important findings were also noted. For example, the positive charge on the central Boron atom in [BF4]- was found to be approximately to that on the aluminium atom in [AlCl4]-. One explanation of this result provided is that the large size of the Aluminium and Chlorine atoms may have resulted in a lower than expected withdrawal of electron density away from the central Aluminium atom, due to the large size of the interacting orbtitals.
On balance, computational methods have been extremely useful in accurately predicting a wide range of values for each ion. As this modeling method is carried out in the gas phase, it is difficult judge whether the expected properties will prevail in solution. Yet it does provide a useful initial insight into important parameters for each ion and is likely to be beneficial in enabling informed estimations of ionic properties to be made.
Recent Applications of Computational Inorganic Chemistry
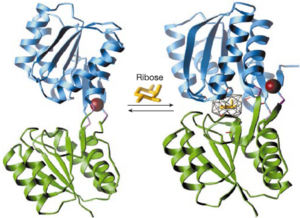
The formation of complexes between proteins and ligands is fundamental to biological processes at the molecular level. Manipulation of molecular recognition between ligands and proteins is therefore important for biological studies and has many biotechnological applications including the construction of enzymes and biosensors. Although many advances have recently been made in this area, the manipulation of binding sites remains a major challenge. [41]
Recently a structure based computational method has been used to redesign protein ligand-binding specificities, as reported in Nature.[42] By using computational models, soluble receptors which bind trinitrotoluene, L-lactate or serotonin with high selectivity and affinity were constructed. This enabled regions which indicate the presence of strong ligand binding interactions to be targeted and new probes to be designed and tested before actually synthesising high affinity receptors.
The biological and biosensing activities of the designed receptors highlight the potential applications of computational chemistry, enabling time to be saved during synthesis and key interactions to be probed.
Conclusion
The first part of this investigation highlighted the advantage of computational methods to accurately predict a range of parameters for borane. A comparison of the NBOs indicated the value of this method compared to LCAO methods. A similar optimisation and frequency analysis was performed for TlBr3, giving bond lengths which agreed with literature values. Geometrical isomerism of a Molybdenum complex was then completed which confirmed the accuracy of computational methods in optimising and analysing large complexes. The mini-project involved a detailed compilation and analysis of a wide range of parameters for four ions, two of which are common anions in ionic liquids. The of the bond lengths and infrared absorptions for each ion agreed with literature values. An identification and explanation of key trends and unexpected results was also provided. Applications of these species as superhalogen anions was also noted.
Computational chemistry is rapidly emerging as a subfield of theoretical chemistry, where the primary focus is on solving chemically related problems by calculation. One of the main problems in computational chemistry is selecting a suitable level of theory for a given problem, and to be able to evaluate the quality of the obtained results. The real strength of computational chemistry is the ability to generate data (for example by analyzing the wavefunction) from which a human may gain insight, and thereby rationalize the behaviour of a large class of molecules. Such insights and rationalizations are much more likely to be useful over a longer time period than the raw results alone.
References
- ↑ C. J. Cramer, Essentials of Computational Chemistry: Theories and Models, 2002, John Wiley and Sons Ltd, p 253-7
- ↑ C. J. Cramer, Essentials of Computational Chemistry: Theories and Models, 2002, John Wiley and Sons Ltd, p 254
- ↑ C. J. Cramer, Essentials of Computational Chemistry: Theories and Models, 2002, John Wiley and Sons Ltd, p 253
- ↑ JP. Hohenberg, W. Kohn, Phys. Rev., 1964, 136, B864: DOI:10.1103/PhysRev.136.B864
- ↑ E. Davidson, D. Feller, Chem. Rev., 1986, 86, 4: DOI:10.1021/cr00074a002
- ↑ M.S. Schuurman, W.D. Allen, H.F. Schaefer III, J. Comput. Chem., 2005, 26, 1106: DOI:10.1002/jcc.20238
- ↑ M.S. Schuurman, W.D. Allen, H.F. Schaefer III, J. Comput. Chem., 2005, 26, 1106: DOI:10.1002/jcc.20238
- ↑ J.N. Murrell, S.F.A. Kettle and J.M. Tedder,The Chemical Bond,1985, John Wiley and Sons, pp. 3-7
- ↑ Comparison of racemization processes in 1-arylpyrimidine-2-thione and 3-arylthiazoline-2-thione atropisomers and their oxygen analogs; C. Roussel, M. Adjimi and A. Chemlal, 1988, DOI:10.1021/jo00256a03 10.1021/jo00256a03
- ↑ J.N. Murrell, S.F.A. Kettle and J.M. Tedder,The Chemical Bond,1985, John Wiley and Sons, p. 3
- ↑ J.N. Murrell, S.F.A. Kettle and J.M. Tedder,The Chemical Bond,1985, John Wiley and Sons, p. 9
- ↑ 12.0 12.1 K.K. Baeck, R.J. Bartlett, J. Chem. Phys, 1997, 106, 4604: DOI:10.1063/1.473986
- ↑ K.K. Baeck, R.J. Bartlett, J. Chem. Phys, 1997, 106, 4604: DOI:10.1063/1.473986
- ↑ R. M. Silverstein, C. G. Bassler and T. C. Morill, Spectroscopic Identification of Organic Compounds, John Wiley and Sons, 5th Edition, 1990, pp. 3-4.
- ↑ E. B. Ebsworth and D. W. H. Rankin, Structural Methods in Inorganic Chemistry, Blackwell Scientific, 2nd Edition, 1991, p 8.
- ↑ Imperial College London: Second Year Synthesis Laboratory Manual Part 2, p 27.
- ↑ K. Nakamoto, Ifrared and Raman Spectroscopy of Inorganic and Coordination Compounds, John Wiley and Sons, New York, 3rd Edition, 1978.
- ↑ M. Y. Darensbourg and D. J. Darensbourg, J. Chem. Ed., 1970, 47, 33
- ↑ M. Y. Darensbourg and D. J. Darensbourg, J. Chem. Ed., 1970, 47, 33
- ↑ M. Y. Darensbourg and D. J. Darensbourg, J. Chem. Ed., 1970, 47, 33
- ↑ F.A. Cotton, Inorg. Chem., 1964, 3, 702: DOI:10.1021/ic50015a024
- ↑ F.A. Cotton, Inorg. Chem., 1964, 3, 702: DOI:10.1021/ic50015a024
- ↑ Y. C. Shen, P. C. Upadhya, E. H. Linfield. Appl. Phys. Lett., Vol. 82, No. 14, 7 April,2003[1]
- ↑ P. Wasserscheid and T. Welton Ionic Liquids in Synthesis, Wiley, 1st Edition, 2003, p 1.
- ↑ P. Wasserscheid and T. Welton Ionic Liquids in Synthesis, Wiley, 1st Edition, 2003, p 2.
- ↑ P. Wasserscheid and T. Welton Ionic Liquids in Synthesis, Wiley, 1st Edition, 2003, p 3
- ↑ P. Hunt, J. Phys. Chem. B, 2007, 111, 4844-4853 DOI:10.1021/jp067182p
- ↑ P. Hunt, J. Phys. Chem. B, 2007, 111, 4844-4853 DOI:10.1021/jp067182p
- ↑ P. Wasserscheid and T. Welton Ionic Liquids in Synthesis, Wiley, 1st Edition, 2003, p 3.
- ↑ P. Wasserscheid and T. Welton Ionic Liquids in Synthesis, Wiley, 1st Edition, 2003, p 4.
- ↑ C. Sikorska, S. Smuczynska, P. Skurski and I. Anusiewicz, Inorganic Chemistry, 2008, Vol 47, No. 16, 7348-4353 DOI:10.1021/ic800863z
- ↑ C. Sikorska, S. Smuczynska, P. Skurski and I. Anusiewicz, Inorganic Chemistry, 2008, Vol 47, No. 16, 7348-4353 DOI:10.1021/ic800863z
- ↑ C. Sikorska, S. Smuczynska, P. Skurski and I. Anusiewicz, Inorganic Chemistry, 2008, Vol 47, No. 16, 7348-4353 DOI:10.1021/ic800863z
- ↑ C. Sikorska, S. Smuczynska, P. Skurski and I. Anusiewicz, Inorganic Chemistry, 2008, Vol 47, No. 16, 7348-4353 DOI:10.1021/ic800863z
- ↑ C. Sikorska, S. Smuczynska, P. Skurski and I. Anusiewicz, Inorganic Chemistry, 2008, Vol 47, No. 16, 7348-4353 DOI:10.1021/ic800863z
- ↑ Shriver and Atkins, Inorganic Chemistry, 4th Edition, Oxford University Press, 2006, p 288.
- ↑ F. Wudl, Acc. Chem. Res., 1984, 17, 227-232.
- ↑ G. L. Gustav and A. I. Boldyrev, Russ. Chem. Rev., 1987, 56, 519-531.
- ↑ N. Bartlett, Proc. Chem. Soc., 1962, 218.
- ↑ G. L. Gustav and A. I. Boldyrev, Chem. Russ. Phys., 1981, 56, 277-283.
- ↑ Bishop, A. et al., Annu. Rev. Biophys. Biomol. Struct. 2000, 423, 29, 577–606 DOI:10.1146/annurev.biophys.29.1.577
- ↑ Loren L. Looger, Mary A. Dwyer, James J. Smith and Homme W. Hellinga, Nature, 2002, 423, 185-190 DOI:10.1038/nature01556


