Rep:Mod2:240189cra
Computational Labs 2010: Module 2: Inorganic
Section 1
Analysis of BH3
Geometry Optimisation
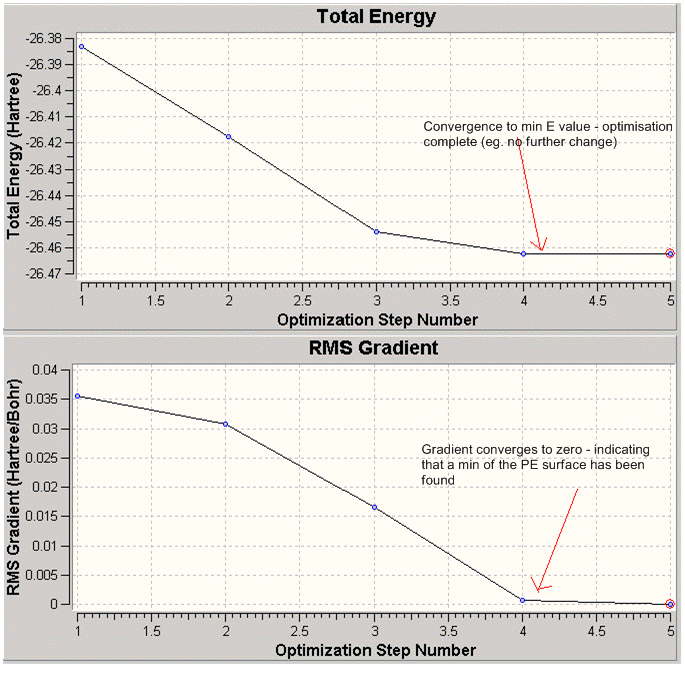
Distortion of the BH3 molecule, away from it's inital starting parameters (eg. all B-H bond lengths set to 1.5Å), followed by optimisation, using the DFT-B31YP method and 3-21G basis set yieled the following results.
BH3 was successfully optimised to it's optimum conformation. Comparison to the experimentally observed bond length revealed this to be correct.
The plots of the total energy and the RMS gradient against the optimisation step indicate the successful completion of the optimisation.
What is a gradient?
- Take the PES of a BH3 molecule
- The minimum on this surface represents the equilibrium conformation of BH3 (eg. the lowest energy conformation)
- By taking the first derivative of the PES (N.B -dE/dr = Force, therefore at minima forces on molecule are balanced)the stationary points can be found. Hence, the optimised structure can be isolated.
How can maxima/ minima stationary points be distinguished?
- When dy/dx = 0, this is true for both maxima (transition states) and minima (ground state conformation)
- In order to distinguish between the two, the second derivative of the PES can be calculated
- This second derivative equates to the freqencies of vibration of the molecule
- Hence, if all vibrations are positive, a successful optimisation can be confirmed (see next section).
| Comment | ||
|---|---|---|
| File Type | log | Guassian output file |
| Calc. Type | FOPT | |
| Calc. Method | RB3lYP | |
| Basis set | 3-21G | |
| Energy/a.u. | -26.46 | |
| RMS grad. Norm. /a.u. | 0.00000285 | < 0.001 - suggests optimisation complete |
| Dipole mom. /Debye | 0.00 | |
| Point Group | D3h | Correct- can be confirmed by inspection |
| Job CPU time | 28 s |
| Calculated value | Lit. value | |
|---|---|---|
| optimised B-H bond length/Å | 1.19(435) | 19.00 |
| optimised H-B-H angle/° | 120.0 |
From the graphs (Fig.1.), it can be seen that BH3 was successfully optimised in 4 steps. The fifth yields the same result as the 4th, hence the optimisation was terminated.
Vibrational Analysis
Using the same method and basis set as before the vibrations of BH3 were computed.
The output file was checked to ensure the calculation had successfully converged:
        Item               Value     Threshold  Converged?
Maximum Force            0.000090     0.000450     YES
RMS     Force            0.000064     0.000300     YES
Maximum Displacement     0.000354     0.001800     YES
RMS     Displacement     0.000250     0.001200     YES
Predicted change in Energy=-4.767110D-08
Optimization completed.
   -- Stationary point found.
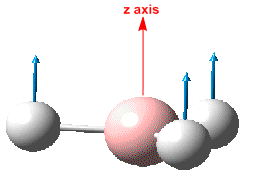
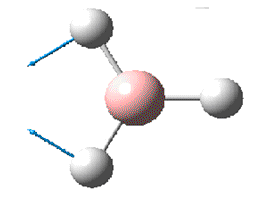
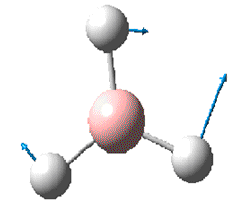
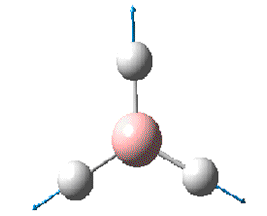
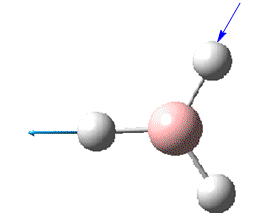
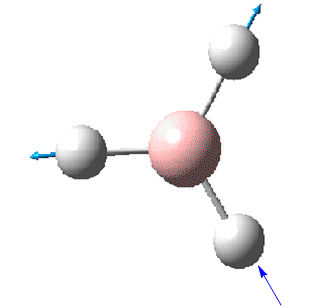
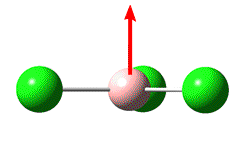
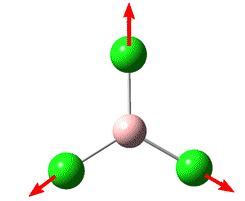
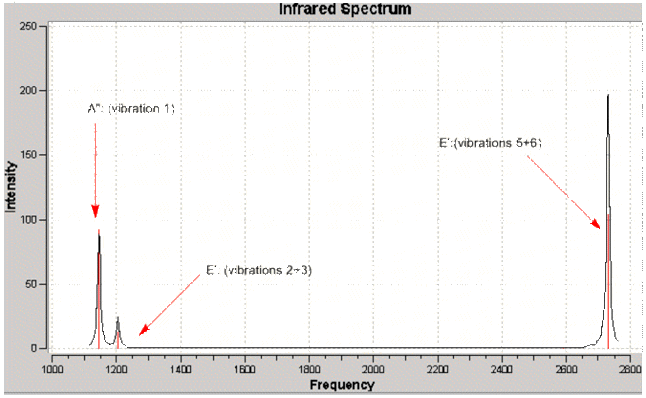
The output file was also searched to find the values of the 'low frequencies'. As should be expected there are 6 of these (eg. from 3N-6) and can be confirmed to be much smaller than the observed vibrations. The output file also lists the vibrations along with the corresponding symmetry, energy and IR intensity. This information has been summarised in table.??.
Full mass-weighted force constant matrix:
Low frequencies ---   -0.3716   -0.0098   -0.0019   37.2426   37.9575   37.9593
Low frequencies --- 1146.0292 1204.8630 1204.8640
Diagonal vibrational polarizability:
       0.6047526       0.6046824       1.8987108
Of significance is the fact that all of the vibrations are positive, confirming, for reasons already noted, that the optimisation carried out in the above section was successful (eg. a minima was found).
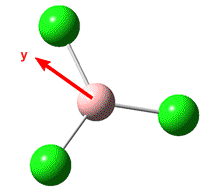
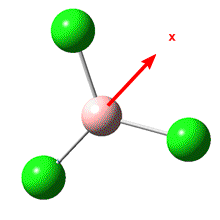
Although six separate vibrations are listed above, it can bee seen that there are two sets of degenerate vibrations. Based on this only 4 peaks would be expected. However, it is also evident that one of the vibrations does not result in a change in dipole moment, hence has zero IR intensity - resulting in 3 peaks as seen on the IR spectrum.
MO analysis of BH3
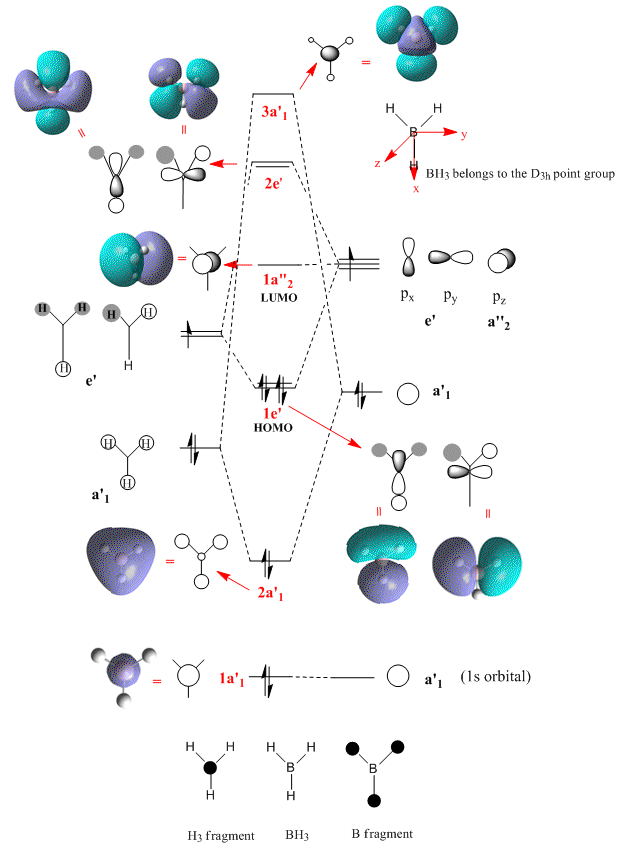
The molecular orbitals of BH3, and their respective energies, were calculated using the DFT- B3LYP method and the 3-21G basis set.
How do the MOs generated via this quantitative, quantum mechanical approach, compare with the the respresentations of MOs generated from the LCAO qualitative approach?
Atomic orbitals (AOs) have been used as a basis set to form the MOs in the qualitative approach. As a result the MOs appear to be, very much centred on the atoms. Although the relative contributions of each AO to the MO can be represented to an extent(eg. the relative size), it is harder to visualise how the AOs interact/mix in 3D to give the final MO.
DFT (density functional theory), based on quantum mechanics, uses the electron density (eg. the probability of an electron being at a particular point in space), over all space, to solve the problem. As a result, the MOs generated show a greater degree of delocalisation over the whole molecule (eg. the HOMO-1, 2a'1, MO).
When comparing the LCAO MOs with the calculated ones, it can be seen that LCAOs offers a very good first approximation. The relative ordering and degeneracy of the MOs is correct, the phase of the orbitals is correct and a rough idea of how the 3D MOs might look can also be gained (this is generally more difficult for the antibonding orbitals with out of phase interactions).
However, the LCAO approach has restricted itself to only using a limited number of atomic orbitals and does not take into account other possible effects that may impact on the MO . eg. electron - electron interactions. It is therefore not surprising that some of the calulated MOs take forms that could not be approximated using LCAOs ie. the shape of one of the 2e' MOs would be quite difficult to get completely correct.
As metioned, the relative ordering of the MOs shows good agreement. However, the ordering of the 3a'1 and the 2e' orbitals is difficult to ascertain for sure. In the MO diagram shown, the 3a'1 orbitalal has been drawn higher in energy than the 2e' orbital, due to the fact that this is the order that the quantitative approach resulted in. Nevertheless, a look at the energies of these orbitals shows that there is not a large degree of separation (eg. when compared to the HOMO and HOMO-1), and hence using a different quantitative method or basis set could alter this.
Using LCAOs to predict MOs before analysing the 'real' calculated ground state MOs would probably be a good place to start (for managable systems at least), allowing some degree of feeling for whether the calculated MOs look plausible.
| MO | Energy/au |
|---|---|
| 1a'1 (HOMO-2) | -6.730 |
| 2a'1(HOMO-1) | -0.517 |
| 1e' (HOMO) | -0.356 |
| 1a"2 (LUMO) | -0.074 |
| 2e' (LUMO+1) | 0.188 |
| 3a'1 (LUMO+2) | 0.191 |
NBO Analysis
Analysis of BCl3
Geometry Analysis
To optimise BCl3, use of a pseudo potential [1],to simplify the model of the core electrons, is required.
| Comment | ||
|---|---|---|
| File Type | log | Guassian output file |
| Calc. Type | FOPT | |
| Calc. Method | RB3lYP | |
| Basis set | ||
| Energy/a.u. | -69.44 | |
| RMS grad. Norm. /a.u. | 0.00005905 | < 0.001 - suggests optimisation complete |
| Dipole mom. /Debye | 0.00 | Individual B(δ+)-Cl(δ-) dipoles cancel out |
| Point Group | D3h | Correct- can be confirmed by inspection |
| Job CPU time | 12s |
| Calculated value | Lit. experimental value | ||
|---|---|---|---|
| optimised B-Cl bond length/Å | 1.86(592) | 1.742 | |
| optimised Cl-B-Cl angle/° | 120.0 | (planar) |
The calculated bond length shows ~0.12Å difference from the experimental value. The calculated bond length can be quoted to 2dp, so the observed difference is greater than the error margin of the calulation. This indicates that the method/basis set used are not quite accurate enough. Using a higher level basis set (LanL2DZ), gives a value of 1.78(730)Å, much closer to the experimental value.

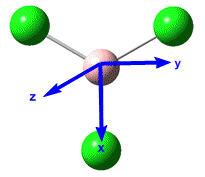
The ground state symmetry of BCl3 can be predicted to be D3h (Fig.)

The calculations for the optimisation and vibrational analysis only took 12 and 19 seconds respectively. This is short period of time, but it ought to be considered that BCl3 is a realtively simple molecule, and that only a mdoerately sufficient basis set was used in the calculation. Hence, for more complicated jobs (see following sections), the SCAN service, with greater computing power, is required to run them.
Guassview and Bonding
Gaussview does not always draw in the expected bonds for a molecule. e.g. it might replace a triple bond with a double or single (see mini project) or even not draw in a bond at all (see cis - trans isomerisation). This does not mean, however, that the expected bond is not present. It does mean that the bond is outside the parameters/criteria Guassview sets for the expected bond. Hence, as Guassview uses data largely from organic chemistry to base it's bonding model on, any bond 'unusual' with respect to this, eg. inorganic complexes, may not be fully recognised (eg. it is not drawn in by Guassview but the atoms still does occupy the correct regions of space).
This leads to the question; what is a bond?
Consider a diatomic molecule. When the individual atoms approach one another, such that the interactions between them result in overall stabilisation (eg. a decrease in total energy w.r.t. the sum of the individual atomic energies), the atoms are considered to be bonded. How can this bond be described? Using a localised view, it could be described as a region of high electron density between the atoms, such that they now exist as a 'bound' entity.
Using MO theory,a more delocalised view of bonding, a bond could be described as existing if the electrons from the participating atoms occupy regions of constructive interference between the AOs rather than deconstructive eg. if the elctrons occupy MOs (regions of space) where they result in a lowering in energy of the molecule w.r.t the individual atoms.
Vibrational Analysis
The frequencies of vibrations for BCl3 were computed, using the same method and basis set as the optimisation (see above).
Why is it important to use the same method and basis set for both the optimisation and frequency calculations?
- Vibrational analysis can be used to determine whether or not a structure has been successfully optimised (calculated frequencies are related to the second derivative of the PES of the molecule -see earlier discussion)
- The results will only be relevent, however, if the method/basis set are the same in both calculations.
- If a different method/basis set were to be used, the frequncies calculated may not relate to the optimised molecule in question, and hence, analysis of the success of the optimisation would not be possible.
The output file was consulted to ensure that the calculation had succssfully converged and that the 'low frequencies' were sufficiently smaller than the main vibrations (which they are):
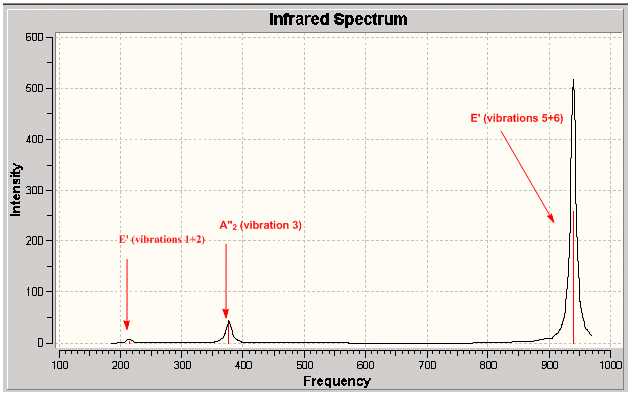
Low frequencies ---   -8.7725   -4.0872   -4.0872   -0.0021    0.0050    0.0093
Low frequencies ---  214.1314  214.1321  376.9406
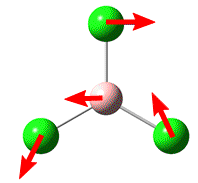
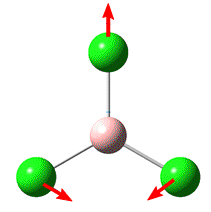
As with the case for BH3, the predicted IR spectrum displays 3 observable peaks despite there being 6 distinct calculated vibrations. Again, this is due to two degenerate sets of vibrations and one non- IR active vibrational mode.
Section 2
Analysis of the cis and trans isomers of Mo(CO)4L2
Octahedral Mo(CO)4(PPh3)2 can exist as either the cis or trans geometric isomer. One of which is thermodynamically more stable. A second year lab experiment indicated this to be the trans - isomer, at least in the solid state. Due to the different symmetry of the molecules, IR spectroscopy can be used to differentiate between the two, based on the number of observed carbonyl stretching frequencies.
- Can DFT be used to confirm the relative stabilities of the isomers and to predict the IR spectrum of each isomer?
However, as triphenylphosphine ligands have quite a large degree of conformational flexibility, it would take a significant amount of time to complete the required calculations. Hence, the phenyl groups have been replaced by chlorine groups, which supposedly exhibit similar electronic properties to the phenyl groups. How well this approximation holds will have to be determined.
Geometry optimisation
An initial optimisation of both isomers was performed using the DFT-3BLYP method and the LanL2MB basis set. The optimised geometries of this were then manually changed into the required configuration to ensure that the global minimum (eg. the most stable conformation) was found upon a second optimisation, using the more accurate basis set, LanL2DZ.
| Parameter | Cis.calc.DOI:10042/to-4478 | Cis. Lit [1] | Trans. Calc.DOI:10042/to-4477 | Trans. Lit [2] |
|---|---|---|---|---|
| r(Mo-P) /Å | 2.51 | 2.58 | 2.45 | 2.50 |
| < P-Mo-P/° | 94 | 104.62 | 177 | 180.00 |
| r(Mo-C(O)) cis | 2.06 | 2.06 | 2.06 | 2.02 |
| r(Mo-C(O)) trans | 2.01 | 1.97 | - | - |
| r(CO) cis | 1.14 | 1.17 | 1.17 | 1.17 |
| r(CO) trans | 1.16 | 1.18 | - | - |
N.B Both literature sources refer to Mo(CO)4(PPh3)3 rather than the Mo(CO)4(PCl3)3 studied.
- The calculated P-Mo-P angle in the cis isomer is a lot closer to the ideal octahedral angle of 90° than the actual PPh3 dervivative. This does not mean that the calculation is poor,but instead indicates that the choice of Cl to replace Ph groups is a poor match in terms of steric contributions. The triphenylphosphine groups, being very bulky, result in a larger deviation away from this ideal angle, to reduce steric interactions.
- In Mo(CO)4(PPh3)3 the two PCl3 groups are almost perfectly eclipsed relative to one another. In contrast the PPh3 groups in Mo(CO)4(PCl3)3 appear to be staggered in the X-Ray crystal structure. This difference could be due to the larger size of the phenyl groups, such that it is too energetically costly for them to adopt an eclipsed conformation, whereas for the chlorine case this is not so. However, the eclipsed nature of the PCl3 ligands might explain why they are not quite linear.
- In both the experimental and calculated cases, the Mo-P bond lengthgs for the trans isomer are significantly shorter than those of the cis isomer. Again, this is likely to be due to steric interactions. A shorter bond length results in more clash between the ligands - hence, by increasing the bond length in the cis isomer, these interactions can be minimised. However, Hogarth and Norman [2] argue that the extent to which the Mo-P bond is shortened in the trans isomer cannot be explained by steric factors alone, and suggest that a trans effect is likely to play a role.
- For the cis isomer, the calculation correctly demonstrates that the cis Mo-C bond lengths are longer than those trans. This is probably due to electronic effects (eg. a trans effect). The phospine ligand is an electron donor, donating it's lone pair of electrons into a suitable orbital on the metal centre. Hence the Mo-C bond trans to the PR3 group is strengthened and therefore, shortened. As the carbonyl group is a good π-backbonding acceptor, it should be expected that if the M-C bond strength increases, that more electron density should be available to be placed into the antibonding π CO orbital, resulting in an increase in the CO bond length. This is what is observed; the trans CO bond lengths are longer than the cis. Comparison to the trans isomer, indicates that trans effect is not affecting the CO bond lengths, as would be expected.
- Overall, the results indicate that chlorine is a reasonable replacement for phenyl in terms of electronic interactions, if not steric bulk.
Relative energies of the isomers
Experimental results indicate that trans Mo(CO)4(PPh3)2 is thermodynamically more stable than it's cis isomer and hence, isomerisation between the two is relaltively easy. The most common explanation for this is that upon isomerisation to the trans isomer, steric interaction between the two bulky phosphine ligands is reduced. Hence, the trans isomer is energetically more favourable.
The calculated results however, indicate that the cis isomer, based on Mo(CO)4(PCl3)2, is energetically more favourable by ~ 2.7 kJmol-1. As the error for the energy calculation is ~ 10kJmol-1, the results are by no means conclusive. However, it should be noted that the calculated values are for the gas phase, whereas the experimental results are for solid state at room temperature. Furthermore, DFT energy calulations [3] on a variety of M(CO)4(PR3)2 complexes revealed that in the gas phase, the cis isomer was more stable for all of them, including Mo(CO)4(PPh3)2. As a result they suggest that electronic factors must play an important role in stabilising the cis isomer and that the stability of the trans isomer in the solid state could be due to other factors, rather than steric effects.
| Trans - isomer | Cis- isomer | |
|---|---|---|
| Energy/ a.u. | -623.57(603) | -623.57(707) |
Nevertheless, other evidence [1] does seem to indicate that by changing the nature of the PR3 ligand, the relative stabilities of the cis and trans isomers can be adjusted. If the steric bulk of the ligand were to be increased the trans isomer would be expected to be more energetically favoured. Furthermore, by increasing bond length and decreasing the 'cone angle' of the ligand, the cis isomer could be made to be less thermodynamically unfavoured.
Running calculations on very bulky ligand is not practical. However, the optimisation of a less sterically demanding complex and comparison to the above results, may reveal whether or not changing the steric bulk affects the thermodynamic properties.
| Trans - isomer | Cis- isomer | |
|---|---|---|
| Energy/ a.u. | -537.43(069) | -537.43(766) |
PH3 is both less sterically demanding than PCl3 and less electron donating. As with Mo(CO)4(PCl3)2 the results seem to sugest that the cis isomer is more stable in the gas phase, although by a more significant amount, ~-18kJmol-1, now greater than the error margin of the calculation. PH3 is both less sterically demanding than PCl3 and less electron donating. Hence, this would suggest that the relative stabilisation is due to a decrease in steric interactions.
As with BCl3 and BH3, before analysis of the above geomtries, a frequency analysis of all isomers was needed in order to confirm that a minimum geometry had been found.
Vibrational analysis
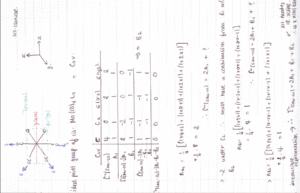
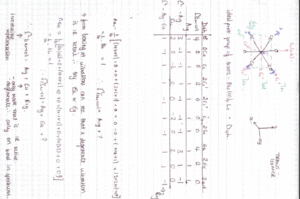
Group theory can be used to predict the number of carbonyl stretches observed for both cis and trans isomers of Mo(CO)4L2. If L is assumed to be a point ligand with no symmetry of it's own, then the ideal points of the isomers can be worked out to be C2v for the cis isomer and D4h for the higher symmetry trans isomer. Applying group theory (See figures below for method and results), predicts that 4 CO stretches will be observed for the cis isomer and 1 for the trans isomer (only the degenerate E1u mode is IR active).
| no | Description | Freq./cm-1 | Lit[4]. Freq/ cm-1 | IR intensity | Symmetry (C2v point group) |
|---|---|---|---|---|---|
| 1 | 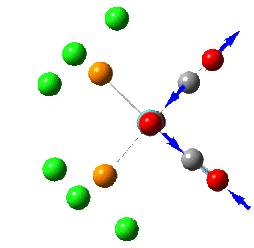 |
1945 | 1897 | 763 | B2 |
| 2 | 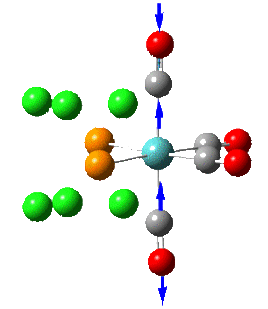 |
1949 | 1908 | 1499 | B1 |
| 3 | 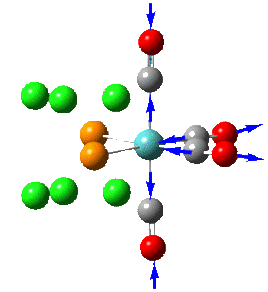 |
1958 | 1927 | 633 | A1 |
| 4 | 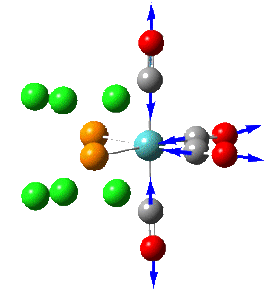 |
2023 | 2023 | 597 | A1 |
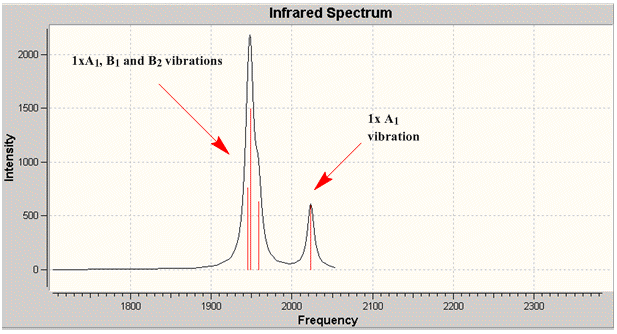
Four distinct carbonyl frequencies have been calculated, in agreement with the prediction for the cis isomer. The differences between the literature and computed values could be partly due to the 10% systematic error associated with the frequency calculation and also due to the different phases in which the molecule is in (eg. gas phase for calculated).
| no | Description | Freq./cm-1 | Lit [4]. Freq/ cm-1 | IR intensity | Symmetry (D4h point group) |
|---|---|---|---|---|---|
| 1 | 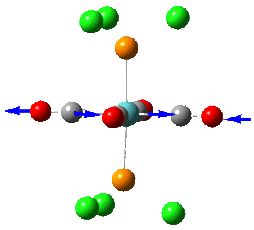 |
1950 | 1901 | 1475 | E1u |
| 2 | 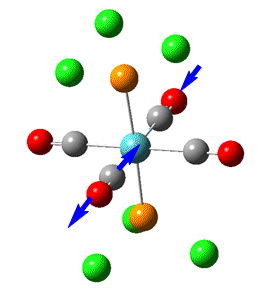 |
1951 | 1901 | 1467 | E1u |
The two degenerate E1u vibrations result in one clear peak typical of the trans isomer. However, when the vibrations are listed in guassview, two more CO stretches were also apparent, with a non-zero IR intensity (albeit so small not observable on the IR spectrum). Although these B1 and B2 stretching modes should be non-IR active under ideal D4h symmetry, the molecule does not quite perfectly fit this 'ideal' symmetry.
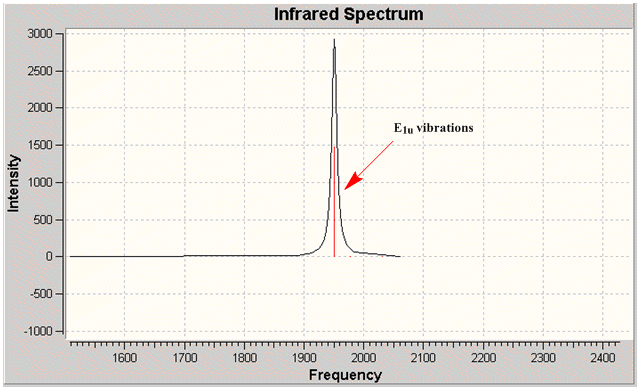
Two low frequency (eg. <20cm-1)vibrations are present for each isomer. These low energy vibrations are easily activated at room temperature and hence, the molecule would be undregoing such motions at room temperature.
| heading | heading | |
|---|---|---|
| Cis | ||
| Trans | 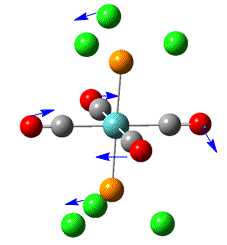 |
Mini Project: Investigation into multiple bonding of heavier elements of group 4, Si and Ge
The heavier group 4 analogues of alkenes and alkynes display a greater variety of structural conformations, dependent on the substituent and size of the group 4 element. Practically, these molecules generally require relatively large subtituents in order to be experimentally isolated, if they can be at all. Computational chemistry, therefore, provides a convenient way in which a wide range of otherwise unobtainable structures of group 14 double and triple bonds can be studied and rationalised.
Final calculations were performed using the B3LYP method and the LanL2DZ pseudo potential and basis set, including the 'extra basis' to take into account the dAO functions (as heavier elements are being studied).
A 2001 literature [5] example found, based on the DFT study of Germanium and Tin triple bonds also chose to use the B3LYP method but opted for the 3-21G* basis set, based on the size of the substituents they were using and the fact that upon comparison to use of a higher basis set, results showed minimal deviation.
The choice of method/ basis set used here therefore seems reasonable.
Following an initial 'loose' optimisation with the LanL2MB psuedo potential/basis set, a second optimisation using the more accurate LanL2DZ basis set and a tighter convergence was used. Frequency calculations (see earlier section for explantion of this) were performed for each optimised structure to confirm whether or not a minimum energy conformation had been found. If significant negative vibrations were obsereved, the structure was manually adjusted and re-optimised until a minimum energy confrormation was found.
Double bonds: Disilenes and Digermenes

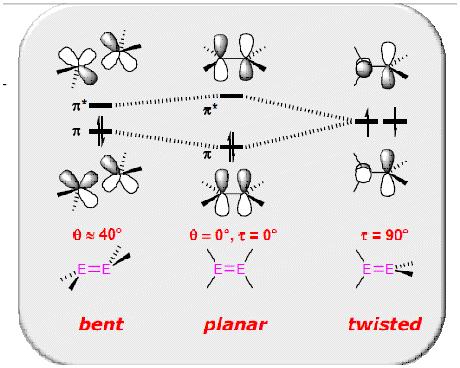
Alkenes are generally always planar structures, but deviations away from planarity occurs when carbon is replaced by a heavier group 4 element. Thus, disilenes commonly exhibit trans bending and/ or twisting. Why? Use of the CGMT model (Fig.?) is helpful in demonstrating how the carbene/ silene fragments combine in order to form a double bond. For carbenes, the triplet state is generally the ground state electronic configuration (for carbenes bearing large, electropositve substituents - Bent's rules), hence direct head on overlap of 2x singly occupied p orbitals, to form a σ bond, and side on overlap of the 2x singly occupied p orbitals results in formation of a planar double bond. In contrast, the singlet state of a silene is generally more stable. Combination of 2 x singlet silene fragments results in a trans bent structure. For a planar structure to form, excitation to the higher energy triplet state would be required. If the energy for this promotion was not recouped by the formation of a double bond, the formation of a 'classical' double bond, would not occur [6]
How does trans bending and twisting affect the HOMO-LUMO energy gap?
Experimentally, evidence for these deviations away from a planar structure can be obtained by performing a UV-Vis absorption analysis eg. the different structures appear different colours. This is due to the change in ΔE between the HOMO and LUMO MOs upon distortion away from planarity. As fig.?. demonstrates, increasing the transbent angle, β, decreases the enegry gap w.r.t the planar conformation. Increasing the twist angle towards 90°,results in the HOMO and LUMO orbitals moving towards degeneracy.
Use of DFT calculations to investigate the following:
- How does substituent size effect the conformation?
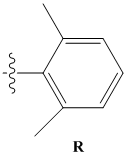
- By changing the size of the substituent, how will the conformation about the E=E double bond change? - Compare results between 4x methyl substituents and 4x larger R groups (N.B although a very bulky substituent would be better in terms of comparison, the degree of conformational flexibility/computational time wuld be high, hence a smaller R group was chosen).
- How does increasing the group 4 element from silicon to germanium effect the conformation?
- Does MO analysis support literature predictions?
- How does a change in conformation affect the HOMO-LUMO gap? -Will the resulting trans- bent MOs show the expected deviations away from the ideal π orbital?
| R group | Parameter definition |
|---|---|
 |
 |
| Parameter | Si2Me4 | Si2R4 | Ge2Me4 | Ge2R4 |
|---|---|---|---|---|
| Description | Trans bent | Almost planar | Trans bent | Trans bent and twisted |
| r(E=E)/Å | 2.17 | 2.16 | 2.64 | 2.67 |
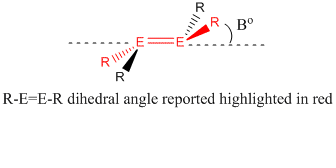
| R-E=E-R /° / | 180.0 | 178.2 | 180.0 | 173.9 |
| β/° | 16 | 0.9 | 28 | 28 |
| Final optimisation DOI | DOI:10042/to-4567 | DOI:10042/to-4568 | DOI:10042/to-4571 | DOI:10042/to-4573 |
| Vibration DOI | DOI:10042/to-4569 | DOI:10042/to-4570 | DOI:10042/to-4572 | DOI:10042/to-4572 |
- All structures, except Si2R4, show the expected trans - bent conformation.
-Although for very large/bulky substituents a planar conformation may be adopted (they can potentially stabilise the triplet state, the R group used here is not realistically large enough to do so. It is therefore more likely that the global minimum optimised structure has not been found. As R2Si=SiR2 is known to have a shallow potential surface, relative to R2C=CR2, there may only be a small difference in energy between the planar and trans-bent structures.
- Upon going from Si2Me4 to Ge2Me4 there is an increase in the trans-bent angle. This could possibly be due to steric reasons or possibly the relative degree bending that is requred in order for a double bond to form is greater for heavier elements.
- Comparison of Ge2Me4 to Ge2R4 shows that instead of favouring a planar conformation, the bulkier ligand results in twisting about the central Ge=Ge bond. The bond length is also slightly longer, a would be expected for an increase in substituent size.
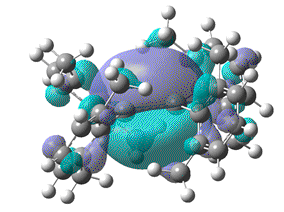
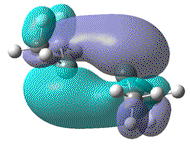
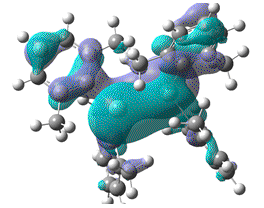
- Visually, it can be seen that a small trans - bent angle of 15° does not result in a significant change to the π bonding MO. A larger trans bent angle of 28°, as seen for the Germanium examples results in a more noticable, but still quite small change.
Can MO analysis be used to support the above observations?
- On increasing the trans - bent angle on going from Si2Me4 to Ge2Me4 there is a corresponding decrease in the HOMO-LUMO ΔE. However, whether or not Si and Ge examples can be compared directly is uncertain.
- Both Ge2Me4 and Ge2R4 have the same trans bent angle. However, Ge2R4 has a smaller HOMO-LUMO ΔE. This could be due to the degree of twisting which it displays but arguably, the change in substituents would also effect the ΔE value
Therefore, in order to gain a more reliable view of how conformational change results in corresponding MO changes, the effect of changing the dihedral angle between two substituents cis to one another on Si2Me4 was looked at.
| Si2Me4 | Si2R4 | Ge2Me4 | Ge2Ph4 | |
|---|---|---|---|---|
| HOMO-LUMO energy/a.u | 0.142 | 0.123 | 0.107 | 0.092 |
| HOMO | 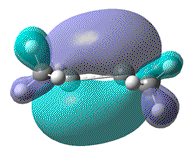 |
 |
 |
 |
| MO DOI | DOI:10042/to-4591 | DOI:10042/to-4590 | DOI:10042/to-4589 | DOI:10042/to-4588 |
Direct comparison between the results listed below can be made.
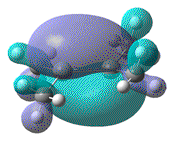
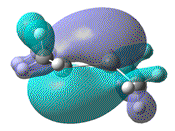
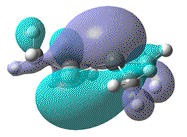
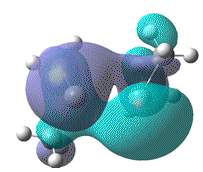
- It is evident that a larger degree of distortion between the two Si2Me2 fragments does result in a decrease in the HOMO-LUMO ΔE, in agreement with literature predictions.
- Furthermore, the effect that this distortion has on the MO, resulting from the overlap of 2x pz AOs, can be more clearly seen. In order to show that upon forming a twist angle of 90°, the HOMO and LUMO orbitals become degenerate, rotation about the central Si=Si bond, with one fragment fixed in place should have been studied.
| Dihedral angle | 0° | 30° | 60° | 90° | 180° |
|---|---|---|---|---|---|
| HOMO-LUMO energy/ a.u | 0.158 | 0.144 | 0.130 | 0.115 | 0.063 |
| HOMO | 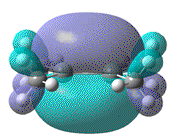 |
 |
 |
 |
 |
| MO DOI | DOI:10042/to-4624 | DOI:10042/to-4626 | DOI:10042/to-4612 | DOI:10042/to-4627 | DOI:10042/to-4625 |
Triple bonds: Disilynes and Digermynes
Upon descending group 4, the heavier analogues of alkynes are expected to show significant trans- bending and a decrease in bond order. As fig.? demonstrates, there are several possible ways, based on resonance structures, of best describing the bonding nature of the silicon and germanium analogues.
- Can DFT be used to demonstrate:
- the change in the trans bent angle on going from silicon to germanium?
- the change in the trans bent angle on changing the substituent size?
- Will NBO charge analysis reveal which desription of bonding best describes the studied examples?

| Measured angle | |
|---|---|
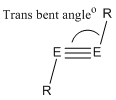 |
N.B. In the following description, an increase in the trans- bent angle (see above) equates to DECREASE in trans bending.
- Upon going from E2R4 to E2R2 there is a decrease in bond length , particulary for the Germanium case. This indicates that the structures do have a degree of triple bond character. Comparison of Ge2R2 to a literature [5] example of Ge2Tbt2 with a bond length of 2.231Å, indicates that the calculated bond lengths show reasonable agreement with literature values.
- Upon going from Silicon to Germanium there is a clear increase in the trans bendng, also in agreement with literature [5] findings (lit. values for Tbt2Ge2 and TbtSi2; 121.8° and 130.9° respectively).
- In contrast, increasing the size of the substituent decreases the trans bending, and also increases the bond length. However, as the R group is aryl, it could be argued that it has a greater preference to be more linear - greater ability for delocalisation across the molecule.
| Si2Me2 | Si2R2 | Ge2Me2 | Ge2R2 | |
|---|---|---|---|---|
| r(E-E)/Å | 2.11 | 2.12 | 2.28 | 2.30 |
| θ/° | 131.5 | 134.9 | 127.6 | 130.5 |
| Final optimisation DOI | DOI:10042/to-4595 | DOI:10042/to-4592 | DOI:10042/to-4594 |
- Although NBO analysis is by no means conclusive, for three of the cases the charges on the central group 4 elements, for each individual molecule, were the same . In contrast, Ge2Me2 shows a slight difference in the respective charge on the two Ge atoms. Although, this may be error within the calculation, it could possibly indicate that a more dipolar description of this molecule may be appropriate, in contrast, perhaps, to a radical desription of the other cases.
| Si2Me2 | Si2R2 | Ge2Me2 | Ge2R2 | |
|---|---|---|---|---|
| NBO charge on E/ | 0.345 | 0.394 | Ge(1) = 0.373 Ge(2)=0.360 | 0.424 |
| HOMO |  |
 |
 |
 |
| MO DOI | DOI:10042/to-4611 | DOI:10042/to-4610 | DOI:10042/to-4609 | DOI:10042/to-4608 |
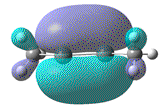
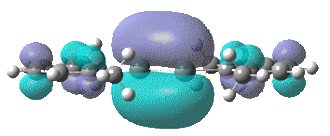
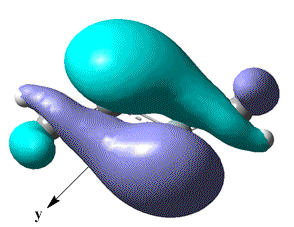
A look at the HOMO-1 MO of Si2Me2, suggests that it is formed from overlap of 2x py AOs and does indicate a larger and equal amounts of electron density on sites where a radical elctron may be expected to occupy. Whether or not this is speculation, it does perhaps explain the triple bond character.
Unfortunately mini project is not quite complete (ran out of time).
References
- ↑ 1.0 1.1 F.A.Cotton, D.J.Darensbourg, S.Klein, B.W.S. Kolthammer, Inorg. Chem., 1982, 21, 294 DOI:10.1021/ic00131a055
- ↑ 2.0 2.1 G.Hogarth, T.Norman, Inorganica Chimica Acta, 1997, 167 DOI:10.1016/S0020-1693(96)05133-X
- ↑ D.W.Bennet, T.A.Siddiquee, D.T.Haworth, S.E.Kabir, F.K.Camellia, J.Chem.Cryst., 2004, 34, 353 DOI:10.1023/B:JOCC.0000028667.12964.28
- ↑ 4.0 4.1 D.J.Darensbourg, R.L. Klump, Inorg. Chem., 1978, 17, 2680 10.1021/ic50187a062
- ↑ 5.0 5.1 5.2 N.Takagi, S.Nagase, Organomet., 2001, 220, 5498 DOI:10.1021/om010669u
- ↑ M.Kira, T.Iwamoto, Adv. Organomet. Chem., 2006., 54, 73

