Rep:Mlsexperimentdc3415
Molecular simulations of simple liquids
Abstract
Molecular dynamics simulations were performed on boxes of simple cubic lattices using LAMMPS. The thermodynamic properties of the ensemble such as density and heat capacity, its structural behaviour and dynamics were investigated at different phases. The simulated densities were as expected whereas the heat capacities showed a large discrepancy. The radial distribution functions produced the expected trends for the 3 phases tested and so did the diffusion coefficients calculated from the MSD and VACF for the liquid and solid. The gas diffusion coefficient was under-predicted in both cases.
Introduction
Molecular Dynamics simulations are a powerful method of calculating time-dependent thermodynamic and structural properties of materials. Such simulations can often be used as an alternative to physical experiments that could often be expensive at high (or very low) temperatures and pressures[1]. While such calculations can be very demanding computationally, they allow for the visualisation of the physical behaviour of the system[1] through simulations of vibrational modes and atomic motion. These are often difficult to observe during an actual experiment. The thermodynamic properties of materials such as nanofluids[2], which can have a better thermal conductivity than regular fluids can be investigated using similar simulations since the random motion of such particles can be modelled. Ionic systems can also be modelled to determine the effects on their mobilities under specific conditions[3].
The system used here is a 3D box of simple cubic (sc) lattices to model a simple atomic liquid with Leonard-Jones interactions. 1000 atoms were generated and the properties of the system were calculated using LAMMPS. The Velocity-Verlet algorithm[4], an adaptation of the leapfrog algorithm, was used to integrate Newton's equations of motion[5] at specified initial conditions of atom position and velocity. These microstate properties can be calculated for collections of atoms forming an ensemble under defined thermodynamic conditions[5]. The calculated average properties are dependent both on the measurable property in question (eg. entropy) and also the probability density, which is dependent on the ensemble properties.
The equation of motion is time-reversible, therefore a negative timestep should reproduce the same trajectory moving backwards as a positive timestep moving forwards, and the equation of motion should conserve the total energy and linear momentum of the system. By extension, a simulation in the microcanonical ensemble (NVE) should conserve the total energy of the system throughout the simulation.
Aims and Objectives
By performing simulations of a box of sc lattices of atoms with Leonard-Jones interactions the properties of microstates can be translated into macrocanonical behaviour of materials. By varying several system properties such as temperature, density and physical state, the thermodynamic properties of a system under specified conditions can be modelled, predicted and explained. Dynamic simulations can be used as the basis not just for chemistry[3], but also mechanical engineering and materials science[2], where the interfacial behaviour of materials and their thermodynamic properties are of particular interest.
Methods
Optimal timestep determination
The optimal timestep was determined by performing simulations on a simple cubic lattice of dimensions 10X10X10 lattices. Total energy, pressure and temperature were the measurable thermodynamic properties tested at each timestep (Table 1).
| Timestep / (ps) |
|---|
| 0.001 |
| 0.0025 |
| 0.0075 |
| 0.01 |
| 0.015 |
NpT ensemble
Simulations were performed under specific conditions of temperature and pressure by defining variables for each condition. 10 different temperatures (Table 2) were tested, 5 just above the critical temperature and 5 much higher than the critical temperature at 2 specific pressures of 1.8 and 2.5. Averages of temperature, pressure and density were calculated with a timestep of 0.0025 ps for 100000 timesteps.
| Temperature / reduced units |
|---|
| 1.52 |
| 1.55 |
| 1.58 |
| 1.62 |
| 1.68 |
| 2.0 |
| 3.0 |
| 4.0 |
| 5.0 |
| 6.0 |
Heat Capacity determination at specific temperatures and pressures
The heat capacities of the system at specific values of temperature and density were simulated (Table 3):
| Temperature / reduced units |
|---|
| 2.0 |
| 2.2 |
| 2.4 |
| 2.6 |
| 2.8 |
The input file used is similar to that of the NpT ensemble, however the desired state was set to NVT and the code was altered to calculate the heat capacity in the output file. The input file for ρ* = 0.2 and T* = 2.2 is given below:
Calculation of the radial pair distribution function, g(r)
Systems in three different phases were simulated by adjusting the temperature and density of the system during the simulation (Table 4).
| Phase | Lattice type | Temperature / reduced units | Density / reduced units | Timestep / ps |
|---|---|---|---|---|
| solid | fcc | 1.8 | 1.2 | 0.002 |
| liquid | sc | 1.2 | 0.8 | 0.002 |
| vapour | sc | 1.3 | 0.05 | 0.002 |
g(r) calculations and ∫g(r) were then performed using VMD, distributed by the University of Illinois, with delta r set to 0.05Å, using PBC and both frame selections set to all.
Calculation of the diffusion coefficient (D), using Mean Square Displacement (MSD) and Velocity Autocorrelation Function (VACF)
The total MSD in each system phase was calculated by simulating the system with the same parameters as per "Calculation of the radial pair distribution function, g(r)" to simulate the 3 phases.
Results and Discussion
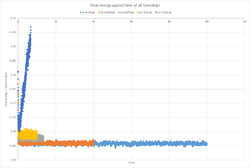
For the optimal timestep identification, the total energy of the system was plotted against time for all the timesteps (Figure 1). The optimal timestep is 0.0025 ps since it converges to the true total energy value. That is true for a timestep of 0.001 ps however smaller timesteps result in longer calculation times which can make demanding calculations very long and expensive and may not simulate the liquid for long enough time therefore 0.0025 ps is chosen instead. Timesteps of 0.0075 ps and 0.01 ps also converge in energy however the energy calculated is higher than that of smaller timesteps. These could give acceptable results at the cost of some inaccuracy in the calculated avergage thermodynamic properties. A timestep of 0.015 ps is not suitable since the total energy increases with time, hence the system energy is not conserved with time which violates the Newtonian Laws of motion.
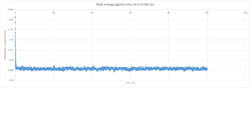
Plots of energy, temperature and pressure against time for a timestep of 0.001 ps (Figures 2-4) show a rapid equilibration of the systam parameters, typically after around 1 ps.
 |
 |
 |
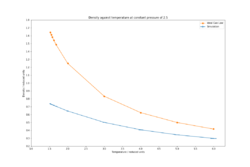
By simulating the system using an isobaric-isothermal ensemble (NpT), the effect of varying temperature at a set pressure (1.8 and 2.5 reduced units) was given as a function of density (Figures 5-6).
 |
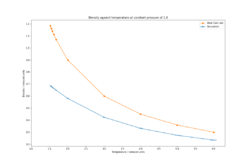 |
The density decreases exponentially with increasing temperature which is expected since as the temperature increases, the atoms will gain more vibrational energy and therefore the equilibrium bond distances will increase, resulting in larger lattice parameters, hence larger cell volume and lower density. Larger equilibrium distances at elevated temperatures help to maintain the total energy of the system to a minimum as high frequency vibrations can result in unfavourable electronic repulsions in Leonard-Jones systems. Such simulations be used to explain intrinsic properties of materials such as thermal expansion[6]. By comparison of the densities at the 2 pressures, the density is higher at a pressure of 2.5 rather than 1.8 since at higher applied pressures, any system will be compressed (albeit very minimally in the case of solids and liquids), increasing its density. The densities predicted by the ideal gas law are much higher than those of the simulations. The ideal gas law assumes no interactions between the atoms, therefore they can be brought close together without having to pay an energetic penalty as in the case of the Leonard-Jones system. The discrepancy between the predicted densities decreases with temperature since at higher temperatures, the system expands and the atomic interactions become weaker, hence the system begins to behave like an ideal gas.
By changing the system to a canonical ensemble, NVT, the heat capacity of the system was calculated at different temperatures (Figure 7):
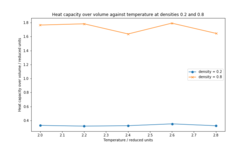
The heat capacity shows an unexpected variation at both densities rather than decreasing constantly as it would be predicted. Overall, the heat capacity decreases moving from T* of 2.0 to 2.8 but not constantly. Since heat capacity predicts the energy needed to change the temperature of a material by 1K, increasing temperature increases the density of states in a material, therefore higher energy states become populated and less energy is needed to raise the temperature of the material. The large difference in Cv/V between the two densities is unexpected since the difference between the two densities is relatively small. An error in the energy calculations could be the cause of the large discrepancy between the two.
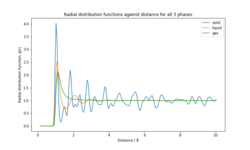
The RDFs of the three physical states (Figure 8) predict the atom density as a function of distance. All the systems have 0 density at distance less than 0.775 Å. The atom density increases rapidly, with a peak value at 1.025 Å for the solid (4.02), 1.075 Å for the liquid (1.96) and 1.125 Å for the gas (2.44). The difference in the peak atom densities reflects the difference in the system's structures. Solids are highly ordered, closely packed with atoms held at fixed positions. Therefore the atom density is much higher than the other systems and is reached at a shorter distance due to more atoms per unit volume. The liquid reaches peak atom density at shorter distance than the gas, since the atoms are mostly clustered together (higher atom density than gas). At long distances, the atom density tends to 1 for all 3 systems since the volume over which density is calculated increases dramatically. The atom density for the gas drops to 1 after a distance of 1.125 Å, which is evidence that the atoms in the system are spaced far apart and hence the system is highly compressible. For the solid, the drop in atom density is much slower and the atom density does not drop to 1 even after a distance of 10. The first 3 peaks for the solid correspond to the 3 nearest neighbour shells and each atom has a coordination number of 24, 6 and 12 respectively. Each peak corresponds to the preferred distance between atoms. The lattice parameter was calculated to be 1.45Å. (See supporting information).
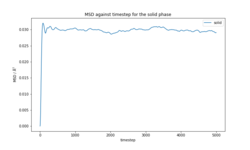
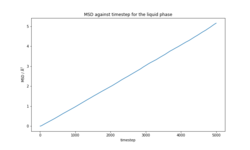
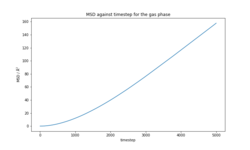
The total MSD for each phase (Figures 9-11) is in agreement with the physical structure of each phase. The solid has very small displacement over time whereas the liquid and gas phases, which have translational motion, have an MSD several orders of magnitude larger than the solid. The calculated diffusion coefficients for the simulations of 8000 atoms and 1 million atoms (Tables 5-6) are in close agreement in all three phases. (Plots of MSD for 1000000 atoms, VACF for both systems and detailed calculation of D provided in the section Supporting information).
 |
 |
 |
| D / 10-10 m2/s | ||||
|---|---|---|---|---|
| Solid | Liquid | Gas | ||
| Method | MSD | 5.85 | 8.53 | 33.2 |
| VACF | 13.6 | 8.63 | 356 | |
| D / 10-10 m2/s | ||||
|---|---|---|---|---|
| Solid | Liquid | Gas | ||
| Method | MSD | 4.15 | 8.53 | 306 |
| VACF | 10.5 | 8.99 | 327 | |
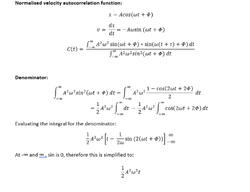
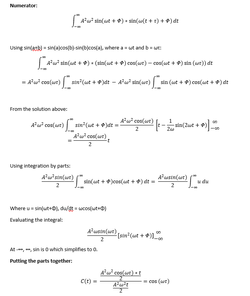
The derivation for the normalised VACF for the simple harmonic oscillator is shown below:
 |
 |
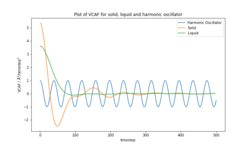
The VACF plot (Figure 12) for solid shows a large change in velocity , from positive to negative, that is typical of atomic vibrations in a solid, where the magnitude of the velocity changes depending on the direction of the oscillation. The liquid shows a smaller change in velocity before decaying to 0 due to one collision between atoms. The velocity of the liquid is much less correlated with time than that of the solid as translational motion causes a rapid decay in the velocity correlation. The velocity of the H.O. oscillates with a constant amplitude since the atoms are oscillating masses on a spring, hence their velocity remains correlated even after long time periods.
The estimated diffusion coefficients for the liquid are very similar for both methods. The values for the gas are within reasonable agreement with the exception of that calculated by the MSD at 8000 molecules which is 10 times less than the rest of the results. The results obtained for the solid are almost double when VACF was used instead of MSD however they are in the expected order of magnitude for a solid. VACF predicts a higher diffusion coefficient for the solid rather than the liquid which is unexpected since the atoms in a liquid will have translational motion and a lower atom density, therefore they will be able to self diffuse much more quickly than in a solid. This can be due to the fact that the estimated AUC for the liquid only included the first few points and then was assumed to be zero due to the small deviation from 0. The solid area was obtained for more points which increase the integral of the VACF and hence the diffusion coefficient. The main source of error on the calculation of the diffusion coefficient is the use of the trapezium rule to integrate the area under the VACF curve. The trapezium rule would underestimate the area under the solid and liquid plots but overestimate that of a gas.
Conclusion
Calculations of important thermodynamical properties such as density and heat capacity of a box of atoms of a Leonard-Jones liquid with a simple cubic lattice were performed using LAMMPS. The structural properties and diffusion coefficient of the solid, liquid and vapour phases were also modeled using similar molecular dynamics simulations[1]. The simulated density at different pressures appeared to decrease exponentially as temperature increased and was much lower than those predicted buy the ideal gas law due to the difference in the behaviour of the atoms in the two models. The heat capacity over volume at the two different densities tested showed an unexpected variation and an established trend was not obtained. The heat capacity appeared to decrease at higher T* this did not happen for all T*. The unexpected result was likely due to an error in the energy calculation. The RDFs produced for the 3 physical states were in agreement with the physical structure at each phase and the diffusion coefficients calculated using VACF and MSD data were in close agreement for the liquid and gas phases with the exception of the MSD calculation for the gas with a box of 8000 atoms. The calculated D for the solid was almost double for the VAFC compared to MSD and the difference was attributed to the error in the calculation of D using the trapezium rule to find the area under the VACF curve.
Such simulations can be easily extended to calculate any measurable system property for any system. Typically these can be applied to large, polyatomic systems such as proteins and macromolecules to explore the changes in protein structure due to temperature or solvent[7], and other dynamic processes such as folding. Overall, molecular dynamics prove to be a versatile technique allowing the accurate calculation of any parameter of a well-described system as shown by the results obtained and by the fact that it is widely used in literature in many scientific fields spanning from education[1] to improving the efficiency of materials[2].
Supporting information
File:Dc3415HO.xls File:Dc3415answerstotatsks.docx
References
- ↑ 1.0 1.1 1.2 1.3 O. F. Speer, B. C. Wengerter and R. S. Taylor, J. Chem. Educ., 2004, 81, 1330.
- ↑ 2.0 2.1 2.2 L. Li, Y. Zhang, H. Ma and M. Yang, J. Nanoparticle Res., 2010, 12, 811–821.
- ↑ 3.0 3.1 C. A. Angell, P. A. Cheeseman and S. Tamaddon, Science (80)., 1982, 218, 885–887.
- ↑ R. Mountain and N. Martys, Phys. Rev. E, 1999, 59, 3733–3736.
- ↑ 5.0 5.1 H. J. C. Berendsen, J. P. M. Postma, W. F. van Gunsteren, A. DiNola and J. R. Haak, J. Chem. Phys., 1984, 81, 3684–3690.
- ↑ M. Matsui, J. Chem. Phys., 1989, 91, 489.
- ↑ M. Karplus and J. A. McCammon, Nat. Struct. Biol., 2002, 9, 646–652.
