Rep:MgOvl915
Abstract
In this investigation the General Utility Lattice Program (GULP) was used to model the thermal expansion of an MgO crystal by simulating its vibrations at different temperatures. This task was approached in two different ways using methods based on the quasi harmonic approximation and molecular dynamics, respectively. The optimal k grid size for the simulations was found out to be 32x32x32 and temperature-dependent expressions for the thermal volumetric expansion coefficient αV(T) were obtained for both approaches from third order polynomial regressions over a temperature range from 300 K to 2000 K. Comparison of the computed thermal expansion coefficients with experimentally determined expansion coefficients shows that throughout this temperature range (300 K to 2000 K) the quasi-harmonic approximation approach performs poorly when it comes to estimate αV. Above 750 K the MDS method is even worse, meanwhile in a temperature range from 300 K to 750 K it models αV quite well, especially around 400 K where it deviates from the experimental value by 0.71 % only.
Introduction
The importance of knowing the thermal expansion coefficient of a material
Thermal expansion is the tendency of matter to change in shape, area and volume as a consequence of a change in temperature [1] and is directly related to the atomic spacing within the material. Thermal expansion is quantified by thermal expansion coefficients. The ability to estimate how a certain material will behave as temperature is altered is crucial for successful engineering of bridges, buildings and railways for instance and is also important to consider when constructing electronic devices where a mismatch of the thermal expansion coefficients of the different materials within the device can cause electronic malfunction. Hence, the ability to quantify thermal expansion is very important to guarantee the safety and reliability of constructions and devices humanity uses in everyday life. Failure to account for thermal expansion can have detrimental consequences.
There are various methods to determine thermal expansion coefficients experimentally, including X-ray diffraction and high-resolution microscopy,[2] meanwhile these sometimes expensive experiments can be circumvented by modeling the thermal expansion of a material with computer simulations.
In this investigation the thermal expansion coefficients of a MgO crystal are obtained by modeling its lattice vibrations at different temperatures using two different approaches, the quasi-harmonic approximation and the MDS method.
The partition function of a vibrating crystal
A partition function of a system (shown in eq. 1) is the sum of Boltzmann factors for every state of that system. They allow to generate a link between properties at the molecular level and properties at the macroscopic level. Hence, once the partition function of a system is known, numerous thermodynamic properties can be deduced from it.

Meanwhile, it is generally diffcult to obtain a partition function of a system as all its states are not always known. An exception are vibrating crystals and it is very desirable to obtain a partition function for crystal vibrations as it allows to compute numerous important properties of a crystal, such as its free energy or its thermal expansion coefficients at different temperatures for example, which will be shown in this investigation.[3]
Modeling crystal vibrations with the harmonic / quasi harmonic approximation and the Brillouin Zone

To get a better understanding of vibrations in crystals it is important to take a closer look at the model shown in figure 1 which represents a 1D crystal structure as a linear chain of atoms, connected by springs which represent the interatomic potential. At equilibrium the distance between the atoms is equal to the unit cell length 'a'. Meanwhile, during a vibration of the crystal the atoms will be displaced from their equilibrium position which will cause a rise in the potential energy of the crystal. The potential of the crystal in figure 1, as a function of the displacement of the atoms from the equilibrium position, can be approximated by a Taylor expansion as shown in equation 2: [4]

In equation 2, σ(a) is the interatomic interaction potential (which can be modeled as a Lennard Jones - or Buckingham potential for instance) evaluated at the equilibrium interatomic spacing 'a', N is the number of atoms in the chain and un-un+1 is the displacement from equilibrium of the nth atom. If we omit all terms beyond s=2 in this Taylor expansion, the potential of the crystal will be effectively a set of harmonic oscillators and this approximation is called the harmonic approximation. The harmonic approximation is mathematically very convenient as the harmonic equations of motions have exact solutions. The solutions of the harmonic equations of motion are sinusoidal waves. Thus the motion of the whole 1D model (fig.1) can be described by a set of travelling waves with wave vectors k and corresponding angular frequencies ωk. Using this result and introducing it into equation 3 along with the expression for the harmonic potential, while applying the Born-von Kármán periodic boundary condition, results in an expression for ωk as a function of k (equation 4). [4]


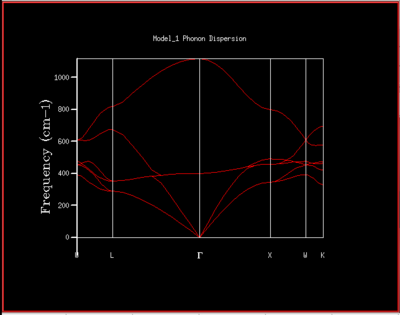
In equation 4, J is the harmonic force constant and m the mass of the atoms (i.e. the spheres) in figure 1. The graph of ωk against k is called a dispersion curve. If for a dispersion curve such as the one shown further below in figure 4a for example a sum over all vibrational bands and all possible k points is taken, then all vibrational levels of the crystal will have been taken into account so that a partition function can be expressed from which various thermodynamic properties of the crystal can be obtained such as the Helmholtz free energy for instance for which the expression (in the harmonic approximation) is shown in equation 5: [4]

In equation 5 the first term represents the internal energy contribution while the second and third terms stand for the zero-point energy of the vibrations and for their entropic contribution, respectively. J and k are indices for the vibrational bands and k points, respectively.
It should also be noted that the dispersion curve described by equation 4 is periodic with a repeat period of 2π/a. This means that all useful information is contained in waves with wavevectors in the range -π/a < k < π/a. This range can be interpreted as a unit cell length in reciprocal space (k - space) and is called the first Brillouin zone and -π/a and π/a are called the Brillouin zone boundaries (in 1D). A consequence of this periodicity is that vibrational bands are generally only represented for k values of the first Brillouin zone. Hence a unit cell length a* in reciprocal space can be expressed by equation 6: [4]

The concepts discussed so far can be extended to 3D and to unit cells containing more than one atom. In 3D, Brillouin zone boundaries remain defined as lying half-way between two reciprocal lattice points but now the boundaries are represented by planes rather than points and a Brillouin zone becomes the minimum volume enclosed by a set of such boundary planes that encloses a reciprocal lattice point. In 3D the Brillouin zone can thus be interpreted as a unit cell of reciprocal space and just as it was the case for 1D, the dispersion curves are generally only shown for k values (which in 3D are broken down into a kx-,ky-, and a kz component) within the first Brillouin zone. The letters on the horizontal axis in such dispersion curves (like in fig. 4a) are high symmetry points in three dimensional k-space such as Γ for example which generally represents the point (0,0,0) where kx,ky, and kz are equal to zero.
The harmonic approximation works well as long as the displacements from equilibrium (un) are small relative to 'a', which can be assumed to be the case at low temperatures. For small displacements from the equilibrium spacing between the atoms, the harmonic approximation will describe the interatomic potential reasonably well. Meanwhile, it should be noted that at higher temperatures the displacements from equilibrium will grow and more and more terms must be included in the Taylor expansion (equation 2) to obtain an accurate description of the interatomic potential which in reality is of course far from perfectly harmonic. It can thus be assumed that the harmonic approximation will fail at higher temperatures. One consequence of not taking into account anharmonic terms of the interatomic potential is that the harmonic approximation fails to predict thermal expansion (more on this later). Hence if thermal expansions are to be modeled the quasi-harmonic approximation is often used, which takes into account the increased equilibrium spacing between the atoms as temperature increases but apart from that treats the dynamics of the crystal within the harmonic approximation. In the quasi-harmonic approximation the equilibrium spacing between atoms at a given temperature T is determined by minimising the Helmholtz free energy (equation 5) of the crystal at that temperature.
The molecular dynamics simulation method
The molecular dynamics simulation (MDS) method is an alternative to the harmonic / quasi-harmonic approximation to model crystal vibrations. The essence of this method is to solve Newton's equations of motion for a set of atoms. The computer randomly attributes velocities to the atoms in the crystal until the total internal kinetic energy of the set of atoms corresponds to the temperature being investigated. It is assumed that the atoms interact via a model interatomic anharmonic potential such as the Lennard-Jones or the Buckingham potential for example. The equations of motions are solved numerically using small discrete time steps which allows to determine the position and the velocity of the atoms at a given time. This makes it possible to generate trajectories of each atom in time from which the computer determines time-averaged properties.
The molecular dynamics method allows to simulate crystal vibrations at high temperatures (unlike for the harmonic / quasi-harmonic approximation) and can even be used to model phase transitions as the anharmonicity of the interatomic potential is fully taken into account. [4] A drawback however is that the accuracy of the simulation is limited by the accuracy of this anharmonic potential. Furthermore, this method does not take into account the zero-point energy and can thus be expected to be inaccurate for simulations at low temperatures near 0 K. Also, the MDS method is computationally more expensive than the quasi-harmonic approximation. Finite-sized samples and non-infinitesimal time steps impose severe limitations on the accuracy of the simulations but they are a necessary compromise between accuracy and available computational resources. Another commonly adapted simplification to reduce computational resources not only in MD simulations is the rigid-ion model which neglects the polarizability of ions in a crystal and treats them as non-deformable charged spheres. [4]
The thermal expansion coefficient
The origin of thermal expansion of a solid material can be explained by considering a typical anharmonic interatomic potential (fig.2):

The temperature of a crystal is related to the kinetic energy of its atoms. Thus increasing the temperature is equivalent to an increase in internal energy. It can be seen from figure 2 that for a larger internal energy (assuming a realistic anharmonic interatomic potential) the amplitude of the vibration and the average interatomic distance increase which results in thermal expansion of the crystal. If the potential in figure 2 was a harmonic potential (which would be symmetric) the average interatomic distance would not change. Thus the harmonic approximation, as mentioned before, does not account for thermal expansion. Moreover, thermal expansion can also be explained from the viewpoint of free energy. It can be seen from figure 2 that a consequence of thermal expansion is a gradually decreasing energy difference between the allowed energy levels. For a harmonic potential these differences are all equal and don't change. It can thus be concluded that thermal expansion allows for more energy states to be accessible at a certain temperature which makes it entropically favourable. Hence, a material expands by increasing temperature because the energetic advantage of a small volume is overcome by the entropically favourable expanded volume. [4]
Thermal expansion can be quantified by thermal expansion coefficients. An expression for the volumetric thermal expansion coefficient of a material is given in equation 7:

It should be noted that the volume temperature-gradient (at constant pressure) of a material depends on the volume of the material and is hence an extensive property. The normalisation with the initial volume V makes of the expansion coefficient a volume-independent intensive property which is easier to tabulate. Meanwhile, it should be mentioned that thermal expansion coefficients are not temperature independent, as the volume of a material does not increase in a linear fashion as temperature is increased, and hence tabulated coefficients from the literature are always bound to a certain temperature. [5]
The unit cells of MgO
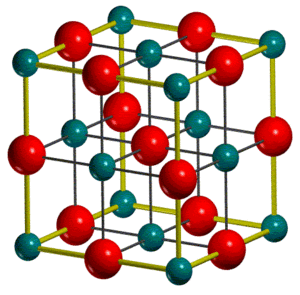
Two different unit cells are commonly defined for an MgO crystal, a conventional unit cell (fig.3a) which is cubic with a face-centred lattice and contains 4 MgO units, and a rombohedral primitive unit cell which contains 1 MgO unit (fig.3b):
 |
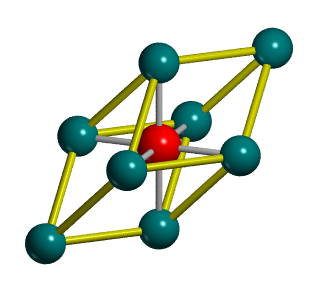 |
The conventional unit cell better reflects the symmetry of an MgO crystal and is thus more commonly used. Meanwhile software often outputs calculated properties such as lattice constants or untit cell volumes for the primitive unit cell. It should be thus noted that the density of MgO remains the same of course, completly independent of the unit cell used which is important for interconversions between different unit cells as the relation shown in equation 8 holds for any type of unit cell:

In equation 8, mi is the total mass contained in a certain unit cell and Vi is the volume of that unit cell.
Finally, it should be mentioned that for MD simulations supercells are used which contain many unit cells. This is necessary since, as mentioned before, the MDS method uses time-averaging to determine properties of the system such as the average interatomic distance for instance. Of course, the more atoms are studied, the more meaningful and accurate the averaging becomes which is why supercells, the larger the better, are used for these simulations.
Experimental
General
The computational modelling in this experiment was done using the General Utility Lattice Program (GULP) within in the DLVisualise graphical user interface. It was made sure that for all simulations 'ionic.lib' was selected and that the 'Include Shells' option was not selected on the 'GULP potential parameters' panel, where the latter ensures that a rigid-ion model is used. In these investigations the Buckingham potential was used to model the interatomic potential.
Computing the phonon dispersion curve of MgO
To obtain a phonon dispersion graph for MgO the phonons are calculated at 50 points along the W-L-G-W-X-K path in three dimensional k-space. This was done by loading a MgO unit cell in the DlViusalise interface. Subsequently, 'Phonon Dispersion' was selected under 'General Opts' on the 'execute GULP' panel and it was made sure that 'Npoints', which defines the number of k-points at which the phonons will be computed, was set to 50 and that 'Calculate Phonon Eigenvectors' was selected.
Computing the density of states with different grid sizes
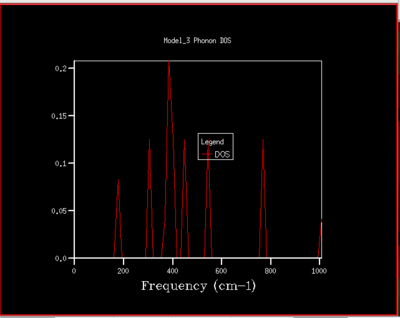
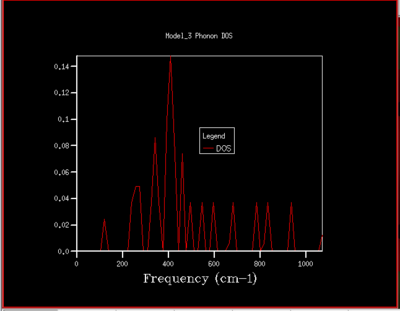
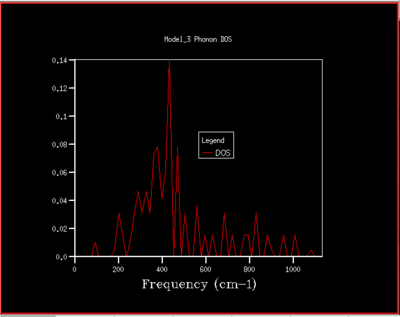
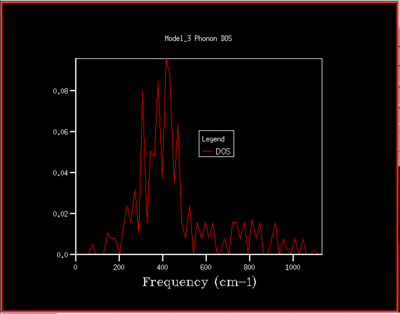
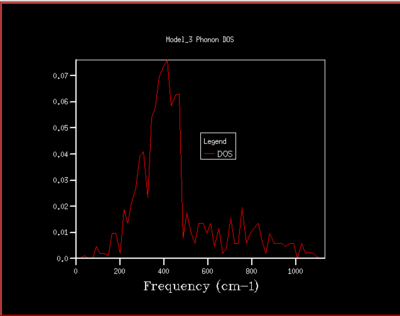
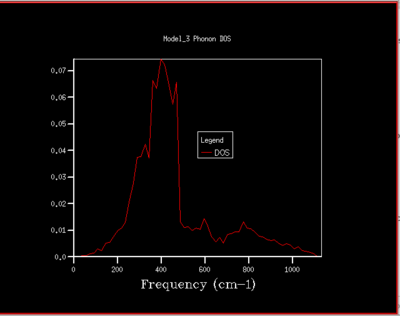
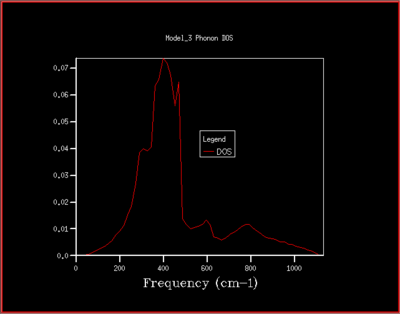
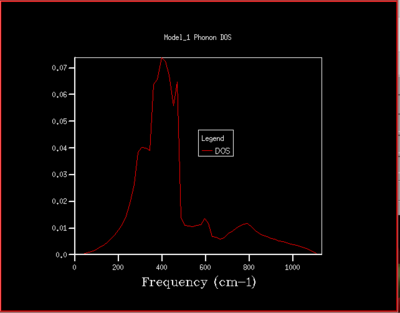
A DOS for different grid sizes was obtained by loading a MgO unit cell in the DLVisualise interface and selecting 'Phonon DOS' under 'General Opts' on the 'execute GULP' panel and by specifying the shrinking factors along the a,b and c directions (i.e. the grid size). A DOS was calculated for grid sizes of 1x1x1, 2x2x2, 3x3x3 ,4x4x4, 5x5x5, 8x8x8, 16x16x16, 32x32x32, and 64x64x64 (fig.5).
Calculating the free energy within the quasi-harmonic approximation at different temperatures
The free energy of MgO can be obtained from a simulation output log file which is generated during the DOS calculations. In this part of the experiment the free energy was calculated for the same grid sizes as as for the DOS in the previous section at a fixed temperature of 300 K. To do this the same procedure as for the DOS was followed but it was additionally made sure that the temperature was set to 300 K on the 'General Opts' panel (the pressure is set to 0 GPa by default and was not changed).
Moreover, the free energy of MgO was calculated at different temperatures with a grid size of 32x32x32. The temperature was increased in steps of 100 K, going from 0 K to 2900 K. The volumes of the primitive unit cell at different temperatures can be obtained from the same simulation output file as the free energies and was recorded for every temperature as it is needed for the calculation of thermal expansion coefficients (see Results and Discussion section).
Calculating the free energy of MgO with the MDS method at different temperatures
It was mentioned in the introduction that MD simulations on small samples such as a single MgO unit cell are meaningless which is why for these calculations a supercell of 32 MgO units was loaded into the the DLVisualise interface. Subsequently, 'Molecular Dynamics' was selected on the 'Execute GULP' panel. Under the 'MD Opts' on the 'execute GULP' panel the 'ensemble' was set to 'NPT'. This fixes the number of particles N, the pressure P and the temperature T of the system, the volume is allowed to vary of course. The 'time step' was set to 1 femtosecond, the 'equilibration steps' and 'production steps' were set to 500, respectively, and the 'sampling steps' and the 'trajectory write steps' were both set to 500 as well. This calculation was repeated at different temperatures increasing the temperature in steps of 100 K, going from 0 K to 3000 K. For each temperature the total energy and the volume of the MgO supercell were recorded, which were again obtained from the simulation output log file.
Results and Discussion
Dependence of the density of states on the k grid size
 |
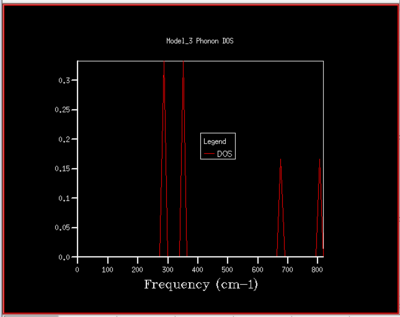 |
To understand how the dispersion curves of MgO and the density of states (DOS) graphs are correlated it is important to take a closer look at figure 4: In the dispersion graph (fig.4a) six modes of oscillation per k-point (so six branches) would be expected as the primitive unit cell of MgO contains two atoms. This is the case left of the point L in figure 4a, meanwhile not on the right of the L point as two of the branches "merge" which means that at these k-points, two modes have the same energy. Looking at the density of states graph with shrinking factor 1x1x1 (fig.4b), four peaks can be seen at 286, 351, 676 and 793 cm-1, respectively. The two lower-frequency ones have twice the intensity of the latter higher-frequency two. When a branch in the dispersion graph intersects with the sampled k-point, a peak can be observed in the DOS graph at the corresponding frequency. Thus to locate the one sampled k-point that is sampled with a 1x1x1 grid, a value of k needs to be found on the dispersion graph which is crossed by four branches at the frequencies observed in the DOS graph. These criteria are met by the k-point labelled L on the dispersion graph. The stronger intensity of the two lower-frequency peaks in the DOS graph can be explained by the double-degeneracy of the two lower-frequency branches mentioned before. The modes that go to zero at Γ are called acoustic modes, the modes that do not come down to zero at Γ are called optical modes. In figure 4a, 3 acoustic modes and 3 optical modes can be observed .
As the grid size is increased more k-points are sampled resulting in much more peaks over a wider frequency-range in the DOS graphs (fig.5). At a grid size of 16x16x16 already, there are so many peaks that they strongly overlap so that a single broad peak is obtained. A relatively smooth DOS curve is obtained at a grid size of 32x32x32 and it was found out that increasing the grid size beyond 32x32x32 does not result in significant changes in the DOS graphs. For instance the differences between the 32x32x32 and the 16x16x16 graph are much more pronounced than the differences between the 64x64x64 graph. Hence, from there on the 32x32x32 grid size was used for simulations, as it is only marginally less accurate but much less time-consuming than larger grid sizes.
It can also be seen that the dispersion graph is related to the density of states graph by the gradient of the branches. A steep gradient on a branch in the dispersion graph means a small DOS at the corresponding frequency, whereas a flat gradient on a branch results in a large DOS at the corresponding frequency. In figure 5i below the DOS for a 32x32x32 grid is shown rotated by 90° next to the dispersion of MgO so that this becomes easier to see.
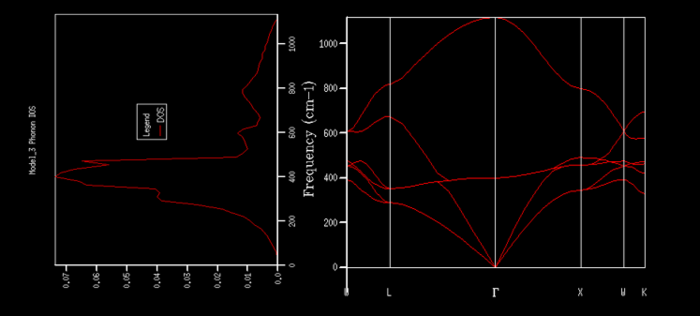
It can be seen from figure 5i that the density of states is very large around 400 cm-1 which makes sense as many branches go through this frequency including one branch with a very shallow gradient in the middle which remains around 400 cm-1 throughout the whole k-path. In contrast, the density of states is considerably lower at the extremes looking at 200 cm-1 and 1000 cm-1 for instance. Much less branches go through these frequencies and if they do then with a quite steep gradient.
Dependence of the free energy on the grid size

| Grid size | Free energy / ev | Differnece from converged
free energy / 105 eV |
|---|---|---|
| 1x1x1 | -40.930301 | 381.8 |
| 2x2x2 | -40.926609 | 12.6 |
| 3x3x3 | -40.926432 | 5.1 |
| 4x4x4 | -40.92645 | 3.3 |
| 5x5x5 | -40.926463 | 2.0 |
| 8x8x8 | -40.926478 | 0.5 |
| 16x16x16 | -40.926482 | 0.1 |
| 32x32x32 | -40.926483 | converged |
| 64x64x64 | -40.926483 | converged |
Equations for thermodynamic functions can be evaluated using a list of frequencies taken from the dispersion curves calculated over a fine grid of k-points within the first Brioullin zone. Since energies of vibrations depend on their frequency only, the density of states can be used for the evaluation of energies. [4] It follows that the more accurate the density of states used the more accurate will be the energy value obtained. This implies that a finer grid of-k-points sampled, will improve the accuracy of the free energy obtained. However, just as with the DOS functions in the previous section, there is a certain threshold-grid size beyond which the energy values obtained do not change significantly. In fact in figure 6 and table 1 it can be seen that the energy values obtained converge, which is unsurprisingly at the grid-sizes for which the DOS graphs in the previous section were found out to converge as well. It can be seen from table 1 that at a grid size of 8x8x8 calculations are accurate to 0.5 eV already, at 16x16x16 to 0.1 eV. For a grid size of 32x32x32 the same energy value is obtained as for the much more time consuming 64x64x64 calculation. This underpins again that calculations with grid-sizes above a certain threshold result in unnecessarily long computation time without providing significantly more accurate results.
Meanwhile, what that threshold grid size is depends on the system studied. From equation 6 it can be seen that the larger the unit cell length a, the shorter will be the unit cell length in reciprocal space a* which is directly related to the size of the Brillouin zone. It can be assumed that less k-points need to be sampled to "explore" a smaller Brillouin zone and that the aforementioned threshold grid size will hence be lower, the smaller the Brillouin zone. Conversely, the larger the Brioullin zone of a crystal system, the larger will be the threshold grid size.
A CaO crystal for example, which just as MgO has a face-centered cubic unit cell, can be expected to have a larger unit cell length than MgO since Ca has an additional electron shell and will hence have a larger ionic radius than magnesium. Consequently, CaO will have a smaller Brioullin zone than MgO and will thus have a smaller threshold grid size.
Similarly for Zeolites such as Faujasite for example. Zeolites are porous aluminosilicate minerals and have very large unit cells. Faujasite for example has a unit cell length of 24.6 Å.[6] For comparison the conventional MgO unit cell has a lattice constant of 4.2 Å.[6] Hence, by the same token as for CaO, Faujasite can be assumed to have a smaller threshold grid size than both MgO and CaO.
Lithium is a metal and the bonding in metals ( metallic bonding) is commonly described as cations being held together by a shared "sea" of electrons. Since metallic bonding is non-directional the cations in metals (which can be treated as hard spheres) adopt a close packed structure for which the unit cell parameter can be expected to be smaller than for a metal oxide such as MgO. Thus Lithium can be expected to have the largest Brioullin zone and hence the largest threshold grid size of all solids discussed up until now.
The Helmholtz free energy and thermal expansion within the quasi-harmonic approximation
 |
 |
The two graphs in figure 7 show how the Helmholtz free energy of the MgO crystal and the conventional lattice parameter vary as temperature is increased in the framework of the quasi-harmonic approximation. It can immediately be seen from figure 7a that the Helmholtz free energy of the MgO crystal decreases with increasing temperature. And from ~1000 K onwards it even follows a linear trend. Considering the most common expression for the Helmholtz free energy, A = U-TS, this suggests that at least from a 1000 K onwards the entropy S and the internal energy U are constant and therefore temperature independent. This is surprising as if for instance the third term in equation 5 is taken into focus, which should be equivalent to the "-TS" term, two T dependencies are found suggesting that S is temperature dependent. Furthermore, the internal energy, E0 in equation 5, even though it is temperature independent, can be expected to change for every temperature as within the quasi-harmonic approximation the equilibrium interatomic spacing is adjusted at every temperature. Hence the linear trend of the Helmholtz free energy could be explained by assuming that the temperature dependencies of U and S become negligible at high temperatures. Conversely, at temperatures below a 1000 K the dependencies of U and S can be assumed to have a more significant effect so that a linear relation between the Helmholtz free energy and temperature is not established.
The overall decreasing trend of the free energy as temperature is increased can be rationalised considering that the temperature T is always positive (as the Kelvin scale is used) and that S, the absolute entropy, is always positive as well. As mentioned, the internal energy is not found to vary strongly with temperature, especially not at temperatures above a 1000 K, and hence increasing T leads to a decrease in the Helmholtz free energy.
The conventional lattice parameter was obtained by taking the cube-root of four times the primitive unit cell volume (which was obtained from the output log file) using equation 8 and the fact that a conventional unit cell has the fourfold mass of a primitive one. As would be expected the conventional lattice parameter increases with increasing temperature as a consequence of thermal expansion. At low temperatures (0 K - 300 K) the lattice parameter is hardly changing at all which is not surprising if one looks at how the Helmholtz energies evolve at these temperatures, they are hardly changing. Since the lattice parameter is obtained from the unit cell volume which in turn is obtained from the minimum Helmholtz free energy at that temperature, the lattice parameter will of course hardly change if the Helmholtz free energy hardly changes. In the intermediate regime at temperatures from 500 K to 2200 K the lattice parameter follows a roughly linear trend. Meanwhile, above 2200 K the lattice parameter starts to increase more steeply with temperature.
Comparison of the thermal expansion modeled with the quasi-harmonic approximation and the MDS method

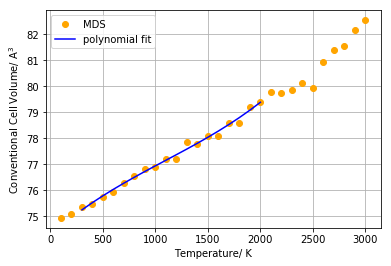
Figure 8 above shows how the conventional unit cell volume is predicted to evolve as temperature is increased and compares the predictions of the of the quasi-harmonic model and the MDS metod. As mentioned in the introduction the quasi-harmonic approximation, unlike the MDS method, takes into account the zero-point vibrational energy. Hence the MDS method tends to underestimate unit cell volumes at low temperatures. Indeed, it can be seen in figure 8 that at low temperatures (0 K - 400 K) the volumes predicted by the MDS method are lower than the ones predicted by the quasi-harmonic approximation. In the intermediate regime at temperatures between 500 K and 2000 K the two models appear to agree quite well while at 2000 K the two curves diverge from each other quite strongly. The unit cell volumes predicted by the quasi-harmonic approximation start to increase more steeply from 2000 K onwards than the MDS volumes. This divergence of the two models at high temperatures can again be explained by the fact that anharmonic terms of the interatomic potential become important at high temperatures; the MDS method accounts for these terms while the quasi-harmonic approximation doesn't which is why the two curves in figure 8 diverge at high temperatures.
The MDS method can in principle successfully model crystal vibrations at high temperatures and can even be used to model phase transitions in some cases. Meanwhile, from figure 8 it can be seen that the MDS method starts to break down around 1300 K already as the predicted volumes start to hover up and down. These unwanted fluctuations could be resolved by using a larger supercell or a smaller time step for the MD simulations for the following reason: Increasing the temperature results in more vigorous vibrations of the ions and hence there will be stronger fluctuations in the respective positions of the ions between each time step. The use of a larger supercell or of a smaller time step would thus improve the reliability of the time-averaged interatomic spacing determined by the software and prevent unwanted fluctuations of the predicted unit cell volumes as seen in figure 8.
As typically up to 10 steps along a given vibration is accepted to be sufficient using a time step of one femtosecond in combination with a supercell containing 32 MgO units seemed to be adequate to use in this investigation. Meanwhile, as the MDS method's results break down at a relatively low temperature, far away from the melting temperature of MgO (3125 K), it should be tried in future investigations to carry out these simulations with different settings. For instance, a similar procedure to the optimal grid size investigation for the quasi harmonic approximation could be carried out. The time step could be gradually shortened (while keeping the super cell size constant) until the total energy of the simulations start to converge. The same procedure could also be carried out by varying the super- cell size and keeping the time step constant. This would possibly allow to determine settings for which the MDS method does break down at higher temperatures than around 1300 K which would yield more consistent results in the temperature range studied in this investigation. Meanwhile, as often the case for computational simulations, a compromise must be kept in mind between accuracy and available computational resources.
Determining the thermal expansion coefficients from the modeled thermal volumetric expansions
As can be seen from equation 7 the volumetric thermal expansion coefficient is related to the gradient of a volume - temperature plot. Hence an expression for the expansion coefficients at different temperatures can be obtained by taking the first derivative of a polynomial regression of the data points in figure 8 (without forgetting to normalise this expression of course). A set of experimentally determined thermal volumetric expansion coefficients for an MgO crystal was found in the literature[7] for a temperature range between 300 K and 2000 K. Hence a polynomial regression was attempted over this temperature range for the quasi-harmonic and the MDS method data points, respectively. A linear regression would only be possible over short temperature ranges and result in a temperature independent expansion coefficient. Hence a polynomial regression was preferred as it could be carried out over the whole temperature range of interest (300 K - 2000 K) and because it would allow to see how the computed expansion coefficients evolve as temperature is altered since the first derivative of a non-linear polynomial is of course not a constant. Furthermore, the higher the order of the polynomial regression, the larger the coefficient of determination (the R2 value) which means that the regression better describes how the individual data points are interconnected. Polynomial regressions of third order were assumed to be sufficient as they resulted in R2 values over 99 % (see table 3) for both, the MDS and the quasi-harmonic set of data points. The polynomial regressions are shown in figure 9 and the corresponding R2 values in table 3:
 |
 |
| R2 | |
| Quasi-harmonic (fig. 9a) | 0.999982 |
| MDS (fig. 9b) | 0.991150 |
The first derivative of these third order polynomials (table 4 ) was determined and normalised by the volume predicted at 300 K for the MDS method and the quasi-harmonic approximation, respectively. This resulted in the two second order polynomials shown in table 4 which describe how the computed thermal volumetric expansion coefficients evolve as temperature is altered (in the temperature range from 300 K to 2000 K) according to the quasi harmonic approximation and the MDS method, respectively.
| Polynomial regressions | αV(T) | |
| Quasi-harmonic | 4.020 * 10-11 T3 + 3.638 * 10-7 T2 + 1.595* 10-3 T + 75.035 | 1.596 * 10-12 T2 + 9.630 * 10-9 T + 2.111*10-5 |
| MDS | 3.999 * 10-10 T3 - 1.306 * 10-6 T2 + 3.562 * 10-3 T + 74.282 | 1.592 * 10-11 T2 - 3.468 * 10-8 T + 4.728 * 10-5 |
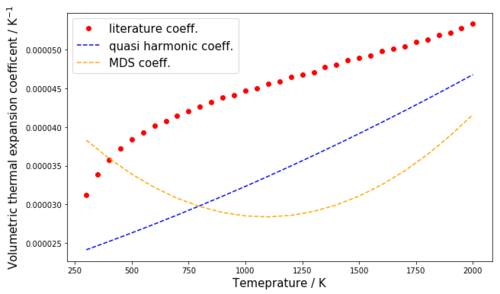
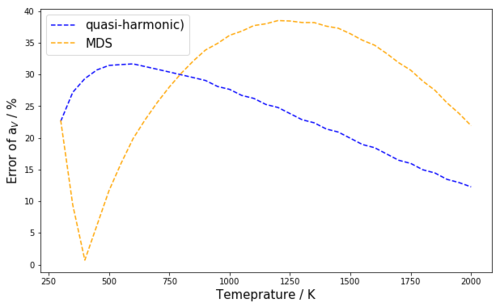
The expressions obtained in table 4 were then used to plot the determined values of αV(T) together with the experimental expansion coefficients from literature which can be seen in figure 10a. Figure 10b shows the error of the computed expansion coefficients (in %) from the experimental expansion coefficients in the temperature range 300 K - 2000 K for the quasi harmonic approximation and the MDS method, respectively.
| smallest error (temperature) | largest error (temperature) | |
| Quasi-harmonic | 12.27 % (2000 K) | 31.67 % (600 K) |
| MDS | 0.71 % (400 K) | 38.51 % (1200 K) |
Table 5: This table shows the smallest error and the largest error of the αV predictions of the quasi-harmonic model and MDS method at their respective temperatures
From figure 10a it can immediately be seen that the quasi-harmonic approximation underestimates the thermal expansion coefficient throughout the whole temperature range from 300 K to 2000 K. The MDS method is found to underestimate the expansion coefficients above 400 K (until 2000 K) and to overestimate them below 400 K. From figure 10b it can be seen that at 300 K the MDS and the quasi-harmonic expansion coefficients are equally far off the experimental values with an error of 22.5 %. In the temperature range from 300 K to 750 K the MDS method significantly better models the thermal expansion coefficient, at 400 K it even approaches the experimental value with an error of 0.71 %, only (see table 5, fig. 10b). In the temperature range from 750 K to 2000 K, the quasi-harmonic approach better models the thermal expansion coefficients than the MDS method. The closest the quasi harmonic approximation comes to the experimental values is at 2000 K but even then only with an error of 12.27 %. It can thus be concluded that in a temperature range from 300 K to 2000 K, the quasi-harmonic approximation poorly models the thermal expansion coefficients. Above 750 K the MDS method is even worse than the quasi-harmonic approximation, meanwhile in the temperature range form 300 K to 750 K, especially around 400 K the MDS method models αV quite well. It should be noted that, as mentioned before, the MDS method can be assumed to perform much better at high temperatures than it does in this investigation if a larger supercell was used (or a shorter time step). This should be a subject of further investigation.
Conclusion
In this investigation the lattice vibrations of an MgO crystal were modeled at different temperatures to predict the thermal expansion of the crystal with computer simulations using GULP. This task was approached in two different ways namely with the quasi-harmonic approximation and with the MDS method . It was furthermore found out that a k point grid size of 32x32x32 is a good compromise between accuracy and computation time to model the DOS of the MgO crystal from the crystal's dispersion. Increasing the grid size beyond 32x32x32 was shown not to result in significant changes in the appearance of the DOS and it was shown that the free energy values calculated at different grid sizes also unsurprisingly converge from a grid size of 32x32x32 onwards. Moreover, it was shown that the thermal expansion predicted by both models agrees well in a temperature range from 500 K to 2000 K but below and beyond that range the quasi-harmonic model predicts larger volumes than the MDS model. Temperature dependent expressions for the thermal volumetric expansion coefficients of MgO were determined from third-order polynomial regressions of the volume-temperature curves of both models in a temperature range from 300 K to 2000 K. By comparison with experimentally determined expansion coefficients from literature it was shown that throughout this temperature range the quasi-harmonic approximation performs poorly when it comes to estimate the thermal expansion coefficient. Above 750 K the MDS method is even worse, meanwhile between 300 K and 750 K the MDS method models αV quite well especially at 400 K where it approaches the experimental value with an error of 0.71 % only.
References
- ↑ P.Tipler, G.Mosca, Physics for Scientists and Engineers-Volume 1, Worth Publishers, New York, 2008
- ↑ J.D. James, J.A. Spittle, S.G.R Brown, Meas.Sci.Technol., 2001, 12, 1-15
- ↑ N. Harrison, Vibrations in crystals lecture notes
- ↑ 4.0 4.1 4.2 4.3 4.4 4.5 4.6 4.7 M. Dove, Introduction to Lattice Dynamics, Cambridge University Press, Cambridge, 1993
- ↑ P. Atkins, J. de Paula, Physical Chemistry, Oxford University Press, Oxford, 2014
- ↑ 6.0 6.1 G.Henderson, The Cambridge handbook of earth science data, Cambridge University Press, Cambridge, 19968
- ↑ O.L. Anderson, K. Zou, J. Phys. Chem. Ref. Data, 1990, 19(1), 69-81

