Rep:MgO sjh115
Abstract
The thermal properties of MgO were predicted using two different models; the quasi-harmonic approximation and molecular dynamics simulations. The two methods were compared with experimental results to test their suitability. The former model was found to work well at lower temperatures while the molecular dynamics simulations were found to work slightly better in the moderate temperature range. One parameter that was calculated was the coefficient of thermal expansion that was found to be 25.2 and 27.4 eV at 300 k respectively.
Introduction
The structure of MgO
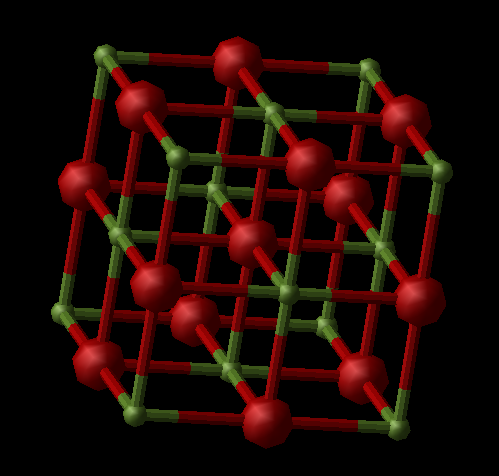
The crystal structure of MgO is a face-centered cubic (fcc). This structure has two different types of unit cell; a primitive and a face-centered, which is the conventional unit cell. A primitive unit cell has only one lattice point and a face centered unit cell has lattice points at the corners and on the faces, these are depicted below. As the primitive cell has 2 atoms and the conventional unit cell has 8 atoms, so to switch between the volumes of the two cells you can multiply the primitive volume by 4 to get the conventional cell volume. The primitive unit cell is the smallest repeat unit of the structure[1].
 |
 |
Thermal expansion
Thermal expansion is the tendency of matter to change shape or volume with temperature. Temperature is proportional to the kinetic energy of the particles in the system. As a material is heated the atoms in the material vibrate or move more, which tends to lead to a greater separation of the atoms, increasing volume. The amount by which volume increase is due to the expansion coefficient of a material. The formula for calculating the expansion coefficient is shown below in equation 1, this usually varies with temperature[2].
Equation 1
Where is initial volume, is volume and is temperature. Knowing about a materials thermal expansion is extremely important when building large structures when changes in temperature of the material is expected. An example of the chaos caused when neglecting this parameter is railway tracks. In the US the temperature changes can be quite large and this was not factored in when choosing the material for making railway tracks, this caused large amounts of derailing in the early years of railways.
We are using two different computational models to compute how the volumes of MgO change with temperature and ultimately to calculate the expansion coefficient of MgO.
The quasi-harmonic approximation
The quasi-harmonic approximation (QHA) came about by adjusting the harmonic approximation to take into consideration volume changes. The harmonic approximation is good for modelling systems at lower temperature. The model does not work so well at higher temperatures as the approximation says that the higher energy state, induced by higher temperatures, have the same equilibrium distance. This is obviously not the case and so adjustments need to be made to the model to describe volume-dependent thermal effects. However the model is still based on a parabolic potential with an equilibrium bond distance, it just increases with temperature. The harmonic expression for the free energy is retained and an explicit dependence of vibrational frequency on volume is introduced, as can be seen below in the equation.
The QHA predicts volume by minimising the free energy at that temperature.
The dispersion curve is calculated by plotting the angular frequency of the wave model of the vibration against the reciprocal lattice parameter . We obtain the angular frequency by first defining a wavevector k, as shown below, as we can model the vibrations as a plane wave.
Equation 3
Where is the wavelength of the vibration and is set by the defined set of periodic vibrating units. We can use this wavevector and Hook's law to predict the vibrational frequency of the vibration, using the equation below.
Equation 4
Where is the force constant and is the reduced mass.
We then obtain the reciprocal lattice parameter by using the equaion below, where alpha is the lattice parameter in real space.
Equation 5
Molecular dynamics
Molecular dynamics simulation works by predicting the positions of the atoms in the cell by solving Newton's second law of motion with regards to their initial position. Then it adjusts the position of the atoms by the acceleration worked out by solving the law of motion. Then the algorithm outputs physical quantities of interest using the preset boundary conditions; outputting cell volume in this case. Then it is iterated over time and as many steps as originally specified. The cell in the simulation needs to quite large as there needs to be enough atoms to give a good picture of the different trajectories that occur in an infinite lattice. This model takes into consideration the anharmonic effect, unlike the QHA model[3].
Experimental
Linux is used as the operating system used for these numerical calculations. The GUI (graphical user interface) that was used was DLVisualize. For running the simulations, the GULP (General Utility Lattice Program) for the molecular modelling was used. For all simulations performed, the ionic.lib potential was used in the GULP Potential Parameters panel and the Include Shells option was not selected.
Computing phonon modes
The phonon dispersion curve calculation was performed as follows; The MgO structure was loaded and the Execute GULP panel was brought up. Phonon Dispersion was selected in the general Opt section. Npoints was set to 50 and Calculate Phonon Eigenvectors was selected then the calculation was run. The dispersion curves were then plotted and analysed.
The phonon density of states (DOS) were calculated as followed; The Phonon DOS option was selected in the Execute GULP panel. The shrinking factor along the A, B and C directions were then selected abiding by the rule that A=B=C. The shrinking factor started as 1 and went up to 10 in increments of 1, then larger increments were used up to 48. The phonon DOS was then represented graphically, aiding with finding the relationship of DOS to grid size.
Calculating the free energy of MgO
A suitable k-space grid for the quasi-harmonic approximation was found by finding a convergent value for the free energy with the respect to grid size. This was done by selecting the Phonon DOS option in the Execute GULP panel, setting the temperature to 300 K. Then varying the grid size and recording the free energy until the value converges. Taking note of the grid sizes where the free energy was accurate to 1 meV, 0.5 meV and 0.1 meV per cell.
Thermal expansion of MgO
The structure of MgO was optimised with respect to the free energy at a number of temperatures, using the quasi-harmonic approximation. Optimisation was selected on the Executive GULP panel, then the Optimise Gibbs free energy was selected in the Optimisation opt section and Photon DOS was selected in the General opt, with the suitable grid size from the previous investigation. This calculation was varied at temperatures of 0 K to 2900 K in increments of 100 K to examine the free energy and lattice parameters of MgO with temperature.
Molecular dynamics
This alternative model was also used to examine the the change in conventional cell volume of MgO with temperature and compared to the results that were found in by the QHA model. The MgO_32.str structure was loaded. Molecular Dynamics was selected on the executive GULP panel, the MD opts panel was then opened and edited. Ensemble was set to NPT, Time Step = 1.0 femtoseconds, Equilibration steps to 500, Production Steps = 500, and both Sampling steps and Trajectory write steps to 5. The temperature was varied from 100 K to 3600 K in 100 K increments. The average value of the cell volume on the last step was taken at each temperature for comparison.
Results and Discussion
Lattice vibrations - phonon dispersion and density of states
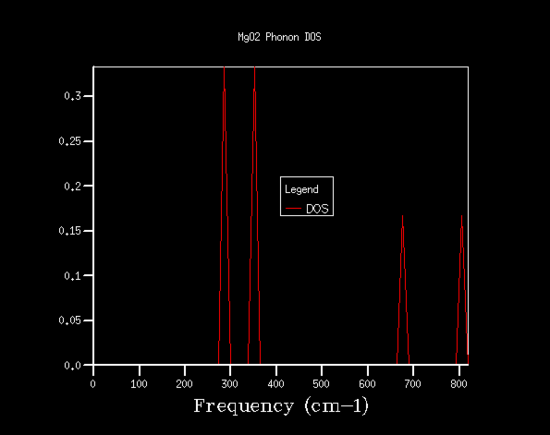
The phonon modes of MgO were calculated and displayed as dispersion curves and density of states. In the figures 1 and 2 below are the phonon dispersion curve and the density of states (DOS) plot for a grid size of 1x1x1. The DOS plot was computed for a particular k-value. That k-value is L. This can be seen by examining the two plats; on the DOS plot there are four peaks and on the dispersion curve there are four frequencies on the k-value L. Also the frequencies around 300 cm-1 are doubly degenerate, which would correspond to two peaks that are twice as large as the other two peaks at higher frequencies, which is what is observed. The density of states is a useful plot which summarises the dispersion curves by average over all the k-points. As it shows the number of vibrational modes at each frequency in a clear fashion. The dispersion curve shows one useful property that the DOS plot in unable to show, whether the band gap is direct or indirect. This is a useful property to know if you are choosing a semiconductor for optoelectronics, as you would need a material with a direct band gap, which would provide an efficient electron promotion and relaxation process to give a brighter colour.
 |
 |
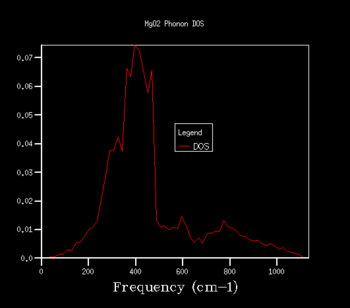
By increasing the shrinking factor you can increase the grid size. This results in more branches, increases the number of k-points used resulting in more phonons being displayed on the DOS plot. This leads to the DOS plot having a continuous curve of vibrational modes over many frequencies as opposed to having certain phonons at discrete frequencies. In order to see the minimum grid size required to give a reasonable approximation for the density of states a variety of grid sizes were tried, as shown below in figures 3, 4 and 5. 32x32x32 seems to look extremely similar to 48x48x48 with vary minor changes, with greater changes between 16x16x16 and 32x32x32. This leads me to believe that the grid size of 32x32x32 is a good compromise between accuracy and calculation time for computing the DOS plots.
 |
 |
 |
Free energy and its relationship with grid size
The Helmholtz free energy was then computed with varying grid size and the corresponding chart and and graph are shown below. The graph shows how quickly the free energy converges with grid size, ie when the difference is 0 on the graph. The free energy becomes accurate to 1 mV for the grid size of 2x2x2. The larger the grid size, the more k-values are considered, the more phonons will be taken into account so the more accurate the free energy becomes. The grid size 2x2x2 is also accurate to 0.5 mV and 3x3x3 is accurate to 0.1 mV. The converged free energy was found to be -40.926483 eV. A higher grid size than 24x24x24 will not increase accuracy but will increase run time. The free energy converged at the grid size 24x24x24, which was a smaller size than for DOS plots. Showing that there is no need to use 32x32x32 for these calculations as it results in a much longer running time with little increase in efficiency. 16x16x16 gives a good compromise between running time and accuracy as it was only 0.000001 eV away from the converged free energy and the calculation run times are fast.

| Grid Size | Free energy (eV) | Difference from converged value |
| 1x1x1 | -40.930301 | 0.003818 |
| 2x2x2 | -40.926609 | 0.000126 |
| 3x3x3 | -40.926432 | -5.1E-05 |
| 4x4x4 | -40.92645 | -3.3E-05 |
| 5x5x5 | -40.926463 | -2E-05 |
| 10x10x10 | -40.92648 | -3E-06 |
| 16x16x16 | -40.926482 | -1E-06 |
| 24x24x24 | -40.926483 | Converged |
| 32x32x32 | -40.926483 | Converged |
Whether the optimum grid size for MgO would translate to other materials depends on the lattice parameters. For a similar oxdie, eg CaO, where the lattice parameter would be only marginally larger, they can be treated as for all intents and purposes equal. Due to the similarities in structure you could use the same grid size in this case. However, when the lattice parameter is much larger, for example in zeolites such as faujasites, the lattice parameter in reciprocal space would be much smaller, as you can see from the relationship in equation 5. This means that you need less k-values to give an accurate representation of its vibrational structure in calculations so you can have a smaller grid size. This is different for metals, such as lithium, as they have a much smaller lattice parameter because the unit cell is made up of just one atom, so you would need more k-values to give an accurate representation of the vibrational structure, so you would have to use a larger grid size.
Comparison of models for the calculation of thermal properties of MgO
Cell volume verses temperature

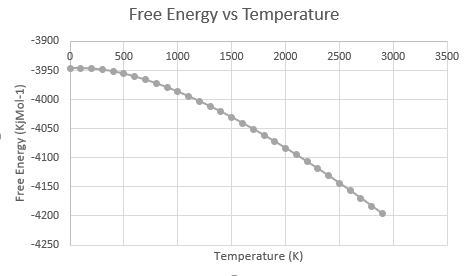
The quasi-harmonic approximation (QHA) was used to compute the Helmholtz free energy for MgO of a grid size 16x16x16. The energy was found at temperatures from 0 to 2900 K in 100 K steps. The Helmholtz free energy was found to decrease with increasing temperature. This decrease starts off curved but becomes linear as the temperature rises. The linear portion can be simply explained using thermodynamics; the equation for the Helmholtz free energy is as follows[4]:
Equation 6
As the temperature increases the entropic component starts to dominate, leading to a linear decrease in the free energy. The curved part at lower temperatures can be explained as both the enthalpic and the entropic are of the same magnitude so that increases in temperature do not have as large an effect initially, leading to a shallow gradient at the beginning. This assumes that the values of the entropy and the enthalpy do not change massively with temperature.

Comparing the cell volume vs temperature for the different models between the temperatures of 0 k to 3600k. The graph shows that the QHA calculations give you a plot that is curved plot as temperature increases, whereas the molecular dynamics calculations give a roughly linear plot. The reasoning for this is due to the different models using different methods to calculate the volume. The QHA uses the Helmholtz free energy equation (equation 2) to minimise the free energy; the second term in this equation is related to the zero point energy, at lower temperatures this term dominates, resulting in the curve being less steep at the lower temperatures as changes in temperature are less significant. At higher temperatures the curve gets steeper, this is because the model is based upon a parabolic potenital that is not anharmonic, so the bonds do not break, they just get longer. This restriction of volume due to bonds being in place limits the volume of the lattice, meaning the volume wont be as large as when the bonds break and the material begins to flow. This is also the reason why the QHA calculation only goes up to 2900 K as the program stops calculations when the bond length exceeds 3 Angstroms. The molecular dynamics does not have this restriction. However, at high temperature the MD model give an erratic estimation of the volume, as at some points the volume actually goes down with temperature, which is not logical. The reasoning for this could be that the velocities are so large, that the parameters set for the model may be inhibiting the estimation of volume at higher temperatures. For instance the time step set might not be long enough to observe the true behavior of the atoms or the size of the cell might not be large enough to encapsulate the behavior of the material at higher temperatures. These observations suggest that both of these models are not ideal for predicting cell volume at large temperatures. Molecular dynamics however seems to have the potenital to give better predictions if the parameters are adjusted.
The lattice parameter has the same trends as the volume with temperature as the lattice parameter is just the cube root of the volume.
Thermal expansion coefficients
The values for the expansion coefficients were worked out by applying a polynomial fit to the cell volume vs temperature curve for each method to obtain an equation of the curve(as seen below), differentiating that equation, imputing the temperature and dividing by the initial volume of the cell.
Equation 7 QHA polyfit equation
Equation 8 MD polyfit equation
| Temperature (K) | QHA expansion coefficient | MD expansion coefficient | Literature expansion coefficient |
| 100 | 25.9 | 26.95 | 21 |
| 300 | 25.2 | 27.4 | 31.2 |
[5]
The table above shows the thermal expansion coefficients of both models and the literature at a low (100 K) and a moderate temperature (300 K). As you can see the value of the expansion coefficient for the QHA is closer to the experimental value than the molecular dynamics value, suggesting that at low temperatures that the QHA model works better. This can be explained using the same justification as writing in the volume vs temperature section; the zero-point energy term. At low temperatures this zero-point energy is important in the QHA model but is not present in the MD model which leads to the inaccuracy that is observed.
At the moderate temperature of 300 K both models predict values of reasonable accuracy but the molecular dynamics model produces a value that is closer to the experimental value than the QHA result. As this section is within the linear section of both plots, both the models are going to give good estimations.
There was no value found at higher temperatures for the expansion coefficient, so the comparison with experiential values is not possible. However we can speculate the suitability of the models for this temperature range by looking at the what happens to the value of the cell volume at higher temperatures for the two models and looking at the restrictions of the models approximations. The QHA is still ultimately a model based on a parabolic potential, meaning that at high temperature the bonds are still existing, they are just have a longer equilibrium distance. This means that as the temperature approaches the melting point of MgO the material still maintains a lattice structure, which is not a very accurate representation of the material at that temperature as bonds begin to break. The MD model does taken into consideration this anharmonic effect, ie allowing the breaking of bonds as the velocities of the atoms increase to cause this to happen. Although there are problems with the current calculations that means the results are quite erratic, with adjustments of the parameters the MD calculations this model could give a more realistic picture of the material at temperatures near the melting point.
Conclusion
The experiment was successful as computer simulations were used to predict the properties of MgO. The quasi-harmonic approximation was used to produce a phonon dispersion curve and density of states plot. Where the later was optimised to have the minimum grid size to give a good approximation, which was found to be a grid size of 32x32x32. The Helmholtz free energy was then calculated under the same model and and optimum grid size was found that was a compromise between calculation time and accuracy, this was found to be 16x16x16.
The thermal expansion properties were then probed using two methods; the quasi-harmonic approximation and molecular dynamic simulation. The methods seemed to predict slightly different results for the cell volume and expansion coefficients in most cases. At lower temperatures the QHA produced the results that were closer to experimental value due to this zero-point energy consideration that was not in the MD simulation. At moderate temperatures both methods produced good results as the coefficients at these temperatures were calculated from the linear portions of plots, which where similar in both cases. The MD simulations produced values that were slightly closer. At higher temperatures the both models seemed to produce inadequate results; for QHA this was due to the lattice structure having to be maintained and for MD the preset parameters may have restricted its effectiveness.
Overall, the two methods are useful ways of simulating the thermal properties of materials. An extension to this could be adjusting the parameters of MD simulation as stated above to see how this affects results or using a chaning the maximum length of the bond for the QHA to potentially 5 Angstroms.
References
(1) Smart, L.; Moore, E. Solid State Chemistry: An Introduction, 2nd ed.; Stanley Thornes Ltd, 1995.
(2) Hugh, Y.; Freeman, R. University Physics, 11th ed.; 2011.
(3) D C, R. The Art of Molecular Dynamics simulations, 2nd ed.; 2004.
(4) Atkins, P. W.; DePaula, J. Physcial Chemsitry; OUP Oxford, 2014; Vol. 10th.
(5) Orson, A.; Keshan, Z. J. Phys. Chem. A 1990, 19.
