Rep:MgO egn14
Introduction

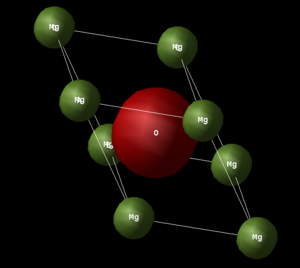
The aim of this computational experiment is to simulate the thermal expansion of a magnesium oxide (MgO) crystal lattice using different models, and in the process calculate the coefficient for thermal expansion.
The system under investigation is MgO in the solid state. In this state, MgO has a crystalline structure where there is long-range order. This means that if the relative positions of an atom and its neighbours are known at a particular point, it is then possible to pin-point the positions of these atoms throughout the crystal by virtue of the periodic structure. Hence, solid MgO can be represented by a unit cell - a basic building block that is repeated periodically to generate the entire crystal lattice. The conventional unit cell of MgO is the 'NaCl unit cell' (Image 1.) which can be viewed as a simple face-centred cubic (FCC) cell where the Mg atoms occupy the octahedral holes of the oxygen's sub-lattice and the oxygen atoms occupy the octahedral holes of the magnesium sub-lattice. Another way of viewing this unit cell is as two interpenetrating FCC cells of Mg and O displaced from each by half of the body-diagonal. A less common representation of the MgO lattice is by using its rhombohedron primitive cell (Image 2.). In either case, the crystal lattice is held together by strong ionic interactions between the oppositely charged Mg2+ and O2- ions.
The periodicity of the MgO crystal lattice means that it can be represented by a translational vector in real space. Similarly, a fourier transformation would allow a description of the MgO lattice in reciprocal space where various physical properties can be described by the wave vectors or k-values. The propagation of vibrations within the crystal can be visualised by monitoring the variation in phonon frequencies at different k-points. A phonon dispersion as a function of k-values can then be generated that describes the vibrational states within the crystal. The phonon dispersion relation for a 1D chain of atoms which relates the vibrational frequency to the k-values is shown in equation 1. where ωk represents the frequency of vibration and M is the mass of atoms.
-- Equation 1.
The thermal expansion of MgO will be monitored by two different computational methods. The first of which is the quasi-harmonic model which models the crystal vibrations as a harmonic oscillator. The Helmholtz Free Energy (A) in this model is given by Equation 2.
-- Equation 2.
E0: Internal energy of the lattice
j: Phonon bands
k: k-point in reciprocal space
ℏ: Reduced Planck's constant
ω: Angular frequency (rad/s)
kB: Boltzmann constant
T: Temperature in K
The second term in equation 2 represents the zero point energy and the third term gives the vibrational entropy.
During thermal expansion, the Helmholtz free energy is minimised at each temperature which leads to a shift in the parabolic potential. This means that the equilibrium bond length is shifted at each temperature giving rise to thermal expansion of the crystal lattice. A repulsive term is also included in this model.
The second method is molecular dynamics which relies on classical mechanics. In this model, the motions of individual atoms are unrestricted and obey Newton's second law. Initial velocities dependent on temperature are assigned to each atom within the crystal while the initial configuration of atoms follows that of the ideal MgO lattice. The atomic velocities and configurations are then updated at regular time intervals or steps and the lattice parameters and cell volume recorded. A sufficiently large time step is used to minimise the effect of fluctuations so that a reliable average value for physical properties such as temperature and energy is obtained.
The coefficient of thermal expansion is defined by Equation 3, where V0 represents the initial lattice volume.
-- Equation 3.
Results and Discussion
Quasi-Harmonic Approximation
Lattice Vibrations - Phonon Computation
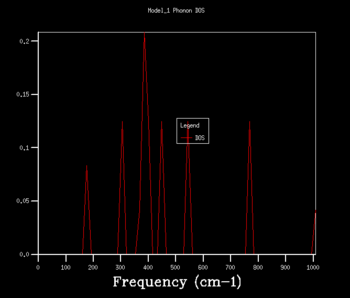
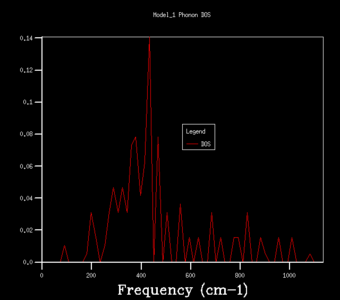
An appropriate grid size of the MgO crystal had to be determined prior to performing computations in the quasi-harmonic approximation. The grid size is represented by shrinking factors along each direction of the crystal. This was done by examining phonon Density of States (DOS) graphs as a function of shrinking factor. The number of k-points included in the DOS computation varies as a function of shrinking factor.
For the shrinking factor of 1, i.e a lattice of grid size 1x1x1, one k-point which was 0.5 multiplied by the lattice vector in each direction of the crystal was included. This k-point (0.5, 0.5, 0.5) corresponds to the symmetry point L.
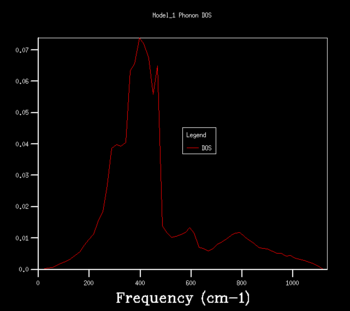
The density of states graphs were plotted for the shrinking factors 1, 2, 3, 4, 8, 16, 32 and 64. It was observed that larger shrinking factors gave smoother DOS curves of higher resolution. This is due to the fact that a larger shrinking factor corresponds to a smaller Brillouin zone. This means that a greater number of k-points is used in the computations and more phonon frequencies are included.
To determine an appropriate grid size for a reasonable DOS approximation, a sufficiently well-resolved DOS curve had to be observed. From observing the DOS curves in table 1, a shrinking factor of 16 was determined to be the minimum grid size which produced a reasonable DOS curve. The 16x16x16 DOS curve was determined to be reasonable by comparing its appearance to those of smaller and larger shrinking factors. There was a significant change in the DOS curve appearance going from the 8x8x8 grid to the 16x16x16 grid but only a minor improvement in resolution going to the larger grid sizes of 32x32x32 and 64x64x64. Therefore, if computational power or time was extremely limited, performing computations using a shrinking factor of 16 would suffice.
However, the optimal grid size for the proceeding computations in the quasi-harmonic model was determined to be that with a shrinking factor of 32. This is because the shrinking factor of 32 gave a more detailed DOS curve than the shrinking factor of 16, and both calculations took roughly the same amount of time to complete. A shrinking factor of 64 was not chosen because the minor improvement in resolution in the DOS curve was greatly offset by the significantly longer computational time and was determined to be inordinately computationally costly.
| Shrinking
factor |
1 | 2 | 3 | 4 |
|---|---|---|---|---|
| DOS Curve | 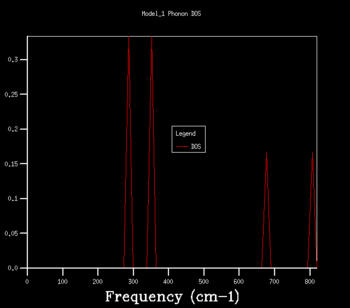
|
|

|
|
| Shrinking
Factor |
8 | 16 | 32 | 64 |
| DOS Curve | 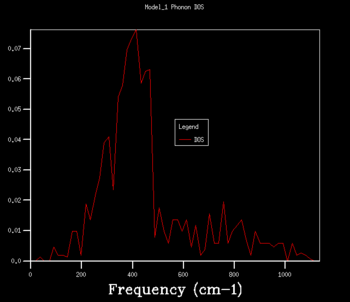
|

|
|

|
| Table 1. Phonon DOS Curves at different shrinking factors. | ||||
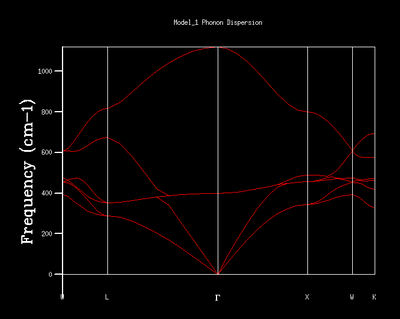
The dispersion curve is an alternative representation of the lattice vibrational states and their energies. The variation of the energies of vibrations with respect to different k-points is illustrated in a dispersion curve. Symmetry points are k-points of extra importance and are highlighted in the dispersion curve. Information such as the energies and number of vibrational states at different k-points within the crystal can be extracted from the dispersion curve. This is in contrast to the DOS curves which show the proportion of vibrational states at a given energy interval based on the number of k-points provided which is governed by the grid size.
Based on the optimal grid size with shrinking factor of 32 for the MgO lattice, several assumptions on the optimal grid sizes for other species can be made by considering their lattice sizes relative to that of MgO. Namely, lattices with similar lattice parameter (a) and inverse lattice parameter (b) magnitudes would be expected to share a common optimal grid size with the MgO lattice. The lattice parameter (a) of MgO is 4.2 Å[1]. Firstly, for a similar oxide such as CaO (a = 4.7 - 4.8 Å[2] with a primitive cell of similar dimensions to MgO, the inverse lattice parameter would be similar, hence the Brillouin zone would be similar in size, which means that the same number of k-points would be needed to generate a DOS curve of sufficient resolution. This means that the same shrinking factor of 32 would be adequate for CaO. Zeolites generally have larger structures with larger primitive cells. For instance, Faujasite has a lattice parameter around 24.6Å[3] which is significantly larger than MgO. This means that the cells in reciprocal space of Zeolites are significantly smaller than MgO. Hence, a smaller shrinking factor than 32 which corresponds to fewer sampled k-points would likely be adequate for a well-resolved DOS curve. A smaller number of k-points from a smaller shrinking factor than 32 would also suffice for a regular metal lattice like Li. This is due to the higher DOS or narrower band widths characteristic of regular metal lattices. This narrower band width can be attributed to the cushioning of the repelling positive cations undergoing vibrational motion by the sea of electrons surrounding the cations. As a consequence, there is minimal fluctuation in the vibrational energy levels.
Computing the Helmholtz Free Energy
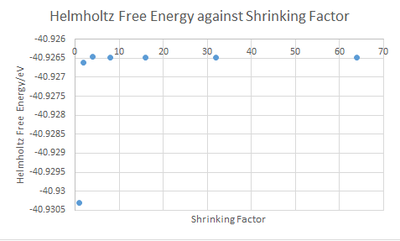
To further justify the choice of grid size with shrinking factor 32, calculations of the Helmholtz free energies as a function of grid size was performed. As the grid sizes increased, the Helmholtz free energy converged to a greater extent towards the value of the infinite grid. This is evident in the decreasing degree of fluctuation with grid size. i.e a smaller change in Helmholtz free energy values was observed for the larger grid sizes. There was no change in Helmholtz free energy value going from shrinking factor 32 to 64, which indicates complete convergence. A shrinking factor of 2 results in a free energy value accurate to 1 meV and 0.5 meV, and a shrinking factor of 4 gives a free energy value accurate to 0.1 meV.
| Shrinking Factor | Helmholtz Free Energy (eV) | Change in Energy | ||
|---|---|---|---|---|
| 1 | -40.9303 | |||
| 2 | -40.9266 | 3.69x10⁻³ | ||
| 4 | -40.9264 | 1.59x10⁻⁴ | ||
| 8 | -40.9264 | 2.80x10⁻⁵ | ||
| 16 | -40.9264 | 4.00x10⁻⁶ | ||
| 32 | -40.9264 | 1.00x10⁻⁶ | ||
| 64 | -40.9264 | 0 | ||
| Table 2. Convergence of Helmholtz Free Energy Values with increasing grid sizes. | ||||
Thermal Expansion of MgO

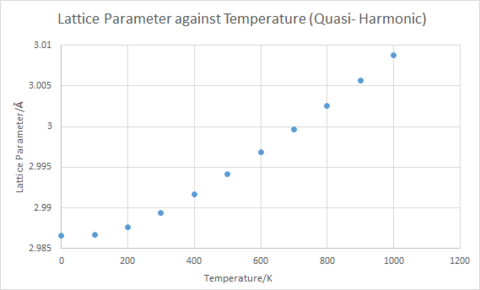
From Plot 3 and Plot 4, it can be seen that there is an increase in lattice parameter and hence increase in cell volume with increasing temperature. i.e Thermal expansion of the MgO lattice occurs. It follows from this that the Helmholtz free energy becomes more negative with increasing temperature as can be seen in Plot 2. This is due to the positive change in entropy (deltaS) associated with thermal expansion as the system becomes less configurationally constrained and hence more disordered. The -TdeltaS contribution to the Helmholtz free energy is thus negative and becomes progressively more negative with increasing temperature.
Using V0 = 18.8364 Å and the gradient from the plot of cell volume against temperature at constant pressure (Plot 4.), the coefficient of thermal expansion αV was found to be 2.654x10⁻⁵ K-1 using Equation 2. The experimental values for a similar temperature range of 300 to 1000 K found in literature was 3.99x10⁻⁵ K-1.[4] This has the same order of magnitude as the computed coefficient of thermal expansion and both values were in agreement.

Molecular Dynamics
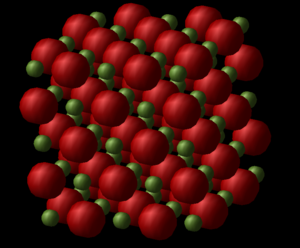
In the molecular dynamics method, the free motion of atoms means that a larger number of cells is essential to provide vibrational flexibility and more accurately simulate the different vibrational modes of the MgO crystal lattice. Hence, a supercell containing 32 MgO units (Image 4.) is used for the molecular dynamics calculations.
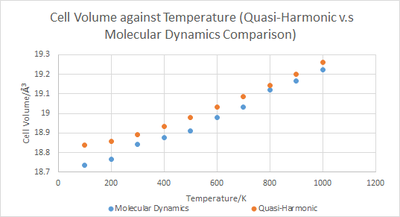
As can be seen in Plot 5, there is an upward trend in cell volume as a function of temperature for both the quasi-harmonic and molecular dynamics models. At lower temperatures, the molecular dynamics approach gave significantly smaller cell volumes than the quasi-harmonic model but the values converge at higher temperatures but are not identical.
The upward trend can be explained by an increase in thermal energy within the system due to elevated temperatures causing an increased accessibility to higher energy vibrational modes. A greater repulsion between nuclei occur at these higher energy vibrational states giving rise to elongated bond lengths and thus larger cell volumes.
The smaller cell volume values from the molecular dynamics approach relative to the quasi-harmonic model at lower temperatures is due to the consideration of the zero-point energy within the equation for the Helmholtz free energy in the quasi-harmonic model (Equation 2) which is in turn used in determining the cell volume. The zero-point energy is a product of the quantum mechanical Heisenberg uncertainty principle and therefore its consideration is absent within the classical mechanics based molecular dynamics model.
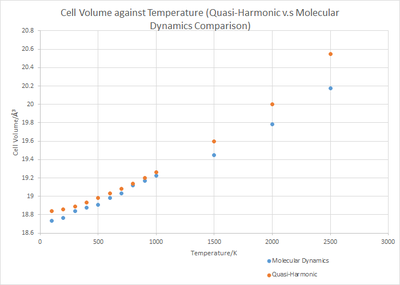
A comparison between both models at higher temperatures can be drawn from plot 6. At higher temperatures approaching the melting point of MgO at 3125 K, the Mg2+ and O2- bonds break as a solid to molten phase change occurs. This behaviour is not accounted for within the quasi-harmonic model as it does not allow for the bonds to break and instead gives rise to continuous expansion of the crystal lattice. The molecular dynamics model allows bond breakage for a phase change to occur, and is thus the more accurate model at higher temperatures.

The thermal expansion coefficient was calculated to be 3.185x10⁻⁵ K-1 for the molecular dynamics model. This value is in better agreement with the literature value as compared to the value obtained from the quasi-harmonic model.
Conclusion
The thermal expansion of the MgO crystal lattice was simulated using the quasi-harmonic and molecular dynamics approaches in this experiment. The appropriate shrinking factor was determined to be 32 for the quasi-harmonic model. This was done by generating DOS curves for several shrinking factors and weighing the degree of resolution against computational cost. A further justification of this grid size was made by observing the degree of convergence in the Helmholtz free energy values as the shrinking factor increased. In contrast, the appropriate grid size for molecular dynamics calculations was not empirically established due to the its greater computational cost.
The calculated Helmholtz free energy was observed to decrease as a function of temperature. This can be rationalised by a greater entropic contribution at higher temperatures. The lattice parameters and cell volume were then calculated as a function of temperature with both models. The deviations in cell volume values between each model occurred at lower temperatures (100-500 K) and at higher temperatures close to the melting point of MgO. The deviations at lower temperatures were determined to be due to the consideration of the quantum mechanical zero-point energy in the quasi-harmonic approximation which was absent in the Newtonian mechanics based molecular dynamics approach. The deviations at higher temperatures were due to the oversight of the possibility for bonds to break in the quasi-harmonic model which led to continuous expansion of the crystal lattice. Molecular dynamics nonetheless took bond breakage into account and allowed for a phase change at high temperatures.
By evaluating the limitations of each model, it can be concluded that at lower temperatures, the quasi-harmonic model is better at predicting thermal expansion whereas at higher temperatures, molecular dynamics would give the better approximation.
References
- ↑ http://www.crystec.de/daten/mgo.pdf
- ↑ 1.II-VI and I-VII Compounds; Semimagnetic Compounds, 1999, 1-3.
- ↑ D. N. Stamires, Clays and Clay Minerals, 1973, 21, 379-389
- ↑ O.L. Anderson and K. Zou, J Phys Chem Ref Data, 1990, 19, 71
