Rep:MgO dt2315
Abstract
The thermal expansion of MgO (periclase) has been simulated using DL Visualize (DLV) graphical user interface for modelling the crystal structure. Lattice dynamics (quasi-harmonic approximation) and molecular dynamics have been studied on a temperature range between 0K and 2900K. Using the results for free energy from the two methods, the equilibrium volume and thermal expansion coefficients have been computed and compared to literature results.
Introduction
Experimentally, the crystallographic information can be obtained using techniques such as neutron or X-ray diffraction. Inelastic neutron scattering (momentum is conserved, but energy is not) can provide valuable information regarding the thermal properties of solids. However, knowing the arrangement of atoms and the interatomic distances, the thermal expansion can be computationally simulated. Here, two methods are applied to simulate the thermal behaviour of magnesium oxide (MgO), a face-centred cubic (fcc) system with 2 atoms per primitive unit cell and 8 atoms per conventional cell.
Knowing how the volume varies with temperature, the thermal expansion coefficient can be derived at constant pressure as follows:
Lattice Dynamics (quasi-harmonic approximation)

The quasi-harmonic approximation builds upon the harmonic approximation in which the vibration of atoms is described as a simple harmonic motion and the energy is a quadratic function of the displacement from the equilibrium position. An immediate limitation is the fact that the equilibrium position does not change, hence not taking into account the thermal expansion. This also means that in a diatomic molecule with a harmonic potential the bond length stays constant, regardless of the temperature. In lattice dynamics, the harmonic approximation is still assumed for every lattice constant (interatomic distance) but this parameter is adjustable and increases with temperature as it will be shown further. If an analogy is made between the Morse potential that models the interatomic potential interaction and a ball in well, then at 0K, the ball would sit at the bottom of the well. However, when the temperature increases, this is similar to giving the ball some energy, causing it to oscillate between xmin and xmax. Away from the minimum, the potential becomes asymmetric and |xmax − xeq| > |xmin − xeq|. As a result, on average, the particle's position will move further from the initial equilibrium position. This can be thought as the origin of thermal expansion, the increase in the equilibrium distance.
It is worth noting at this point that although the thermal expansion predicts a continuous increase in the interatomic distance with temperature until the melting point is reached, the quasi-harmonic approximation predicts a constant energy beyond a certain point. As it will be shown, the approximation fails at high temperatures.
Analogous to electrons and photons, vibrations also possess wave-particle duality. A phonon can be defined as a discrete quantum of vibration and is used in this simulation to describe the collective vibrational excitation of a the periodic lattice. Firstly, the transition between the real space and the reciprocal space can be made using . The reciprocal space is a periodic set of points given by the Fourier Transform of a periodic spatial lattice (Bravais lattice).
Vibrations can be described by the k wave vector which is given by:
The vibrational frequency is proportional to
In the reciprocal space, the region showing the vibrational frequency as a function of k between and is called the first Brillouin zone. This region represents the volume within which the unique k-vectors are represented and shows the acoustic phonons passing through the origin. By a process called folding, the optical phonons from the second Brillouin zone can be represented on the first one. By plotting all the dispersion curves in this region, the reduced zone scheme is obtained.
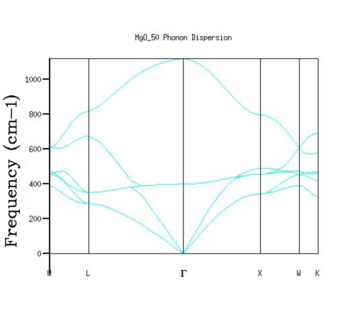
Similar to forming an equal number of molecular orbitals from atomic orbitals, the number of vibrational bands or branches is equal to the number of atomic orbitals in the unit cell in 1D. For each additional dimension, more branches are added. However, when the phonon dispersion is plotted, this is done along a particular path, as opposed to plotting the surface plot for higher dimensions. This can be seen for MgO in Figure 3.
Molecular Dynamics
Returning to classical mechanics, the Molecular dynamics is, generally speaking, an N-body simulation that provides an alternative to the previous method by studying the physical movement of atoms or molecules. In MgO, the trajectories of atoms are determined by solving Newton's equations of motion. The simulation steps can be described as follows:
1. Forces (F) on the atoms are computed using the interatomic potentials
2. Acceleration is calculated using Newton's Second Law
3. The velocities are updated
4. The positions are updated
5. Repeat until energy settles down (i.e. is minimised)
Overall, the energy is minimised as a function of atomic position and the configuration reached can be used to extract information regarding the crystal structure at different temperatures. While this can be more time demanding, the atoms are moving following the trajectories they would in reality.
While in both MD and LD the energy is minimised, different energies are calculated and results are expected to be slightly different.
Methodology
MgO was studied as an ideal, non-deflective periodic system in 3D.
Lattice Dynamics (quasi-harmonic approximation)
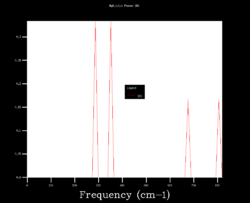
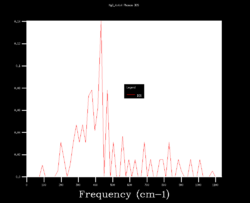
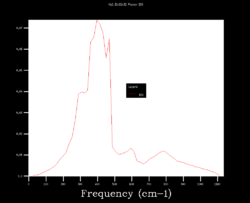
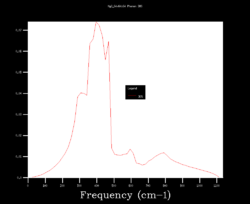
In order to choose the grid size (shrinking factors), the density of states (DOS) was calculated varying the size from 1x1x1 to 64x64x64. Four results are shown below and it can be seen how starting as four peaks, the DOS becomes smoother at larger sizes (i.e. more k points sampled). Although many more k points are sampled for the 64x64x64 grid, the DOS looks very similar to the 32x32x32 one. Moreover, the zero-point energy converges to 0.1743 eV for grids larger than 5x5x5.
| 1x1x1 | 4x4x4 | 32x32x32 | 64x64x64 |
|---|---|---|---|
 |
 |
 |
|
These measures can provide an intuition about what happens as the grid size is increased. As the thermal expansion calculations are run by minimising the Gibbs free energy, the effect of grid size on this physical measure was studied. Numerically, the free energy is approximated as a sum of the vibrational modes over a finite grid of k-points in a infinite crystal. The size was varied from 1x1x1 to 32x32x32 at 300 K and 0 GPa. The free energy increases and converges as the size is increased. Even a 3x3x3 grid size (-40.926 eV) would be appropriate for calculations accurate to 1 meV/unit cell and a 5x5x5 grid size (-40.9265 eV) for calculations accurate to 0.1 meV/unit cell.

Considering the free energy convergence and because time allowed it, the grid size of 32x32x32 was chosen for further calculations. For this size, the free energy computed was -40.926483 eV.
Molecular Dynamics
The initial configuration was chosen as that of an ideal MgO crystal structure and the velocities were randomly assigned but scaled to roughly produce the chosen temperature. A super cell containing 32 MgO units was used to allow more vibrational flexibility in the crystal. While this should be a good compromise between accuracy and efficiency, based on the previous experience of choosing a grid size for the lattice dynamics, a similar approach could be used. By plotting the energy as a function of size, the convergence should be a good indicator of optimum size. If only a primitive cell would have been used, then all the the other unit cells would simply translate instead of allowing for the atoms from different primitive unit cells to interact.
The system was studied as an NPT ensemble in which volume was allowed to vary. A temperature range between 100K and 2900K was studied with a time step dt = 1 femtosecond, 500 equilibration steps and 500 production steps (run after equilibration was completed). The number of sampling steps and trajectory time steps over which the averages were calculated were set to 5.
Results and Discussion
Phonon Dispersion
As expected, the phonon dispersion of MgO shows six branches in 3D where the number of branches is three times the number of atoms (i.e. 2). There are three acoustic phonons that show linear dispersion as k approaches 0 (zero frequency at the centre of the Brillouin zone centre) and three optical phonons.
The link between the phonon dispersion and the DOS can be nicely seen for the grid with dimensions 1x1x1, in which only one k point was computed. There are two peaks between 600-900 nm and two peaks with a double intensity between 200-400 nm. The phonon dispersion shows exactly this at L (0.5, 0.5, 0.5), where the double intensity is caused by the overlapping of two acoustic phonons for the first peak and one acoustic and one optical phonon for the second one. Indeed, this k-point can be confirmed with the Log file. In general, these labeled points correspond to different combinations of ns and np symmetry adapted orbitals. [5].
The density of states is proportional to the inverse of the slope of energy (and hence the frequency) as a function of k. In other words, the flatter the branches in the phonon dispersion, the greater the density of states will be [5]. Looking at larger grid sizes such as 32x32x32, the highest DOS is between 300 - 500 nm. While this would not necessarily be obvious only by looking at the phonon dispersion, the acoustic branch that belongs to this range is indeed the flattest one.
One observation worth mentioning is that the phonon dispersion is computed independent of temperature. At high temperatures approaching the melting point, the vibrational modes will probably fail to represent the vibrational modes accurately as the interactions become anharmonic.
Lattice Dynamics (quasi-harmonic approximation)
The thermodynamic link between temperature and volume for the quasi-harmonic approximation is given by the Helmholtz free energy. By definition,
Differentiating the free energy gives:
From the first Law of Thermodynamics,
In a reversible change,
Substituting in the Helmholtz free energy gives:
For the quasi-harmonic approximation, the vibrational free energy can be rewritten as:
Here, E0 is the internal lattice energy and the second term corresponds to the zero-point energy.
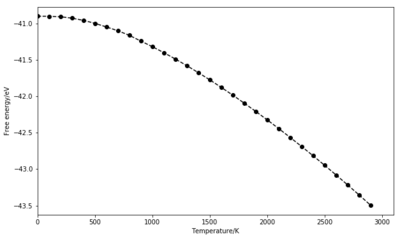
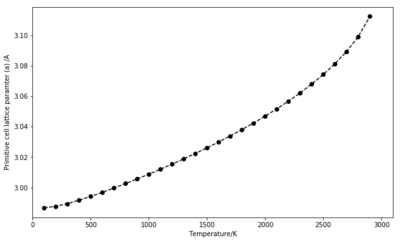
At low temperatures, the Helmholtz free energy is almost constant as it is dominated by the zero-point energy term. The exponential term goes to 0, causing every term in the sum to go to ln(1) = 0. As temperature increases, this term becomes dominant and the free energy decreases abruptly. Having a similar but inverted shape, the lattice parameter (a) plotted for the primitive unit cell increases with temperature. As predicted by the thermal expansion, this parameter needs to be updated at every different temperature to allow the bonds to elongate.
Already computed in the simulation, the volume of a rhombohedral lattice system can be calculated using the lattice parameter as follows with = 60o for MgO:
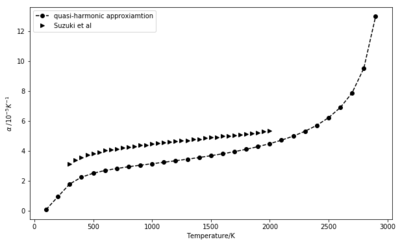
Two approaches were used to calculate the thermal expansion coefficient for this simulation. One looked at the slope of cell volume as a function of temperature on the 500 K to 1300 K range. Based on previous experiments, the quasi-harmonic approximation is expected to stand up to 2000 K, where little evidence of anharmonicity is seen [1]. The slope was found to be dV/dT = 2.3716 10-3 , giving = 3.1238 10-5 K-1 . The volume plot is shown in Figure 8.
In the second approach, the difference in volume was calculated between each two consecutive values and normalised by the volume corresponding to the lower temperature (initial volume). Although plotted for the entire temperature range for which simulations were performed, the comparison with the literature values [2] focus the range 300 K to 2000 K. The data seems in relatively good agreement.
Molecular Dynamics
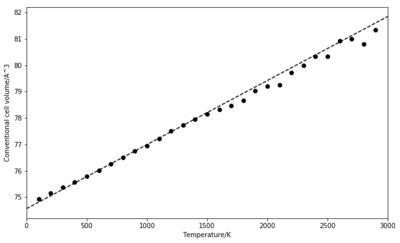
In the MD simulation, the volume increases linearly with temperature until higher temperatures are reached. For these, the data becomes noisy raising questions about the suitability of the model at high temperatures. A linear fit on the range 500 K to 1300 K gives a slope for dV/dT of 2.4286 10-3 and = 3.2043 10-3. This value is slightly higher than the one obtained in the previous simulation.
One thing that could be done to improve the simulations at temperatures approaching the melting point, is to change the time step dt to allow the vibrations of the atoms to be sampled better.
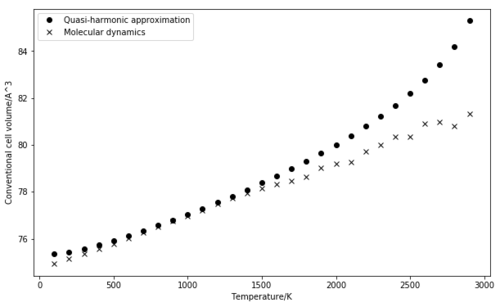
The main difference that can be noticed when compared to the lattice dynamics (Figure 8) is in the region of high temperatures. Based on the quasi-harmonic approximation, the volume is increasingly overestimated as higher order anharmonic terms are not taken into account [3]. If the second method from LD by calculating the difference in volume for each pair or consecutive temperatures is used, the plot of the thermal expansion coefficient is very scattered. The results below are given by a linear fit.
When compared with data from X-ray diffraction that used a polynomial equation to predict it as a function of temperature, the results at 300 K are close to literature data [6]. The values found for the two simulations were and
Conclusion
The two methods used gave similar results for the thermal expansion on the 500 K to 1300 K range. The properties computed on this range were also in relatively good agreement with literature data. Both methods seemed to fail at high temperatures, yet this was somehow expected. The models are designed to model interactions between atoms that are bound to each other, not free as they would become as the melting point is approached. In other words, the volume predicted in both simulations is the volume of a MgO unit cell. However, in reality, the periodic structure is lost at high temperatures.
References
1. O.L. Anderson and K. Zou, Phys. Chem. Min. 16, 642 (1989).
2. I. Suzuki, J. Phys. Earth 23, 145 (1975).
3. M. Matsui, G. D. Price and A. Patel, Geophys. Res. Let. 15, 1659 (1994).
4. S. H. Simon, The Oxford Solid State Basics, Oxford (2013).
5. R. Hoffmann, Angew. Chem. Int. Edn. Engl. 26, (1987).
6. Dubrovinski, L. S., S. K. Saxena, Phys. Chem. Miner., 24, 547 (1997).
Further questions
Would the optimal grid size for MgO be appropriate for a calculation on:
- a similar oxide (e.g. CaO)?
Yes, in the quasi-harmonic approximation the calculations are done by looking at atoms as charges. Ca has the same +2 charge as Mg and while Ca is larger, the grid size and hence the number of k points sampled should be appropriate as the same type of vibrations would be expected to occur. In terms of the thermal expansion coefficient, this might be expected to increase for CaO as the bonds are weaker (atoms and orbitals size match not as good as in MgO).
- a Zeolite (e.g. Faujasite)?
A Zeolite unit is much larger than the MgO unit. It is worth remembering than the relationship between real space and reciprocal space is inverse. A larger a (lattice parameter) leads to a smaller a*. In such a situation, a smaller number of k points is needed to study the vibrations.
- a Metal (e.g. Lithium)?
The Lithium unit cell is much smaller than the MgO. Moreover, the atoms and the charges are the same. Using a similar reasoning to the comparison with Zeolite, a smaller a leads to a larger a* in the reciprocal space where a larger number of k points is needed to gain accurate information about the path that connects them. In other words, a larger grid size would be needed. In terms of the phonon dispersion, more degeneracy could be expected as the atoms are identical.
