Rep:MgO cas115
Abstract
Phonon modes of Magnesium Oxide’s crystal lattice where simulated using a General Utility Lattice Program (GULP) to monitor MgO's thermal expansion. Thermal expansion coefficient values determined using Quasi-Harmonic Approximations (QHA) and Molecular reaction Dynamics (MD) were 2.812795956x10⁻⁵ K-1 and 3.02469506x10⁻⁵ K-1respectively.
Introduction
The aim of our investigation was to determine the thermal expansion coefficient of MgO; an ionic molecule that exists as a crystal lattice and has a Face Centred Cubic Cell with 2 atoms per cell. We used Linux software and GULP calculations (Fourier transformations) to model the thermal expansion of MgO.
How GULP works
Crystal Lattices can have an infinite number of vibrations but they can be easily counted using a repeating unit cell. A vibrational wave (a phonon) has a wavelength equal to a determinable unit cell length. This wavelength is then converted into a subsequent wave vector by GULP:

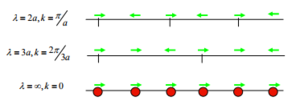
GULP works by converting a “real” model of an inputted lattice into a resembling reciprocal lattice in k space, in which the symmetries are interrelated. k space is in terms of 3D k-vectors. A k-vector describes the direction and wavelength of a vibration; a phonon. As λ decreases the magnitude of k increases (to a value of π/a). A frequency of the phonon (ωk) can be determined in 1D using the k-vector associated with the phonon as well as the masses of the atoms causing the vibration and a spring constant value between the 2 atoms.[2].

[3].
The relation means a k value with a large magnitude leads to a large frequency.
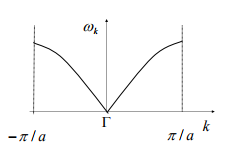
A dispersion curve can be plotted to represent the phonon frequency of a given k vector. The range must be able to map the entire reciprocal space for the lattice. Note there are negative vectors but they are always of equal and opposite magnitude to the corresponding positive vector. The monatomic dispersion curve for the 1D diatomic chain show in figure 1 has a dispersion curve represented in figure 2. To reiterate, as the k vector increases magnitude so does its frequency. Acoustic lower due to vibration in phase.[4].
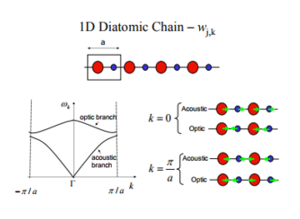
A 1D diatomic chain has a differing dispersion curve, with an acoustic and optical band. Figure 3 clearly displays what gives rise to the 2 bands. We however are dealing with a 3D crystal lattice with 2 atoms per cell. This gives rise to 6 differing vibrational bands. [5]
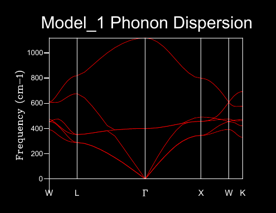
This dispersion curve is shown in figure 4 and was recorded using GULP. The labeling on the x axis refers to a high point in symmetry in the lattice in k space. Frequencies are attained through similar algebraic manipulation as the to that of the 1D equation used to find frequency. [4].
The density of states (DOS) recording demonstrates the abundance of vibrational states for a given energy.[5] [2].
Use of QHA and MD
By using both the QHA (based on quantum mechanics) and MD (based on classical motion) values for the thermal heat expansion coefficient can be determined.
QHA
The Harmonic Approximation assumes all interatomic forces are purely harmonic meaning that oscillation of bond lengths at any given temperatures are of equal and opposite magnitude in terms of symmetrical stretches and compressions, thus it predicts there is no thermal expansion due to a constant volume. To account for thermal expansion, lattice vibrations must also be considered. The Quasi Harmonic approximation does this in a simplistic manor by approximating the harmonic approximation is suitable for all conventional cells within a crystal but the frequencies of vibrations are dependent on volume. Helmholtz free energy is evaluated below in the Quasi-Harmonic approximation:

[6].
The first term is the internal contribution, the second: the zero-point energy and third term: the vibrational contribution. Once A suitable shrinking factor is determined so that the sample of vibrational modes taken from the cell is adequate to stimulate the density of states; GULP calculations can be carried out on a primitive cell of MgO to determine differing relative abundances and frequencies of vibrations at a given temperature. As vibrations for a cell can be determined and the QHA approximates that frequencies are purely dependent on volume, a given set of frequencies must correspond to a certain volume that can be found through GULP. Thus in knowing the abundance and frequency of phonons at differing temperatures gives us specific volumes it is possible to compute the changing volume of the cell with temperature. [6]. [7].
MD
MD works by simulating classical Newtonical interactions bettween different atoms within a supercell in a certain time frame. Use of 1 cell would be insufficient as it would only represent totally in phase motion; the larger the super cell, the greater the representation of a real lattice. MD was carried out using the zero-pressure method. This meant periodic boundary conditions were in place, much same as the QHA. The “simulation box” relaxes simultaneously with the structure so the lengths of the system are always equal to that of the supercell used. The time frame should be long enough to simulate all possible classical interactions as well as record the relative abundance of these interactions and thus model it over any extended time frame. This time frame should allow full equilibration of the structure in question allowing an average volume to be determined for the temperature. As the reciprocal space is inversely proportional to the real space, the use of a supercell (of course several times larger than a primitive cell) will have a far smaller reciprocal space and thus a small shrinking factor can be used to attain sufficient Phonon information in order to model thermal expansion. [6]. [8].
Recording DOS
Multiple DOS determinations where carried using differing shrinking factors. The Shrinking factor determines a grid of k points in which a DOS is taken. A larger shrinking factor gives a higher DOS plot resolution as the “density of the grid” in which k points are taken from is more close-knit.
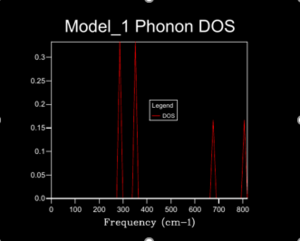
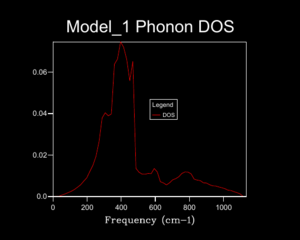
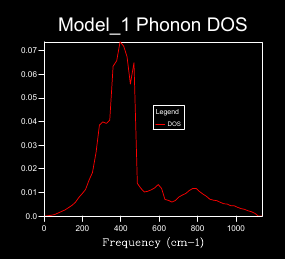
A 1x1x1 shrinking factor used to monitor the DOS for MgO at 0 K, demonstrated in figure 5, gave 1 k-point found at L of the dispersion curve; there are 6 vibrational bands but only 4 peaks are show at different frequencies for the DOS plot, this is due to 2 peaks overlapping twice at the given k-point thus producing double the density at the given frequency. By progressively increasing the shrinking factor and plotting the corresponding DOS a better interpretation as to the true relative abundance of phonons at particular frequencies is attained. A greater number of phonons are displayed by the DOS plot as more k points are sampled. This better demonstrate the actual DOS. When a shrinking factor of 24x24x24 was used the DOS of states plot was smooth and consistent enough for our needs, a further increase of the shrinking factor required progressively lengthening periods of computational time but had little benefit in achieving a better representation of DOS plots. Figures 5 and 6 represent this similarity in DOS plot when factors of 24x24x24 and 32x32x32 where used respectively. shrinking .[4]. The grid size used would work well for compounds with the same crystal structure but monatomic simpler structures like Lithium metal would require fewer k-points to acquire and adequate DOS (so smaller shrinking factor) but complex ones like Faujastite would require far more k points to correctly understand the DOS (so larger shrinking factor, this would require hiigh levels of computational power).
Optimising the shrinking factor
Calculating the free energy in the Quasi-Harmonic approximation to attain convergence. GULP calculations, of the same nature when plotting the DOS, were carried out setting temperature to 300K and differing the shrinking factor. A Helmholtz free energy was attained for a given shrinking factor at the conditions. As the shrinking factor increased it began to plateau at -40.926483 eV. Increasing the shrinking factor increases the number of k-vectors recorded and thus we attain more information about possible phonons within the cell. As we gain more information about the phonons we can more accurately determine the entropy; this in turn can lead to better determination of Helmholtz free energy under different temperatures and then volume.. As we want to determine a value for the thermal expansion coefficient using a suitable shrinking factor to determine volume of the molecule’s cell at a given temperature is paramount to the investigations success. Setting the Shrinking factor to 24x24x24 and 32x32x32 gave the same result; the precision of the Linux software gave an output was limited to a reading off 0.000001 eV. To increase the shrinking factor any further in order to attain further accuracy would be redundant for our means as computational time would be far too high.
For calculations with accuracy of 1 meV, 0.5 meV and 0.1 meV grid sizes of 3x3x3 (-40.926432 eV), 4x4x4 (-40.926450 eV) and 5x5x5 (-40.926463 eV) are respectively appropriate.
Results
QHA
Using the shrinking factor 24x24x24, GULP calculations monitored how free energy and the cell volume altered with temperature. Results are displayed in figures 7 and 8.

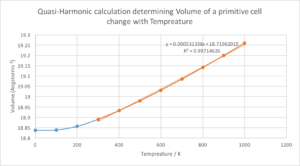
Figure 7 demonstrates how the increasing temperature caused free energy to non-linearly decrease. Helmholtz is defined as A=U-TS, so predictably an increase in temperature causes a decline in Helmholtz. The Non-linearity is an attribution of the change in entropy as well as temperature when modelled under the QHA. As temperature further increases the contribution of S to A becomes evermore great. Increasing the temperature decreases free energy and thus decreases the stability of the given lattice. [9].
Figure 8 shows how the increasing temperature causes an increase in volume of the MgO primitive cell. The expansion is linear from 300 k to 1000 k but from 0 k to 300 k the increase in volume relative to temperature is modeled as a parabola. At low temperature, the amplitudes of phonons are much smaller than interatomic distances. The QHA acknowledges that the zero-point energy is the dominant contributor to cell volume. This zero-point energy arises from the ever fluctuating zero-point fields, Heisenberg uncertainty means these fields will always exist, causing zero-point motion that has zero-point energy. So, the dependence of the ground-state energy (at low temperatures) on the deviation from equilibrium of the atomic positions is quadratic; this relates to the minimum of the Lennard-Jones potential.[9]. [10]. [11].
An incremental temperature increase causes a thermal expansion that has a coefficient modeled by the equation:

Above 300k, the linearity of thermal expansion is due to the vibrational contribution to Helmholtz free energy being dominant as amplitudes of phonons become greater than those of zero-point motion. Within this linear region the coefficient of thermal expansion is constant and modelled by the equation:

Setting the initial volume equal to that at 300 K a value of α was found to be 2.8128x10⁻⁵ K-1 [12]., this was like literature values found experientially measured at 300 K: 3.06x10⁻⁵ K-1; suggesting strength in using the QHA to determine the thermal expansion coefficient.
The QHA approximation is however flawed. As the temperature approaches the melting point and goes beyond it the lattice begins to act anharmonically. The QHA still presumes atoms are organised within a lattice. Of course, this is not the case. As the temperature exceeds the melting point the entropy dramatically increases meaning real entropy contribution to free energy of MgO will be far more negative than that approximated through using the QHA. In addition to this, the liquid at high temperatures experiences high vibrionic excitations that causes the molecules to probe parts of the potential energy curve where parabolic approximations falter. Phonon frequency is solely dependent on volume in the QHA so if we are using frequencies to establish a volume but volumes are wrong we evidently shall have a resulting incorrect volume as harmonic approximations breakdown. [6]. [7]. [13].
MD

Using a 32-atom containing supercell, allowing a sample of ample k-space values, thermal expansion was modelled using MD theory. Thermal expansion is shown in figure 9. The gradient was linear between temperatures: 300 K – 2500 K and using the same equation as for QHA, when the gradient was stable, the thermal expansion coefficient was found to be 3.0247x-5 K-1 at 300 K. A similar value to that found using the QHA but slightly closer in value to that of literature. At temperatures in excess of 2500 K the volume tends away from this linear increase. MD modulation doesn’t work based on harmonic approximations so can consider the annharmonicity previously discussed. MD modulation is not constrained to approximate that the lattice remains intact at high temperatures as energies of vibrations can exceed parabolic confinements of the harmonic approximation. This allows MD based calculations to remain somewhat accurate at determining the thermal expansion at high temperatures, or at least better than the QHA.
MD modulation is also faulted. At low temperatures, thermal expansion is modelled poorly and has no parabolic modulation. MD based calculations do not consider the zero-point motion and thus energy of molecules as it does not appreciate quantum mechanical properties of molecules. At low temperatures, this zero-point energy has a strong influence on cell volume but due to reasons just stated an accurate volume is not computed. Of course, this means trying to attain thermal heat expansion data at low temperatures is futile. [6]. [10]. [11].
Conclusion
Both QHA and MD computed results produced thermal expansion coefficients of accuracy between temperatures of 300 K and 1000 K. Outside this temperature range the use of either technique has its own set of advantages and disadvantages. The QHA worked well at low temperatures when determining the thermal heat capacity due to its regard of zero-point energy but due to its reliance on a harmonic approximation, its ability monitor thermal heat expansion deteriorates under environments of ever increasing temperature. MD calculations differ to those made through QHA use by retaining greater accuracy at modelling thermal heat expansion at high temperatures but faltering when temperatures were low. The QHA modelling use of a repeating unit cell allows fast calculations that can attain a lot of k-points whereas MD modelling effectively re-enacts the interactions between molecules in the real world over a given time frame, this can be a timely process that requires a lot of computing time.
References
[13]"
- ↑ 1.0 1.1 1.2 1.3 Lecture 4, Vibrations in crystals by Prof. Nicholas Harrison
- ↑ 2.0 2.1 Cite error: Invalid
<ref>tag; no text was provided for refs namedRelating k to frequency - ↑ 3.0 3.1 Physics of Condensed Matter, Prasanta Misra,Chapter 21
- ↑ 4.0 4.1 4.2 4.3 Julian D. Gale & Andrew L. Rohl (2003) The General Utility Lattice Program (GULP) , Molecular Simulation, 29:5, 291-341, DOI: 10.1080/0892702031000104887
- ↑ 5.0 5.1 5.2 1M. T. Dove, École thématique de la Société Française de la Neutronique, 2011, 12, 123–159.
- ↑ 6.0 6.1 6.2 6.3 6.4 6.5 MgO at high temperatures and pressures: shell-model lattice dynamics and molecular dynamics,D Fincham, W C Mackrodt and P J MitchellJournal of Physics: Condensed Matter, Volume 6, Number 2
- ↑ 7.0 7.1 7.2 1Y. Wang, Z.-K. Liu, L.-Q. Chen, L. Burakovsky and R. Ahuja, Journal of Applied Physics, 2006, 100, 23533.
- ↑ 8.0 8.1 1H. C. Andersen, The Journal of Chemical Physics, 1980, 72, 2384–2393.
- ↑ 9.0 9.1 9.2 Thermal Properties of Materials from Ab Initio Quasi-Harmonic Phonons, Stefano Baroni, Paolo Giannozzi, Eyvaz Isaev, Reviews in Mineralogy & Geochemistry Vol. 71, 2009
- ↑ 10.0 10.1 10.2 Milonni, P. W. (1994). The Quantum Vacuum: An Introduction to Quantum Electrodynamics. Boston: Academic Press.
- ↑ 11.0 11.1 11.2 Sciama, D. W. (1991). "The Physical Significance of the Vacuum State of a Quantum Field". In Saunders, Simon; Brown, Harvey R.The Philosophy of Vacuum. Oxford: Oxford University Press.
- ↑ 12.0 12.1 Using Variable Temperature Powder X-ray Diffraction W To Determine the Thermal Expansion Coefficient of Solid MgO, Nicholas C. Corsepius, Thomas C. DeVore, Barbara A. Reisner*, and Deborah L. Warnaar, Journal of Chemical Education, Vol. 84 No. 5 May 2007
- ↑ 13.0 13.1 Atkins physical chemistry,9th edition, chapter 12,
