Rep:MgO Thermal Expansion SL
Aim
The aim of this exercise is to predict the thermal expansion of magnesium oxide crystal by determining its thermal expansion coefficient.
Introduction
Magnesium oxide
The magnesium oxide crystal that will be investigated in this exercise is considered to be a perfect crystal with no defects. The crystal has a face-centered cubic (fcc) structure, meaning that the distance between an atom and its nearest neighbor is always the same in x, y, and z direction—a=b=c. In the conventional cell, α=β=γ=90o, each cell contains 8 atoms, i.e. 4 MgO. In the primitive cell, α=β=γ=60o, each cell contains 2 atoms, i.e. 1 MgO. The supercell contains 4 conventional cell, 64 atoms, i.e. 32 MgO. To determine the volume of the crystal in the later stage, the lattice parameter, which is the length of each side of the cubic conventional cell will be reported.
Concept of Thermal Expansion
Thermal expansion is the change in volume of a material due to the change in temperature under constant pressure. It is defined by thermal expansion coefficient [1]
| (Eq.1) |
The larger α is, the larger the change in volume is with respect to temperature.
Origin of Thermal Expansion
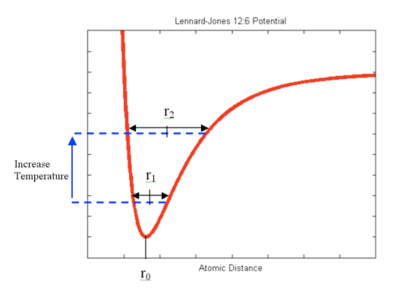
In solid crystal, atoms are arranged in ordered structure but they are not static. They vibrate within a certain space with an equilibrium position. As temperature increases, the kinetic energy of the atoms increases, so does their amplitude of vibration, which is the maximum distance that the atom can move away from its equilibrium position. This is explained by the Lennard-Jones Potential—when the temperature increases, the energy of the system increases, leading to the increase in atomic distance from r1 to r2 (see Figure 1).
Thermal Expansion and Helmholtz Free Energy
When internal energy increases due to temperature increase, at constant pressure, the Helmholtz free energy of the material increases according equation 2.
| (Eq.2) | |
| (Eq.3) |
Helmholtz free energy is the maximum energy available to do work at constant temperature. By differentiating equation 2 and substituting equation 4 results in equation 5, showing how Helmholtz free energy is a function of volume and temperature.
| (Eq.4) | |
| (Eq.5) |
This is to say that when internal energy changes due to change in temperature, Helmholtz free energy changes, changing volume of the system.
Methodology
Two methods were used in this exercise to determine the thermal expansion coefficient of MgO.
Quasi Harmonic Approximation
This method approximates an anharmonic system to a harmonic system to obtain exact solutions of energies and other physical properties [3]. This is considered to be a reasonable method in low temperatures, i.e. low kinetic energy, because in the low potential energy region in Lennard-Jones potential, where the equilibrium distance between atoms lies, vibration energy shows a harmonic behavior. This approximation allows the vibrational energy levels to be solved as
| (Eq.6) |
with the potential of
| (Eq.7) |
With the vibrational energy solved, the vibrational partition function is defined to be
| (Eq.8) |
and hence the Helmholtz free energy is defined as
| (Eq.9) [4] |
Where k is the wave vector of every vibration the crystal (defined as 2π/λ), j is the number of branches (defined by the multiple of number of atoms and dimension of the system) and ω is the frequency of the vibration. With the Helmholtz free energy computed statistically, the volume, i.e. the lattice parameter, of MgO at different temperatures can be determined.
Therefore, the inputs required to determine the lattice volume at each temperature are the initial configuration of MgO (which determines the value of j) and the number of k-points to be considered in equation 9.
Molecular Dynamics [5]
Another way to obtain the volume of MgO at different temperatures without using harmonic approximation is by optimizing the energy of MgO as a function of its atomic position. This is done by first computing the force between atoms. Then, by Newton’s second law, the acceleration is computed. Using the acceleration, the velocity is updated, leading to changes in the position of atoms. Atomic distance affects the interatomic forces, so the whole process repeats at given time steps, until the target temperature is reached and the average of the properties of the crystal converges into a constant, i.e. small variance, the volume of the MgO crystal is measured [6]. In other words, unlike quasi harmonic approximation, molecular dynamics does not require harmonic approximation, nor the value of k. Yet, molecular dynamics requires the ergodic hypothesis, which states that for a large enough system, the average of the properties among statistical ensembles is the same as the time averaged properties of a single system [7], hence it has a time dependence.
Programme used
DLV in Linux was used to visualize the 3D MgO crystal in atomic level [8]. With GULP programme, the energetics of the 3D system can be obtained [9].
GULP in Quasi Harmonic Approximation
Using GULP, the phonon dispersion curve of MgO was plotted to show the frequency of all possible vibrations (phonon is the particle-like form of vibration). The dispersion curve was used to compare with the graph of density of states of phonons to determine the shrinking factor, which governs the numbers of k-values to be considered in equation 9 (more details in the results section). The optimal shrinking factor should result in the most appropriate and efficient approximation to the density of states. This shrinking factor was then used in the computing the free energy of the crystal at different temperatures, and hence the lattice parameter and cell volume.
GULP in Molecular Dynamics
GULP can also compute the lattice parameter using molecular dynamics. In this investigation, the ensemble used has fixed number of particles, external pressure and temperature, leaving volume of the crystal to be a variable. 0.5 ps was allowed for each system to reach its equilibrium. Then, the programme generated the time averaged volume of the MgO crystal as the output.
Results & Discussion
Determine shrinking factors
The phonon dispersion curve of MgO was computed as shown in Figure 2.
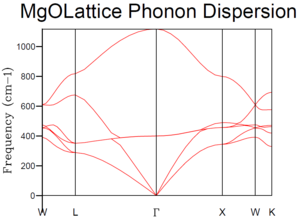 |
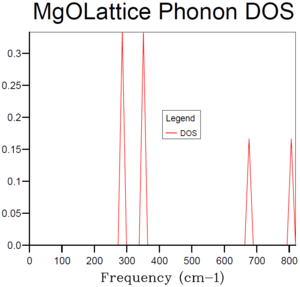
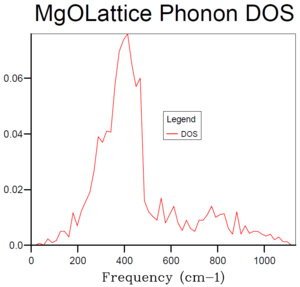
Figure 3-8 show how the density of states changes with increasing shrinking factors at different phonon frequencies.
To plot the graph of the density of states, the shrinking factors were required as an input. This is because the density of states is calculated by considering a certain number of k-points, taking the vibrational frequencies of the six branches in each k-point, then calculate the intensity, which is the relative frequency of “occurrence” for each vibrational frequency. The shrinking factor determines the number of k-values to be considered in the Brillouin zone of MgO. When it is 1x1x1, only one point is considered. For 2x2x2, each side of the Brillouin zone is divided by 2, giving eight k-points as input. Thus, the greater the shrinking factors, the more k-points are taken as the input to the measurement of the graph of density of states.
When the shrinking factor is 1x1x1, only one k-point was taken into account. According to Figure 3, this k-point has the frequency at around 290, 350, 680 and 810 cm-1, with the intensity of 2:2:1:1 (refer to table 1). This is to say that there are degenerated branches at both 290 and 350 cm-1 and their density shows there are two branches at each degeneration. In the phonon dispersion curve (see Figure 2), the L symmetry point shows the same characteristics—similar frequency, same degeneracy. This is to say that the only k-point that was taken into the calculation of the density of states is point L.
| Frequency (cm-1) | Intensity | Intensity ratio |
|---|---|---|
| 286 | 0.3333 | 2 |
| 351 | 0.3333 | 2 |
| 676 | 0.1667 | 1 |
| 806 | 0.1667 | 1 |
As the shrinking factors increases, more density of states are found because more k-point are considered. As a result, instead of sharp peaks shown in Figure 3-5, the graph becomes a continuous curve. As shrinking factors reach 10, the shape of the graph started to settle, with a maximum intensity of around 0.8 at frequency of roughly 400 cm-1. When the shrinking factors are 15, the curves become smoother but the features mention remained. Comparing Figure 7 and 8, the shape and “smoothness” of the curves are similar already. If the shrinking factor is 20, the time required to compute the graph became long. Therefore, the shrinking factors of 15 is the smallest grid size that provides sufficient k-values to give the most reasonable approximation to the density of state function.
Compute Helmholtz free energy using different shrinking factors
With the GULP programme, the Helmholtz free energy of the MgO crystal at temperatures at 300K was computed using different shrinking factors. The results are shown in table 2
| Shrinking Factors | Phonon Helmholtz Free Energy (eV) | Total Lattice Energy (eV) |
|---|---|---|
| 1x1x1 | -40.9303(01) | -41.0753 |
| 2x2x2 | -40.9266(09) | |
| 5x5x5 | -40.9264(63) | |
| 10x10x10 | -40.9264(80) | |
| 15x15x15 | -40.9264(82) | |
| 20x20x20 | -40.9264(83) |
Table 2 shows that the Helmholtz free energy varies with the shrinking factors. As the shrinking factors increases, the difference in free energy with the next larger shrinking factor reduces. For example, the free energy difference between shrinking factor of 1x1x1 and 2x2x2 is 0.003692, while that between 15x15x15 and 20x20x20 is only 0.000001. This is because as the shrinking factor increases, more k-points are included in the summations in equation 9. This allows the free energy to be computed as an average of a larger sample k-points, and hence obtaining a more accurate result.
However, practically it is unnecessary to always compute with a very large sample size for it takes the computer a lot of “effort”. From table 2, the shrinking factor of 5x5x5 is sufficient for calculation with the accuracy to 1meV, i.e. to obtain the value of -40.926 eV, while accuracy to 0.5meV and 0.1meV per cell require the shrinking factors of at least 10x10x10.
In contrast, the total lattice energy remains constant no matter what shrinking factors was used. This is because lattice energy depends only o the coulombic interaction between atoms, which does not change with the grid size.
Examine how temperature changes physical properties of MgO under Quasi Harmonic Approximation
Figure 9 and 10 shows the change in Helmholtz free energy and lattice parameter of MgO at the temperature range of 0K to 1000K in steps of 100K.
 |
 |
In figure 9, the Helmholtz free energy decreases with increasing temperature. This is due to the contribution of the entropic term (TS) in the expression of Helmholtz free energy:
| (Eq.10) |
This trend suggests that entropy of the system is always positive. This is because temperature in Kelvin cannot be negative, so entropy must also be positive if free energy decreases with increasing temperature.
Figure 10 shows that the lattice parameter increases with temperature, evident thermal expansion of the MgO crystal. The linear thermal expansion coefficient is calculated using the lattice parameter measured. By converting the primitive cell volume to convention cell volume (details about this conversion will be discussed in “Compare volumes calculated using Quasi Harmonic approximation and molecular dynamics” section), the cubical thermal expansion coefficient is also calculated. Equation 11 and 12 are used to give the results in table 3, where aT and VT are the lattice parameter and conventional cell volume at temperature T.
| (Eq.11) | |
| (Eq.12) |
| Temperature (K) | Lattice Parameter (Å) | Linear α x106 (K-1) | Literature linear α x106 (K-1) | Linear α % Difference (%) | Primitive cell volume (Å3) | Cubic α x106 (K-1) | Literature cubic α x106 (K-1) | Cubic α % Difference (%) |
|---|---|---|---|---|---|---|---|---|
| 0 | 2.9866 | - | - | - | 18.8365 | - | - | - |
| 100 | 2.9867 | 0.3147 | 9.11 | 96.5 | 18.8383 | 0.9401 | 27.33 | 96.6 |
| 200 | 2.9876 | 3.1731 | 10.88 | 70.8 | 18.8562 | 9.5120 | 32.64 | 70.9 |
| 300 | 2.9894 | 5.9745 | 11.61 | 48.5 | 18.8900 | 17.9063 | 34.83 | 48.6 |
| 400 | 2.9916 | 7.4876 | 12.15 | 38.4 | 18.9325 | 22.4387 | 36.45 | 38.4 |
| 500 | 2.9941 | 8.3697 | 12.65 | 33.8 | 18.9801 | 25.0815 | 37.95 | 33.9 |
| 600 | 2.9968 | 8.9628 | 12.96 | 30.8 | 19.0312 | 26.8564 | 38.88 | 30.9 |
| 700 | 2.9996 | 9.4144 | 13.23 | 28.8 | 19.0851 | 28.2084 | 39.69 | 28.9 |
| 800 | 3.0026 | 9.8082 | 13.46 | 27.1 | 19.1413 | 29.3914 | 40.38 | 27.2 |
| 900 | 3.0056 | 10.1376 | 13.63 | 25.6 | 19.1996 | 30.3766 | 40.89 | 25.7 |
| 1000 | 3.0088 | 10.4660 | 13.77 | 24.0 | 19.2600 | 31.3629 | 41.91 | 25.2 |
All thermal expansion coefficients show the same trend—increases with temperature but increases slower at high temperatures. Yet, the magnitudes and the changes in magnitudes are very different between the computational and literature coefficients. For the linear thermal expansion coefficients, the computational values vary between 0.31K-1 to 10.47K-1, while the literature values only vary between 9.11K-1 to 13.77K-1. Similarly, for the cubical thermal expansion coefficients, the computational values vary between 0.94K-1 to 31.36K-1, whereas the literature values only vary between 27.33K-1 to 41.91K-1. Both linear and cubical computational thermal expansion coefficients are always smaller than the literature ones, and are more sensitive to change in temperature—always increases with temperature with a larger magnitude. Interestingly, the two thermal expansion coefficients have very similar percentage differences with the literature at each temperature. The percentage differences decrease with increasing temperature, suggesting that the computational method of estimating the thermal expansion coefficient of MgO is more accurate at high temperatures but very inaccurate at low temperatures in the range of 0K to 1000K.
Assumptions in Quasi Harmonic Approximation
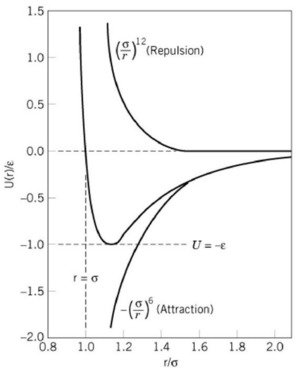
Though the Quasi harmonic approximation is useful in efficiently predicting the thermodynamic properties materials, the accuracy of its results is limited. One of the reasons for the large deviations from the literature values is because the potential used in this approximation is a purely ionic model, considering only the coulombic attraction potential [12](see Figure 11). Without the repulsion potential, the ions are assumed to have negative infinite potentials when the atomic distance approaches zero. This leads to a wrong estimate in the Helmholtz free energy, and hence the lattice parameters.
Another assumption is that the wavenumbers of the vibrations, ω, are independent of temperature and pressure because the system is considered to be harmonic. Also, because the system is described as harmonic, the wavenumber of the k-points in the Brillouin zone are inaccurate comparing to the actual wavenumbers of the anharmonic system [13].
Last but not least, the input system, which is the MgO lattice, is assumed to be a perfect crystal, without any kinds of defects. However, in reality, the crystals used in experiments cannot be a perfect crystal. They can contain defects and impurities, which may affect the thermal expansion properties of the crystal. Therefore, the accuracy of using the Quasi harmonic approximation is very limited.
Compare volumes calculated using Quasi Harmonic approximation and molecular dynamics
To compare the results from the Quasi-harmonic approximation and molecular dynamics, the primitive cell volume and supercell volumes were converted to the conventional cell volume. Conventional cell, primitive cell and supercell are only different representations of the same compound—MgO, so the density of all the cells are the same. Base on this fact, even though each cell contains different numbers of atoms, the volumes of the three cells can be converted easily by equating their densities, as shown in table 3.
| Number of Atoms | Number of MgO unit(s) | Density | Volume ratio | |
| Conventional cell | 8 | 4 | VC | |
| Primitive cell | 2 | 1 | VC=4VP | |
| Supercell | 64 | 32 | VC=1/8 VS |
Using the conversion in table 3, the primitive cell volumes obtained using Quasi harmonic approximation and the supercell volume obtained using molecular dynamics can be all converted to conventional cell volumes for results comparisons.
| Temperature (K) | Quasi Harmonic Approximation | Molecular Dynamics | ||||||
|---|---|---|---|---|---|---|---|---|
| Primitive cell volume (Å3) | Conventional cell volume (Å3) | Cubic α x106 (K-1) | % Difference with lit. value (%) | Supercell volume(Å3) | Conventional cell volume (Å3) | Cubic α x106 (K-1) | % Difference with lit. value (%) | |
| 0 | 18.8365 | 75.3460 | - | - | - | - | - | - |
| 100 | 18.8383 | 75.3531 | 0.9401 | 96.6 | 599.5133 | 74.9392 | - | - |
| 200 | 18.8562 | 75.4248 | 9.5120 | 70.9 | 600.8315 | 75.1039 | 21.9395 | 32.8 |
| 300 | 18.8900 | 75.5601 | 17.9063 | 48.6 | 603.0998 | 75.3875 | 37.6111 | -8.0 |
| 400 | 18.9325 | 75.7300 | 22.4387 | 38.4 | 604.5860 | 75.5733 | 24.5823 | 32.5 |
| 500 | 18.9801 | 75.9205 | 25.0815 | 33.9 | 605.9316 | 75.7414 | 22.2063 | 41.5 |
| 600 | 19.0312 | 76.1249 | 26.8564 | 30.9 | 608.4512 | 76.0564 | 41.4108 | -6.5 |
| 700 | 19.0851 | 76.3402 | 28.2084 | 28.9 | 610.2114 | 76.2764 | 28.8454 | 27.3 |
| 800 | 19.1413 | 76.5653 | 29.3914 | 27.2 | 612.0877 | 76.5110 | 30.6540 | 24.1 |
| 900 | 19.1996 | 76.7986 | 30.3766 | 25.7 | 613.6148 | 76.7018 | 24.8865 | 39.1 |
| 1000 | 19.2600 | 770402 | 31.3629 | 25.2 | 615.8309 | 76.9789 | 35.9862 | 14.1 |
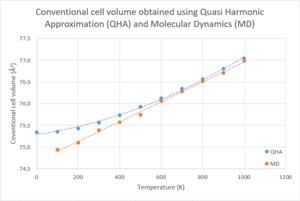
According to Figure 12, using molecular dynamics, the cell volume shows a linear relationship with the temperature in the range of 100K to 1000K, while this relationship only holds in the temperature range of 600K to 1000K in the results obtained using Quasi harmonic approximation. Yet, results show that the cell volume computed using these two methods are very similar—the difference of the conventional cell volumes at each of the temperatures is always less than 0.5Å3. Especially when temperature is up to 600K, difference is less than 0.1Å3.
However, the thermal expansion coefficient calculated using molecular dynamics lost the increasing trend with temperature. The magnitude of the volume increase is unpredictable because it shows no trend with temperature. Although the results obtained using molecular dynamics have similar magnitudes and a generally smaller percentage differences with the literature values comparing to that obtained using Quasi harmonic approximation, the results computed fluctuate around the literature value—it can be larger or smaller than the literature value.
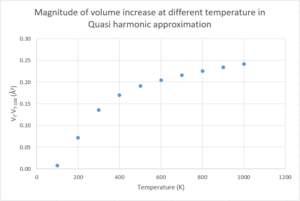
The reason for the differences is because in molecular dynamics, temperature is used to compare with the temperature of the system at certain energy level. Yet, it does not contribute to any calculation process. Therefore, in molecular dynamics, the volume of the crystal expands as temperature increases, but the magnitude of increase has no correlation to temperature (see Figure 13). As a result, the thermal expansion coefficient, which contains a term of the change in volume with respect to temperature, does not correlate to temperature either. In contrast, in Quasi harmonic approximation, the Helmholtz free energy of the system is computed with consideration of the temperature input (refer to equation 9). This gives a temperature dependence to the volume of the crystal computed and the magnitude of volume increase. Therefore, the Quasi harmonic approximation results in a positive trend in the change in volume with respect to temperature (see Figure 14).
Conclusion
In this exercise, the thermal expansion coefficients of MgO crystal in the temperature range of 0K o 1000K in steps of 100K were computed using quasi harmonic approximation and molecular dynamics respectively. In short, quasi harmonic approximation treats the vibration of MgO lattice as a harmonic oscillator to allow the Helmholtz free energy to be determined. For Helmholtz free energy is a function of volume, the cell volume of MgO is computed at different temperatures. Molecular dynamics make use of the ergodic hypothesis on the other hand. Without assuming an anharmonic system as a harmonic system, molecular dynamics determines the cell volume of MgO at different temperature by time-averaging. Although the two approaches give very similar cell volumes as results, the thermal expansion coefficients were very different, both in magnitude and trend. In quasi harmonic approximation, temperature is required in the calculation of Helmholtz free energy, leading to a temperature dependence in the change in volume with respect to temperature. In molecular dynamics, the computation process does not involve temperature in the calculation. As a result, the thermal expansion coefficient also shows no dependence on the temperature. When comparing to literature values, it is found in literature that there is a temperature dependence in the thermal expansion coefficient of MgO. Quasi harmonic approximation resulted in the positive relation between thermal expansion coefficient of MgO and temperature, which is consistent with the literature trend, but the magnitudes of the thermal expansion coefficients are inaccurate. Result from the molecular dynamics approach did not show any relation between thermal expansion coefficient of MgO and temperature, but the magnitudes of thermal expansion coefficients obtained are all in same order to the literature values. The deviations from literature values originated from all the assumptions made in the methods. The assumptions made in quasi harmonic approximation was particularly discussed, including the simplification in the ionic potential model, independence of the wavenumber to temperature and pressure, and absence of defects in the MgO crystal.
Reference
<references>
Template loop detected: Template:Reflist
- ↑ P. Atkins and J. de Paula, in Atkins’ Physical Chemistry, Oxford University Press, 10th edn., 2014, pp. 93
- ↑ Oliver M., Cranford S. Small-scale Interactive Molecular Simulation, http://web.mit.edu/mbuehler/www/SIMS/Thermal%20Expansion.html (accessed February 2017)
- ↑ Dove, M.T. ‘The harmonic approximation and lattice dynamics of very simple systems’, in Introduction to Lattice Dynamics:. Cambridge: Cambridge University Press, 1993, pp. 18–35.
- ↑ G. Mallia, Introduction to Computational Laboratory [PowerPoint slides], 2016, http://www.ch.ic.ac.uk/harrison/Teaching/Thermal_Expansion/Introduction.pdf (accessed February 2017)
- ↑ G. Mallia, Introduction to Computational Laboratory [PowerPoint slides], 2016, Retrieved from http://www.ch.ic.ac.uk/harrison/Teaching/Thermal_Expansion/Introduction.pdf
- ↑ Dove, M.T. ‘Molecular dynamics simulations’, in Introduction to Lattice Dynamics:. Cambridge: Cambridge University Press, 1993, pp. 179–194.
- ↑ C. Oliveira, T. Werlang, Ergodic hypothesis in classical statistical mechanics, Revista Brasileira de Ensino de Fisica 29 (2) , 2007, pp.189–201.
- ↑ Science and Technology Facilities Council, http://www.cse.clrc.ac.uk/cmg/DLV/ (accessed February 2017)
- ↑ Curtin University, http://gulp.curtin.edu.au/gulp/ (accessed February 2017)
- ↑ Austin, J. B. Journal of the American Ceramic Society, 1931, vol. 14, pp. 798
- ↑ what-when-how, http://what-when-how.com/molecular-biology/van-der-waals-interactions-molecular-biology/ (accessed Feb 2017)
- ↑ A.R. Oganov, J.P. Brodholt, G.D. Price, Comparative study of quasiharmonic lattice dynamics, molecular dynamics and Debye model applied to MgSiO3 perovskite, Phys. Earth Planet. Inter., 122 (2000), pp. 277–288
- ↑ R. Ramirez, N. Neuerburg, M. V. F. Sierra, and C. P. Herrero, J. Chem. Phys. 137, 044502 (2012). https://doi.org/10.1063/1.4737862
- ↑ Austin, J. B. Journal of the American Ceramic Society, 1931, vol. 14, pp. 798

