
Rep:MgO GE715
Introduction
Magnesium oxide is a white solid that is has low electrical and high thermal conductivity and retains its strength and is both physically and chemically stable at high temperatures, making it a useful as a refractory.[1] This property makes magnesium oxide appropriate for a study of thermal expansion of an ionic solid on a large range of temperatures. It has the face centered cubic cell structure.
Thermal expansion can be quantified in a thermal expansion coefficient, which is a change of volume with temperature, but independent of the initial volume.
Thermal expansion of a specific material has to be taken into consideration when building large structures or structures that will be exposed to a large range of temperatures and experimental determination of the value of thermal expansion can be expensive, impractical and inaccurate, thus computational methods offer a good alternative.
The value of the constant can be estimated using numerous computational techniques, with one of the approaches being optimization of free energy at a range of different temperatures and using quasi-harmonic approximation of lattice dynamics to compute average lattice parameter at a specific temperature to be able to approximate the thermal expansion coefficient for a certain temperature range.[2] The other approach is the use of molecular dynamics calculations, which estimates the lattice parameter for a temperature by studying the motion of the atoms in the lattice.
Theoretical method and computational details
We calculated the thermal expansion coefficient using the quasi-harmonic approximation for the minimization of free energy using lattice modelling code GULP (General Utility Lattice Programme) in DLVisualize software for RedHat Linux, which uses symmetry properties of crystal structures to help compute the ideal separation of specific atoms (where the free energy is the lowest) and thus determine lattice parameter. This is done by considering the vibrational properties of magnesium oxide (its phonons). The software analyses the primitive cell of magnesium oxide for all its vibrations. The experiment was performed at different temperatures and the results were used to estimate the thermal expansion coefficient over a large range.
The similar process was then repeated using the same software, but with the molecular dynamics calculation, which computes the average lattice parameter using the simulation of the movement of particles in the lattice. This experiment is done by considering a supercell of magnesium oxide, since the movement needs to be analysed having more atoms to obtain a better average.
Results and discussion
Density of states
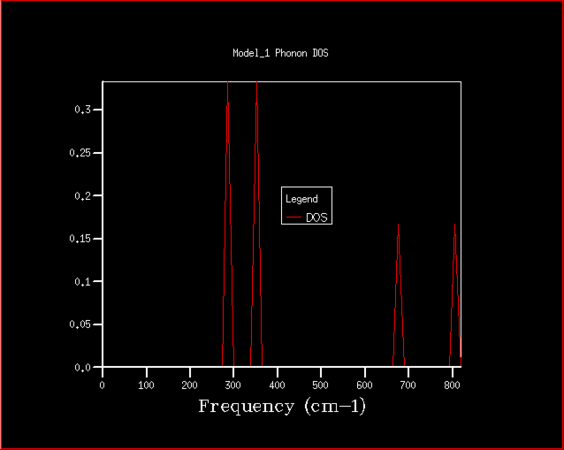
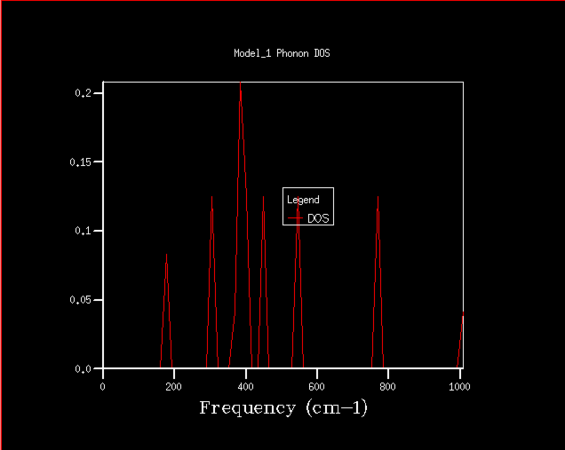
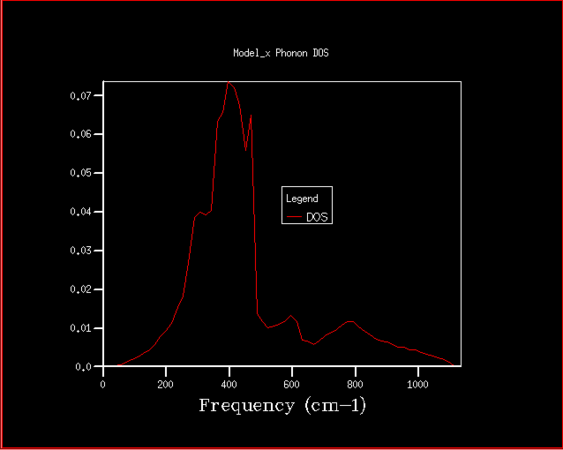
Firstly, the phonon density of states has been studied with the purpose of determining the best shrinking factor (size of grid) to use in the future experiments. The estimate was done visually, as well as using the zero point energy calculated in the process. The density of states curve becomes smoother with higher shrinking factor, while its features become more apparent and clearer, as is shown in the graphs below.
-
 1x1x1
1x1x1 -
 2x2x2
2x2x2 -
 4x4x4
4x4x4 -
 8x8x8
8x8x8 -
 16x16x16
 -
 32x32x32
 -
 64x64x64


| Shrinking factor | Zero point energy [eV] |
|---|---|
| 1 | 0.172063 |
| 2 | 0.174209 |
| 4 | 0.174339 |
| 8 | 0.174340 |
| 16 | 0.174340 |
| 32 | 0.174340 |
| 64 | 0.174340 |
There is significant improvement in smoothness and in distinctions of features over the first few steps, while at higher grid sizes the improvement slowly becomes comparatively smaller, especially given the disproportional increase in computing power required to finish those high resolution jobs. After the consideration of both the visual factors and the differences in calculated zero point free energy, it was decided that shrinking factor of 32 in every direction is the best, since at this grid size the density of states is fairly clear, but the time required for computation is not yet excessive. Even shrinking factors of 16 would likely give relatively good results. In comparison to shrinking factor of 16 the curve for 32 appears much smoother, with less rough peaks, while in 64 we can see the specific peaks slowly becoming more distinct.
Magnesium oxide represents a fairly simple system with just two different kinds of species and very symmetrical structure, which is why it is relatively simple to model. This could be easily transferable to similar species, such as calcium oxide, which has the same structure, thus a shrinking factor of 32 would be a good fit. With larger structures there is a degree of additional complications, since there are more interactions to consider, which means more computing power would be needed for zeolites, but also all the features would very likely not begin showing at lower shrinking factors, so such crystal structures are likely much harder to model. On the other end of the spectrum there is lithium, which has structure that is simpler still, but the interactions within lithium metal are not that easily comparable to that of magnesium oxide, since there are electrons that are practically freely moving between lithium atoms to consider. Speculatively, however, even a lower shrinking factor might suffice for faithful modelling of lithium metal.
Free energy calculations (harmonic approximation)
Helmholtz free energy analysis was performed with the same series of shrinking factors, the results are shown in table below.
| Shrinking factor | Helmholtz free energy [eV] | Δ [eV] |
|---|---|---|
| 1 | -40.930301 | -0.003813 |
| 2 | -40.926609 | -0.000126 |
| 3 | -40.926432 | -0.000051 |
| 4 | -40.926450 | -0.000033 |
| 8 | -40.926478 | -0.000005 |
| 16 | -40.926482 | -0.000001 |
| 32 | -40.926483 | 0.000000 |
| 64 | -40.926483 | 0.000000 |
This shows that the energy with shrinking factor of 32 is indeed within 1 μeV of the real value. The calculations quickly converge to the final value, with the uncertainty when using 1x1x1 grid being less than 4 meV, but in the case of 2x2x2 grid already just slighly above 0.1 meV, thus it is appropriate to use 2x2x2 grid for any calculation where the necessary level of accuracy is within 0.2 meV, while 3x3x3 is already enough for 0.1 meV. All the discrepancies are shown in the table above. It is unlikely that we would see any further change at higher shrinking factors given the data we have. Again, this should be easily transferable to structures such as that of calcium oxide, but harder to zeolites and lithium, for the reasons similar to already explained in the previous section.
Thermal expansion coefficient (quasi-harmonic approximation)
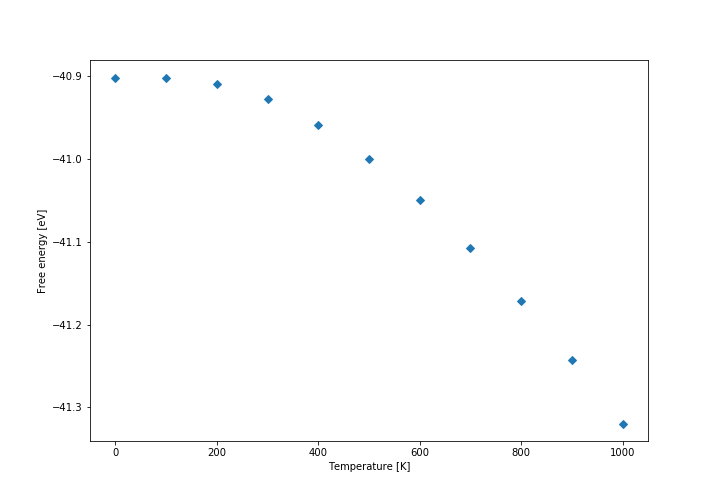
Firstly, the free energy diagram (shown below) and the lattice parameter diagrams were analysed. It was found that at low temperatures the thermal expansion is not linear, while at above approximately 300 K the expansion coefficient becomes practically constant, so we decided to calculate it above that temperature. The linear fit to the data is shown in the graph below. The initial volume was taken at 300 K. The conventional cell volume has been used. The curves are not linear, but they are close enough approximation so that we can assume they follow linear expansion. Another approximation is that expansion actually follows quasi-harmonic approximation at all, because otherwise our model could be wrong entirely. It also assumes that the expansion is relatively constant on a relatively large temperature range (300 K - 1000 K).
-
 Free energy
 -
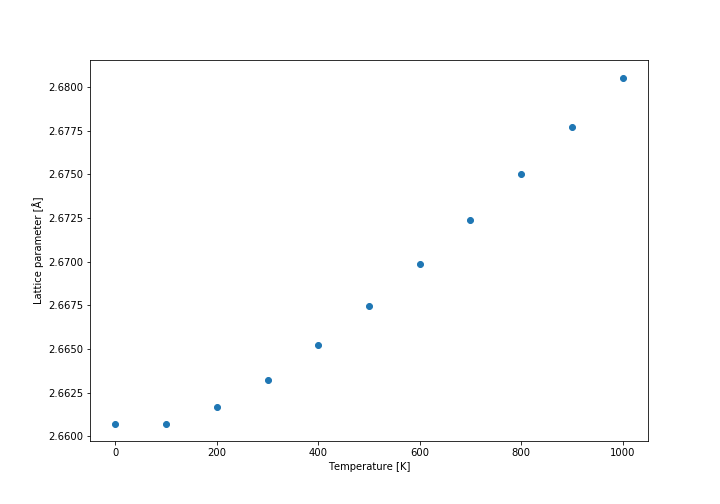 Lattice parameter (primitive cell)
 -
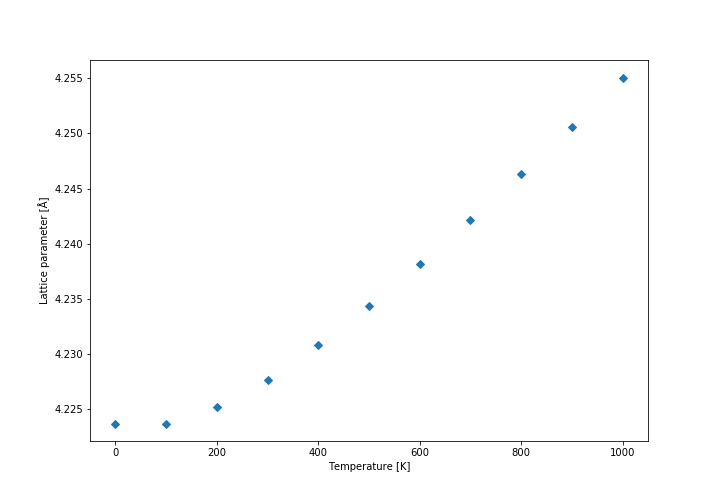 Lattice parameter (conventional cell)
 -
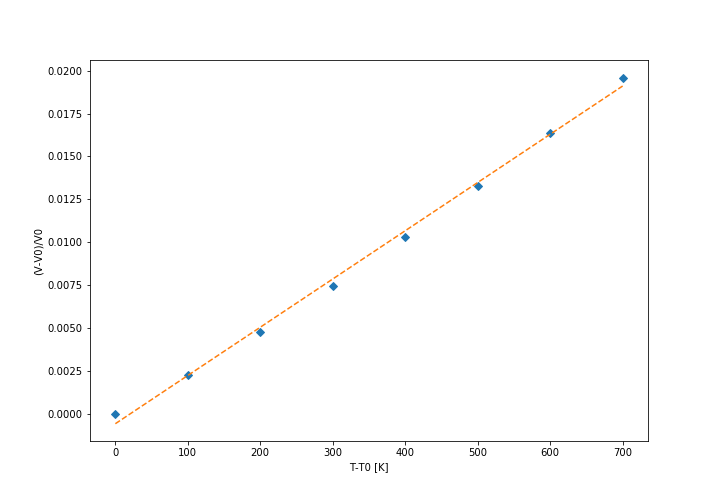 Thermal expansion coefficient calculation (conventional cell)


At low temperatures the thermal expansion coefficient and free energy are not linear, which means that if the model is correct, there has to be some kind of internal rearrangement that changes entropy of the system at low temperatures. The other option is also that some of the higher energy states (vibrational) are not yet accessible, and thus the internal energy is not yet linear with respect to temperature (as it would be in ideal system high above the characteristic temperature required to reach higher energy states). The latter option would also make sense in terms of the average lattice parameter, which grows with the number of accessible higher vibrational energy states.
The calculated thermal expansion coefficient is . The literature value is , but this is a value for linear thermal expansion coefficient, which is a third of the value for volumetric expansion that was calculated in this experiment, thus the literature value for the same quantity is [3], thus placing the computed value close to literature value, especially considering how large range of temperatures was used. The literature value will also be somewhat different owing to the fact that it was measured at 273 K. Nevertheless, this value is comparable to high melting point metals such as steel and platinum.
Thermal expansion happens in large part due to anharmonic nature of the vibrational levels in substances. As higher temperature is reached, more species can access higher vibrational levels and thus the average distance between atoms (bond length in molecules) increases. As the temperature increases, the phonons become less precise, since some of the forces between the constituents often become more labile, when approaching melting point.
It is important to note that the use of quasi-harmonic approximation is essential, since the higher vibrational states in harmonic approximation have the same average bond length and thus this will not vary depending on which states are occupied and thus on the temperature itself.
Molecular dynamics measurements
The thermal expansion coefficient has also been determined using a molecular reaction dynamics calculations, which analyses movement of atoms at a specific initial temperature and computes the average cell volumes and lattice parameters after running simulation for a set period of steps. The number of production steps and equilibration steps used was 5000, and the time interval set 0.1 fs, since the proposed values gave somewhat ambiguous results with high fluctuations in temperature. The comparison with quasi-harmonic approximation calculation was made and MD has consistently somewhat lower volume of cell, while thermal expansion coefficient is slightly larger, but differs almost insignificantly at . This comparison, as well as the exact differences are shown in graphs below.
-
 Conventional cell volume for QHA and MD
 -
 Comparison of conventional cell volume for QHA and MD (QHA-MD)
 -
 Thermal expansion coefficient calculation (QHA vs MD)


None of the models used are ideal, since we had to constrain our systems due to limited computational power, which is why the results of both experiments differ somewhat. It is likely that MD experiment in particular is suffering by the virtue of the fact that the supercell used might have been too small. If bigger cell were used, the results would probably be more representative of reality, but the computational power needed to double the size in every direction would be substantial. There doesn't seem to be a very fixed variation in relation between QHA and MD results.
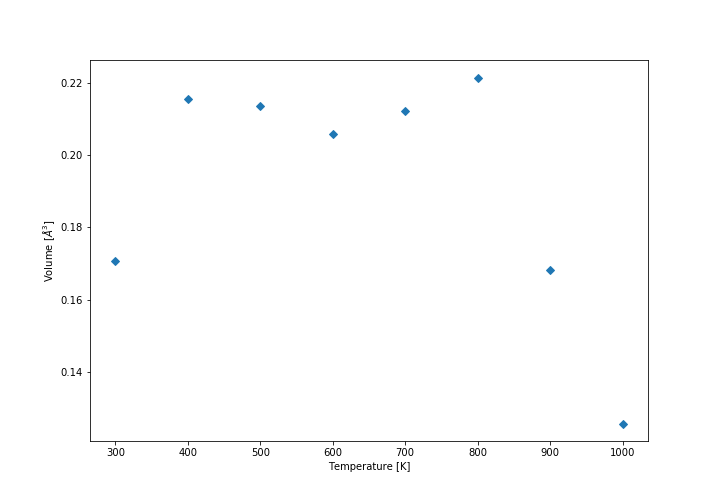
If the temperature is further increased up to the proximity of melting point, the models begin to break down, in the case of QHA some of the computations were not finished at all, but it breaks down more gradually, but in case of MD there is a very sudden increase in cell size that eventually levels off, but does not match reality anymore. This is in large part due to the lability of the system at high temperatures, especially when approaching melting point (3098 K) and because the model is not equipped to deal with the interactions that would afterwards occur in a liquid state, where the crystalline structure breaks down. The obtained results at high temperatures are shown in the graph below.
-
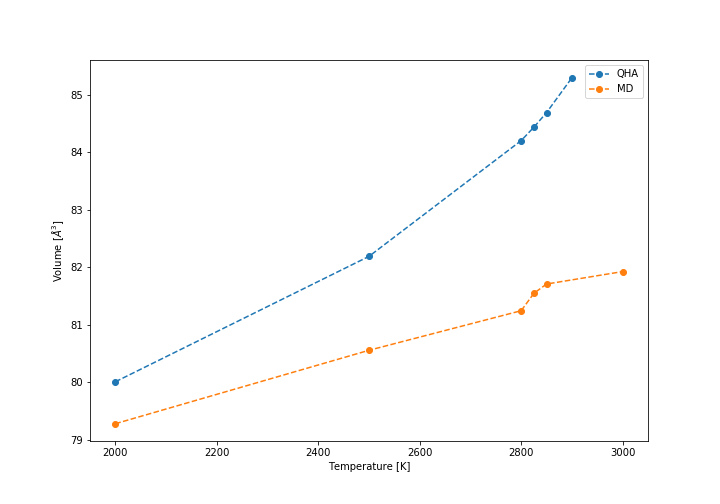 Breakdown of the models at high temperatures (volume of conventional cell)

Conclusions
This is a study of thermal expansion coefficients using GULP with two different methods, using quasi-harmonic approximation and molecular dynamics. Results broadly comparable to practical literature can be reproduced at a wide range of temperatures (at least 700 K) using both methods, but the models have weaknesses, such as breakdown at higher temperatures and the need to adjust the quality to conserve computational power.
References
- ↑ Mark A. Shand (2006) The chemistry and technology of magnesia, John Wiley and Sons
- ↑ Dove, Martin T. (1993). Introduction to lattice dynamics, Cambridge University Press.
- ↑ Crystan (2017). Magnesium oxide (MgO), https://www.crystran.co.uk/optical-materials/magnesium-oxide-mgo