Rep:MgO - OHC15
Computational Calculation of MgO Free Energy and Thermal Expansion
Abstract
Thermal expansivity of MgO was evaluated under Quasi-harmonic approximation (QHA) using a 2-atom primitive cell and molecular dynamics (MD) using a 64-atom cell in temperature range from 0K to 3000K. Optimal grid size for MgO QHA calculation was determined to be 32x32x32 where free energy is converged and gave a smooth density of states plot. Expansion coefficients of and obtained agree closely with literature value of [1] from 300K to 1300K. MD was found to be a better calculation method over a wider temperature range, while QHA break down at temperature approximately greater than 2000K.
Introduction
In the study of lattice dynamics, atoms are noted to be vibrating about their equilibrium position, even at absolute zero temperature. These vibrations in solid crystals are correlated to many important physical principles characteristic of the lattice, for instance, bond length, heat capacity, thermal conductivity, thermal expansivity and free energy. Therefore, being able to understand and obtain a mathematical description of atom vibrations would be extremely helpful in research to provide quick insight to lattice behaviour. In this experiment, calculations were performed on MgO (fcc) crystal using Quasi-Harmonic Approximation and Molecular Dynamic methods. Results of both calculation mechanism are analysed in the 'Results and Discussion' section.
Lattice Dynamics - Vibration in Solid Crystals
Vibrations are sometimes called phonons, due to its wave-particle duality property in the language of quantum mechanics. Phonon interacts with particles by propagating in the form of travelling waves through lattice via the presence of a repulsive interaction between atoms, which is usually modelled as a spring between 2 masses under Harmonic approximation and nearest-neighbour interaction condition. The force of such interaction is defined by the harmonic force constant, , analogous to ‘spring constant’. A vibration mode has its characteristic wavevector, , wavelength , where , and frequency . The number of vibration modes increases with the number of atoms in the system. Therefore, in an infinite ionic crystal, continuum of vibrational modes, aka branches, are observed. The characteristic wave vector and frequency allow each vibrational mode to be presented in terms of its normal modes under Fourier transform in the reciprocal space. An example would be the graph of , and thus the energy, in reciprocal space, which is also known as a dispersion curve. The equation of as a function of is:
On the dispersion curve, each branch represents the band of vibrational modes in the crystal. The number of branch on the dispersion curve is given by the product of dimensionality and number of different atoms in the lattice. In the case of MgO, branches is expected. Usually only the first Brillouin zone, in the range of , is displayed as the equation of motion of a second wave in the repeated second Brillouin zone is identical to that of the original wave. The repeated Brillouin zone would become useful for investigation in anharmonic interactions and neutron scattering.
Among the branches of vibrational modes in a system, atoms give number of equations of motion per dimension of the system. Vibration modes with atomic displacement in the direction parallel to the wave vector are known as longitudinal modes. The other 2 sets of vibrational modes with atomic displacement in the 2 orthogonal directions are known as transverse modes. These branches are further categorised as acoustic and optic vibrations. Acoustic vibration mode is characterised by a dispersion curve that converges to zero in the limit of small . Meanwhile, optic mode is characterised by the fact that it has a frequency lying in the optical region of electromagnetic waves, typically in the infrared region of 1-30THz.[3] Analysis of vibration mode degeneracy for a certain wave vector on the dispersion curve could provide geometry symmetry information of the crystal.
As energy is a function of frequency, the sum of all vibration branches, at all different wave vector points gives the free energy contribution of these vibration modes. The Helmholtz energy is given to be:
Where is the lattice energy. The second term in equation 3 is the sum of all ground state energy of vibrational states occupied, while the third term is the entropic term, depending on the probability of all accessible states being populated using Boltzmann distribution.
Phonon density of states is the number of states per unit frequency. It is a normalised plot show-ing the fraction of all sampled phonon states that at each frequency value at specific space points determined by size of shrinking factor.
Quasi-Harmonic Approximation
Quasi-Harmonic approximation is an approximation built upon harmonic approximation and nearest-neighbour interactions conditions. The major assumptions are 1) small atom displacements about its equilibrium position and 2) only interactions with neighbour atoms within the cut-off sphere are considered. In harmonic approximation, Taylor expansion about the equilibrium position is applied to approximate the harmonic energy of system up to the second derivative term. The first derivative of potential energy is zero at equilibrium unit cell length, leaving the harmonic energy equation with only the dominating second derivative term of the converging series. This approximation is representative enough to explain most physical properties, but not thermal expansion of crystal solid. This is because properties like thermal expansion involves the anharmonic shifting of equilibrium position to values greater than zero, resulting in volume expansion. In Quasi-Harmonic approximation, anharmonic corrections modified the free energy equation under harmonic approximation by including the volume dependence of phonon frequency, giving the QHA Helmholtz Free energy equation:
Although anharmonicity of higher-energy phonon states are covered in QHA, the approximation would fail at high temperatures. Stronger vibrations at high temperatures result in erratic motion of atoms in the crystal, where bonds are lengthened to region beyond the cut-off sphere. Especially at temperatures near phase transition, simulations in this temperature rergion would not give meaningful rersults as aproximation 1) would no longer holds. Bond break during phase transition lengthens internuclear distance between atoms beyond the cut-off sphere and this kind of interactions would be neglected automatically during calculation.
Molecular Dynamics
Noting that QHA does not provide a full explanation to thermal expansion at temperatures near to and beyond the melting point. Molecular dynamics is a better alternative that gives reasonable thermal expansion predictions even at high temperatures. In this model, the regular packing structure of lattice no longer exists. Atoms in the lattice can translate through each other and collide elastically. Lattice model is initially set to the provided conditions and allowed to evolve with time under Newtonian mechanics. The Verlet algorithm is used to calculate position and velocity trajectories of atoms every timestep from its old position and velocity in the previous step in the lattice for the number of set equilibration and production step. Once euilibriation steps are copmleted, lattice properties (cell parameters, volume, pressure, kinetic energy, potential energy, temperature and total energies) are reported in each production steps and averaged. Converged average energy and temperature of system acts as an indicator to whether the system is well-equilibriated to produce accurate results.
Thermal Expansion
Thermal expansion (or contraction) is the tendency of a material to undergo volumetric change in response to temperature change. Normally materials would expand as temperature increases, however, material contraction with temperature rise is possible. Generally, temperature increase would result in the increase in the average internuclear separation between atoms in the material. This is caused by phonon excitation to higher energy phonon levels, where anharmonic effect comes into play, shifting the equilibrium position of atoms to greater than zero. This temperature dependence of a material is quantified by the thermal expansion coefficient, , which is defined as:
This is an extensively useful indicator to evaluate the suitability of a material to be used for certain purpose where inevitable temperature variation is involved. In reality, long experimental time and extreme environment conditions, like high pressure and high temperatures, made the execution of experiment and the data collection process difficult. With the aid of the mathematical models described above, an alternative pathway is available to gain insights to thermal expansivity of newly developed materials in research from computational predictions, fast-tracking the development process.
Experimental
In this experiment, vibration modes of MgO crystal and its energies were calculated on a graphical user interface, DLVisualize, using the molecular mdelling code General Utility Lattice Program (GULP) in RedHat Linux environment. These information was then used to obtain Free Energy of the crystal for prediction of thermal expansitivity of the lattice.
All simulations carried out under constant zero pressure condition using ionic.lib force field model with Include Shells option de-selected on the GULP Potential parameters panel. Under this setting, calculations were performed on crystal using Buckingham repulsive potential between a simplified +2e charge Mg ion and a -2e O ion. Include Shells setting is useful in allowing the study of polaristion of the system, but this is not considered in the experiment.
A rhombohedron primitive unit cell of MgO crystal was used in most calculations, while a 32-primitive cell unit supercell was used for molecular dynamic simulations.
Phonon Dispersion and Density of States Calculation of MgO
Phonon properties, including the dispersion curve and density of states, were investigated at 0K. Phonon dispersion shows the frequency of each vibrational mode at wavevector k. The phonon dispersion plot of 50 k points in the First Brillouin Zone (FBZ) was obtained and compared with literature results. Density of states is the counts of number of vibrational modes at each frequency . Both calculations were performed using a 1x1x1 grid size.
K-Space Grid Sizes and Free Energy
In addition to the 1x1x1 grid size, other k-space grid sizes (i.e. 2x2x2, 3x3x3, 4x4x4, 5x5x5, 6x6x6, 8x8x8, 16x16x16, 32x32x32 and 64x64x64) at 300K were performed to see its effect on density of states within the Quasi-Harmonic approximation. Helmholtz-free energy values of MgO at each grid size was analysed. 32x32x32 grid size was determined to be an appropriate grid size, where the balance between accuracy and computational time is best suited for the rest of the experiment.
Thermal Expansion Calculation of MgO
Gibbs-free energy optimisation was calculated using 32x32x32 grid size at temperatures ranging from 0K to 2900K every 100K under Quasi-harmonic approximation. Lattice constant and free energy values of primitive unit cell were plotted against temperature. Lattice constant was further used to obtain linear thermal expansion coefficient of MgO crystal.
Molecular Dynamics Calculation of MgO
Molecular Dynamic method was applied to calculate averaged crystal properties of a 32-MgO unit superecell in the NPT ensemble (fixed particle number, external pressure and temperature) at temperatures ranging from 100K to 3000K in step of 100K. Simulations were set to perform at time step of 1.0 femtoseconds, Equilibration steps and Production steps both to be 500. Sampling steps and Trajectory write steps were set to 5. Averaged values of energies and lattice volume at varying temperratures were analysed. Volumetric thermal expansion coefficient of MgO was obtained from the lattice volume against temperature plot and compared with results of the previous section using Quasi-harmonic approximation.
Futher work was performed to reduce fluctuations in thermal expansion coefficients at high temperatures by increasing Equilibration steps and Production steps both to 700 and 900.
Results and Discussion
Phonon Dispersion and Density of States
 |
 |
6 vibrational bands were observed in the dispersion curve above for our 2-atom primitive cell agreeing with our expectation of branches. These 6 vibrbational bands consist of 3 acoustic and 3 optical branches, as identified in the phonon dispersion plot.The phonon dispersion curve follows a k-space path going from in the FBZ. The actual frequency values and coordinates in the reciprocal k realm of the points marked on the curve could be found in the log file by matching the number of degenerate and non-degenerate states and their approximate values base on the dispersion curves as shown below.
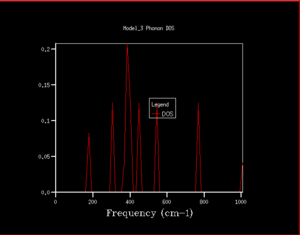
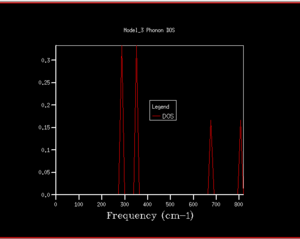
Figure 3. combined the phonon dispersion plot with the density of states using a 1x1x1 grid size. This indicated that the DOS obtained corresponds to on the dispersion curve. Peak intensity at 288.49cm-1 and 351.76cm-1 are twice of that at 676.23cm-1 and 818.82cm-1 showing the presence of degenerate phonons.

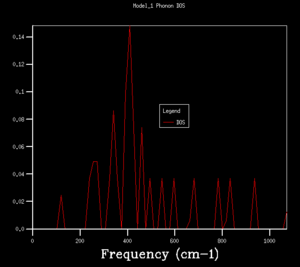
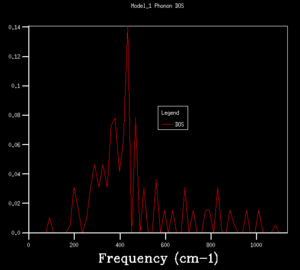
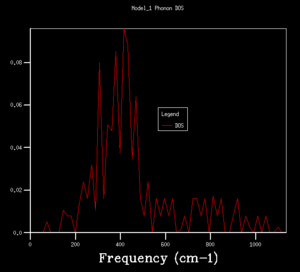
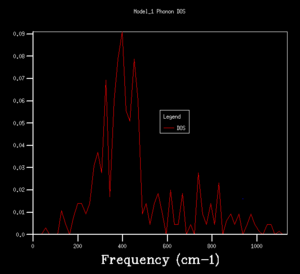
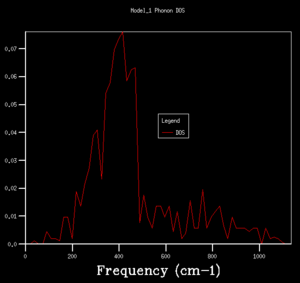
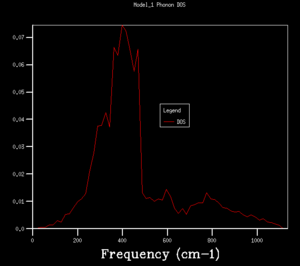
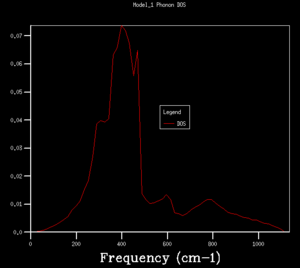
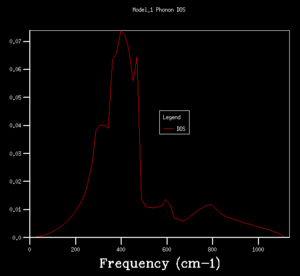
DOS copmuted at larger grid size were observed to have better resolution. Spikey peaks start to join together and become broader as grid size increases. A continuous spectrum start to emerge as grid size increase from 8x8x8 to 16x16x16. Larger shrinking factor/ grid size essentially increasees the number of k-space points visited within the FBZ and thus giving more representative DOS, where phonon distribution at intermediate frequencies become observable. Further increasing the shrinking factor to 32x32x32 gives a much smoother curve with similar shapes as that at grid size of 16x16x16. DOS of 64x64x64 grid size has barely any difference from the one at 32x32x32, showing that DOS is representative enough at 32x32x32 level. Regarding the time of calculation, higher grid size does take longer time for calculation to reach completion. Comprimising between accuracy and calculation time, 32x32x32 is the most appropriate grid size to give high resolution DOS while the computaional time lies within a mintue. 64x64x64 is not a practical grid size to use as one calculation could take up to 15-25 minutes and the improvement in accuracy is not significant enough.
Helmholtz-Free Energy (Quasi-Harmonic Approximation)
Effect of Grid Size on Helmholtz-Free Energy
From the DOS analysis above, energy difference decreases greatly with increasing shrinking factor. It is noted that the shape of DOS plot converges with increasing shrinking factor and does not change much as shrinking factor increases from 32x32x32 to 64x64x64, thus, concluding that 32x32x32 is the optimal grid size for later calculations. The Helmholtz-Free energy values resulted from calculations at each different grid sizes tested in the previous section were listed in the table below. Energy values were found to converge to a value of -40.926483 eV (to 6 decimal places)with increasing grid size. The converged free energy value was first obtained at 32x32x32 level, supporting the conclusion that 32x32x32 is the optimal grid size for MgO, where calculations are accurate to 1 micro-eV. Depending on the level of precision required for the purpose of the experiment, lower grid size level might be better fit as they are less computationally demanding. Grid size 3x3x3 is suitable for calculation accurate up to 1 meV as well as 0.5 meV, while for accuracy up to 0.1 meV a grid size of 4x4x4 would be needed.
If we consider other species, the optimal grid size of 32x32x32 might no longer be applicable. For an ionic compound similar to MgO, like CaO, it is expected that the optimal grid size would not be too far off from 32x32x32 although CaO has a slightly larger internuclear distance and thus larger lattice parameter than MgO. It is reasonable for a lattice species with larger lattice parameter to have a smaller reciprocal k-space containing less k points in its FBZ (i.e. ). Thus, for compounds of metals with much smaller ionic radii, like lithium, would require a much bigger grid size to accommodate a representative number of k points, in order to reach the same level of accuracy in lattice property calculations. Vice versa, for ionic compounds with larger lattice parameter (e.g. a Zeolite), a smaller grid size is expected to yield same level of accuracy as the population of k points is smaller in a smaller FBZ.
Temperature dependence
Helmhotlz-Free Energy values collected from simulations performed using 32x32x32 grid size on a MgO primitive unit cell every 100K from 0K to 2900K were plotted in Figure 13. In general, Helmholtz-free energy values get increasingly negative with temperature . It is noted that the trend started off exponentially. However, as temperature further increases, the non-linear temperature dependence of Helmholtz free energy becomes linear. This trend satisfies the equation of Helmholtz-Free Energy (Equation 4).

Comparison of Thermal Expansion Results of Different Methods
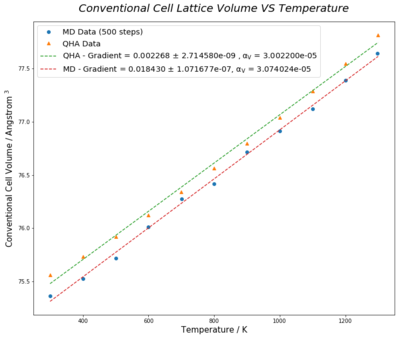
Lattice volumes of 2-atom MgO primitive cell calculated under Quasi-Harmonic Approximation (QHA) were multiplied by 4 to convert to 8-atom conventional cell unit, whereas, that of the 32-primitive cell unit supercell in molecular dynamic method is reduced by a factor of 8, so that results from both methods are comparable in conventional cell unit. Molecular dynamic calculation cannot be executed at zero kelvin as atoms in lattice has zero kinetic energy at 0K. In general, both methods show a trend of increasing cell volume with temerature. However, the rate of increment under QHA initially increases at low tempereature, then slows down in the region of 300K to 1300K. As temperature further increases, cell expansion grows more rapily.(Figure 14.)
Under QHA, temperature rise leads to volume expansion of lattice to minimise Free Energy of system, which lowers vibration frequencies due to larger lattice parameter. This narrows the energy gap between vibrational states as energy of phonon modes, , is lowered. This results in high energy phonon modes being more easily populated, leading to even greater atom displacements from equilibrium positions and bigger cell volumes. Near the melting temperature of approximately 3100K, QHA no longer give a true representation of the reality as some atom displacements would exceed the cutoff value due to bond break and these interactions between those atoms would not be taken into consideration during calculation. Therefore, temperature investigation of lattice volume was stopped at 3000K.
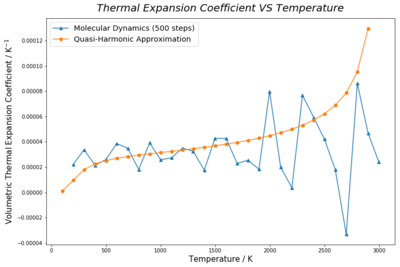
On the other hand, results of molecular dynamic method show a relatively linear correlation between cell volume and temperature. Figure 16. shows random fluctuations in expansion coefficients with temperature. Flulctuations are more vigorous at higher temperatures. This is due to insufficient time for lattice properties of the 64-atom supercell model to reach equilibrium and converge. Improvement on such issue is further discussed below (Figure 17&18).

Using the lattice volume data, the volumetric thermal expansion coefficients of QHA and molecular dynamic method from 300K to 1300K were found to be and respectively, using the equation:
where is the initial volume and were taken as the lattice volumes at 300K for both methods. Both experimental expansion coefficient values agree with the literature [1] at 300K. This temperature range was selected as the increment in thermal expansion coefficient with temperature is the least significant in this region. (Figure 16.) The almost zero standard deviations of best fit line gradients of lattice volumes from 300K to 1300K supports that the simplification is a valid approximate of the partial derivative, .
 |
 |
Extension
As discussed above, random fluctuations in expansion coefficients at high temperature under molecular dynamic method were significantly large, showing that lattice properties were not converged under the settings described in the experimental section. The most direct measure to resolve this issue would be to increase time allowed for equilibration. This could be done by raising the number of Equilibriation step. Increasing Production step would also improve relability of averaged data by reducing the effect of non-equlibrated data on the final averrage. Both settings were changed to 700 and 900 steps for investigation. Experimental data showed that the volume -temperature plot is less bumpy for larger step length. The difference between the highest and lowest expansion coefficent decreases as length of Equilibriation step and Production step increases from 500, 700 to 900. This proves that the great fluctuation in expansion coefficient at high temperatures correlated length of allowed time for equilibration and obtaining more averaging steps. However, longer Equilibriation step and Production step increases the calculation time for each simulation to end. A better solution would be just lengthening the number of Equilibriation step, so that less rounds of lattice volume and energy calculations would be performed on non-equilibrated state of the lattice.
 |
 |
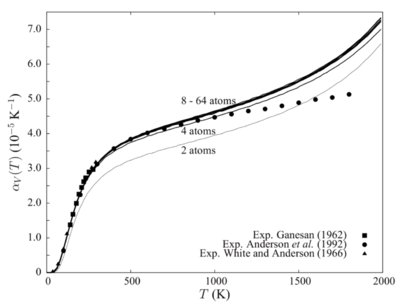
The convergence of lattice properties were found to be correlated to the size of supercell used in the simulation. Although Figure 19. [4] shows results obtained under Quasi-Harmonic approximation, it illustrates that increase in supercell size converges lattice properties, like free energy and thermal expansion coefficient. The idea is similar to having larger grid size, greater number of atoms in a larger supercell provide larger sample size and yield better averaged values, especially in the context of molecular dynamics. Simulation calculations are based on the relative motion of atoms in the model. Take a 2 atom and a 64 atom system as an example, where both systems are initiated by the movement of one atom due to an external force. The effect of such movement on the whole system would be much profound in a smaller cell, thus, giving less representative prediction of lattice properties.
Conclusion
Quasi-harmonic approximation is derived from harmonic approximation with anharmonic effect accounted for, while molecular dynamics follow atom trajectories in the equilibrated lattice. Cell volume data obtained from both methods were converted to same unit and gradirent of linear fit from 300K to 1300K was calculated to give volumetric thermal expansion coefficients of and respectively in QHA and MD. Experimental rersults matches with the literature value of [1] with small standard dedvation values. Investigation at high temperature failed using QHA as cell volume was overestimated. On the other hand, molecular dynamic is a better model that can operate overwider temperature range, even going beyond the melting point of MgO and expand scope of investigation to phase transition region.
Extension on improving results obtained within molecular dynamics with higher equilibration and production time was shown to be successful in reducing random fluctuations in thermal expansion coefficients as cell volume data are closer to converged value. The effect of increasing equilibration time to 900 steps from 500 steps did not seem to be effective enough. If more time is available, individual experiment on finding the optimal equilibration and production step, as well as time step could beb carried out to maximise the accuracy nad reliability of data.
Reference
- ↑ 1.0 1.1 1.2 Y. S. Touloukian, R. K. Kirdby, R. E. Taylor, and T. Y. R. Lee, Thermophysical Properties of Matter (Plenum, New York, 1977), Vol. 13.
- ↑ Dove, M. (1993). The harmonic approximation and lattice dynamics of very simple systems. In Introduction to Lattice Dynamics (Cambridge Topics in Mineral Physics and Chemistry, pp. 18-35). Cambridge: Cambridge University Press. doi:10.1017/CBO9780511619885.004
- ↑ 3.0 3.1 Dove, M. (1993). Dynamics of diatomic crystals: General principles. In Introduction to Lattice Dynamics (Cambridge Topics in Mineral Physics and Chemistry, pp. 36-54). Cambridge: Cambridge University Press. doi:10.1017/CBO9780511619885.005
- ↑ 4.0 4.1 A. Erba, M. Shahrokhi, R. Moradian and R. Dovesi, On how differently the quasi-harmonic approximation works for two isostructural crystals: Thermal properties of periclase and lime, J. Chem. Phys., 2015, 142, 44114.


