Rep:MgO:rt1714
Introduction
Aim
The aim of this exercise is to examine the thermal expansion behavior of MgO crystal by using quasi-harmonic approximation (LD) and molecular dynamics (MD) under Linux environment. Results of both methods are being evaluated and compared.
The System
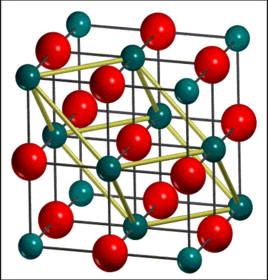
Magnesium oxide crystal, which occupies a face centered cubic structure, is assumed to be an ideal, non defective, periodic system in 3D in this case. The Mg2+ ions and O2- ions are held together by ionic bonding and it has an empirical formula MgO. Three different kinds of cells can be used to describe the system. Primitive cell (ap=bp=cp), being the simplest one, is a unit cell that contains exactly one lattice point and it is the smallest possible cell. [1] Conventional cell (ac=bc=cc), whose volume is 4 times larger than that of primitive cell, is a better representation for the true symmetry of MgO crystal. The previous two cell models can be used to carry out the quasi-harmonic approximation while for molecular dynamics, super cell, which is a repeating unit cell of the crystals, is required as the system size is the key parameter in the simulation. Larger cell system can make sure that every cell doesn't move perfectly in phase and can simulate actual vibration motions of atoms. In this case, a super cell containing 32 MgO units is used as a result of the compromise between accuracy and CPU time.
Computational Methods
Quasi-Harmonic Approximation
This method can be used to compute the phonon dispersion curve (ie. vibrational band structure), which is defined as the connection between frequency ω(k) and wavevector k. The No. of branches is equal to No. of atoms multiply by the No. of dimensions. Every vibration of the crystal can be labelled with a specified k value which corresponds to a wavelength of vibration.
The approximation applied when calculating the MgO Helmholtz free energy is that the system is harmonic and the minimum is a perfect parabola. The anharmonicity resulted from the intrinsic phonon interaction is neglected by quasi-harmonic approximation. [2] The free energy of the primitive cell is computed as a sum over all k values and the equation obtained from statistical thermodynamics is as follows:
- Equation.1
where k is the wavevector, ω is the vibrational frequency, j is the phonon bands and T is the setting temperature in K.
With respect to the free energy change under different temperatures, thermal expansion behavior of MgO crystal can be monitored by looking at the lattice parameter or lattice volume change.
| Equation 2. |
Molecular Dynamics
Molecular dynamics is a technique that allows atoms in the crystal to interact with each other for a fixed period of time and it can reproduce the actual vibration motions of atoms without using harmonic approximation. The thermal expansion behavior is measured by simply solving the Newton's 2nd law of motion:
| Equation 3. |
Firstly, the initial configuration and velocity of ideal MgO supercell is being assigned. Secondly, the acceleration of each atom can be obtained after computing the force exerted. Then the new velocity and position of atom are being updated and the process is being repeated until the averaged temperature becomes reasonably stable. At that point, the averaged volume of the cell at particular temperature can be noted down and compare with the data obtained from other temperatures to study the thermal expansion behavior of MgO crystal. Being more expensive than the quasi-harmonic approximation, the grid size needs to be selected carefully to balance between the accuracy and efficiency.
Results and Discussions
The Phonon Modes and Density of States
When atoms in the crystal vibrate, they can only do it in a collective way and such coupled vibrations in the crystal is called 'phonons'. In order to visualize the phonon modes, a dispersion curve (ie. vibrational band structure), which is a plot of vibrational frequency ω(k) against wavevector k, is displayed. Every possible vibration is associated with a specified k value. Vibration energies and number of vibrational states at a particular k value can be obtained from the dispersion curve. Critical points are k points with high symmetry and are often shown along the axis (eg. Г as the origin).
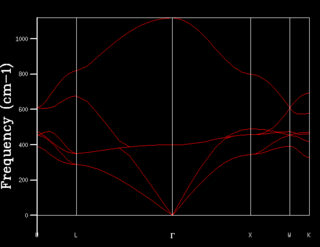
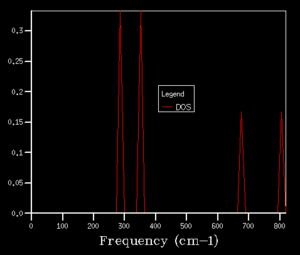
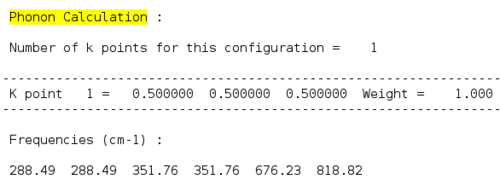
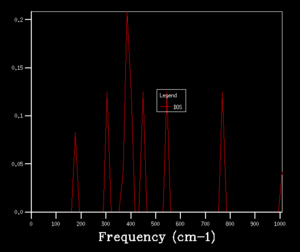
After obtaining the phonon dispersion curve, density of states (DOS), which is the no. of occupied vibrational level at a particular frequency, can be calculated. It simply sums over all the k points at a particular frequency. Comparing the DOS for 1x1x1 grid for a single k value and the phonon dispersion curve, one can work out that the symmetry point L (1/2 1/2 1/2) is the corresponding k point. Figure 3. shows four distinct peaks with frequencies around 280 cm-1, 350 cm-1, 680 cm-1 and 800 cm-1 respectively. The fact that two peaks double the intensity of the other two indicates that there should be two sets of degenerate bands in the dispersion curve. The suggestion can be confirmed by checking the log. file data.
 |
|
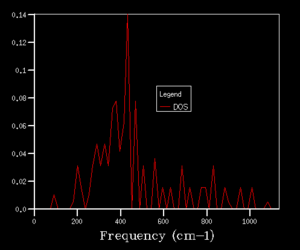
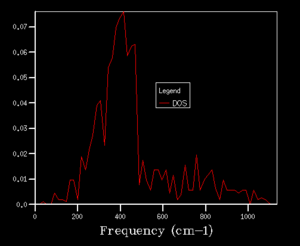
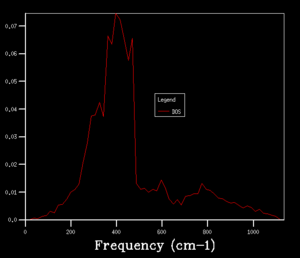
The grid size, which is controlled by the shrinking factor, has an impact on the number of k values. The larger the grid size, the smaller the Brillouin zone thus more k points are included. As the grid size increases from 1x1x1 to 16x16x16, the DOS changes from discrete peaks to smoother curves as it simply sums over more k points and more features will appear. When increase the grid size even further to 32x32x32 and 64x64x64, not only the curvature doesn't change much but also the CPU time begins to increase. As the grid size is large enough, the method can approximate the DOS to a relative accurate level so 16X16X16 is the minimum grid size for a reasonable approximation.
| 2x2x2 | 4x4x4 | 8x8x8 |
 |
 |
|
| 16x16x16 | 32x32x32 | 64x64x64 |
 |
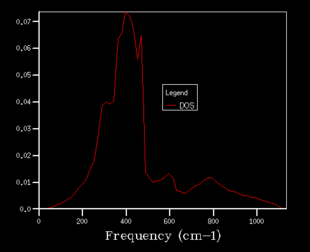 |
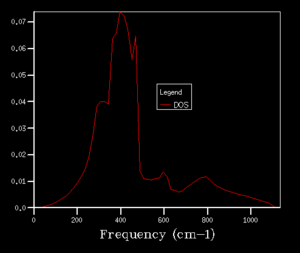
|
This optimal grid size for MgO should be appropriate for a calculation on a similar oxide like CaO. They display the same conventional cell structure (FCC) and the same ion charges. What's more, the lattice parameter for MgO are CaO are 4.2 Å [3] and 4.8 Å [4] respectively. As a result, the generated Brillouin zone is of similar size and thus the vibraional modes will be similar. While for a Zeolite or a metal, this optimal grid size for MgO wouldn't be appropriate because the crystal structure is different from FCC and the collective vibrational modes will be different within the crystal.
Computing the Free Energy under Quasi-Harmonic Approximation
DOS computation is used to graphically rationalize the choice of grid size while the free energy computation is from the numerical point of view. The free energy is computed as a sum over all the k points so the grid size will affect the accuracy of calculation as well. As the grid size increases, the free energy converges to a certain value -40.9265 eV. No change in the value is observed when the grid is increased from 8x8x8 to 16x16x16, correcting to 4 decimal places. This phenomenon further confirms that 16x16x16 is a reasonable grid size that will give relative accurate results. 1x1x1 is appropriate for calculations accurate to 1 meV while 2x2x2 is appropriate for calculations accurate to both 0.5 meV and 0.1 meV per cell.
| Grid size | Free energy / eV | Change in free energy / meV |
|---|---|---|
| 1x1x1 | -40.9303 | -3.818 |
| 2x2x2 | -40.9266 | -0.126 |
| 4x4x4 | -40.9264 | 0.033 |
| 8x8x8 | -40.9265 | 0.005 |
| 16x16x16 | -40.9265 | 0.001 |
| 32x32x32 | -40.9265 | 0 |
Thermal Expansion of MgO
Helmholtz Free Energy and Lattice Constant
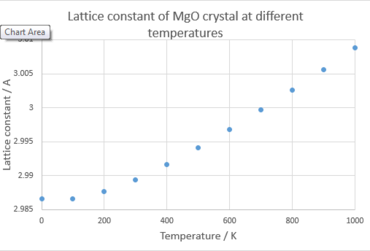
The structure of MgO is being optimized at every setting temperature and the free energy is then calculated using Quasi-harmonic approximation with 16x16x16 grid size. From Figure 4, the lattice parameter increases as the temperature increases, which indicates the occurrence of thermal expansion. Thermal expansion is the tendency of matter to change in volume in response to a change in temperature. [5] Atoms in the crystal vibrate all the time and when the crystal is heated, the kinetic energy increases. Consequently the atoms will vibrate more violently and occupy longer distances with adjacent atoms.
 |
 |
From Figure 5, the Helmholtz free energy becomes more negative because of the positive entropy change as temperature increases. Atoms become more disordered when gaining kinetic energy from heating. By combining equation 5 and equation 6, an expression for ΔA can be obtained. dT and dV are both positive as MgO will have thermal expansion behavior under heating. As well as S and P being both positive will lead to a negative dA. As explained, entropy term is more positive as temperature increases, Helmholtz free energy becomes more negative when MgO undergoes thermal expansion. Both Figure 4 and Figure 5 show the linearity after 300 K.
| Equation 4. | |||
| Equation 5. | |||
| Equation 6. |
Expansion Coefficient
The volumetric thermal expansion coefficient can be calculated according to equation 8. using V0 = 18.8365 eV. From data displayed in Table 3, one can conclude that the thermal expansion coefficient will vary with temperature and the degree of variation decreases at higher temperature. This phenomenon is consistent with the curve in Figure 4. The gradient of the curve in Figure 4, which is directly related to the thermal expansion coefficient, varies with temperature. When temperature is beyond 300 K, the curve tends to display the linearity and the gradient tends to be a constant. The volumetric thermal expansion coefficient calculated in the 300 K to 1000 K region is 28.0x10⁻⁶. The measurement in the literature gives a value of 28.8x10⁻⁶ [6] at 300 K, which has the same order of magnitude with the computed value.
| Equation 8. |
| Temperature / K | Primitive cell volume / Å3 | ΔV / Å3 | αV / 10-6 |
|---|---|---|---|
| 200 | 18.8562 | 0.0197 | 10.4632 |
| 300 | 18.8900 | 0.0338 | 17.9561 |
| 400 | 18.9325 | 0.0425 | 22.5536 |
| 500 | 18.9801 | 0.0476 | 25.2727 |
| 600 | 19.0312 | 0.0511 | 27.1340 |
| 700 | 19.0851 | 0.0538 | 28.5807 |
| 800 | 19.1413 | 0.0563 | 29.8671 |
| 900 | 19.1996 | 0.0583 | 30.9628 |
| 1000 | 19.2600 | 0.0604 | 32.0675 |
Comparison of Quasi-harmonic Approximation and Molecular Dynamics
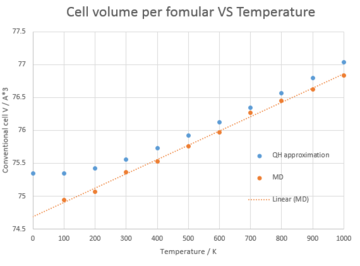
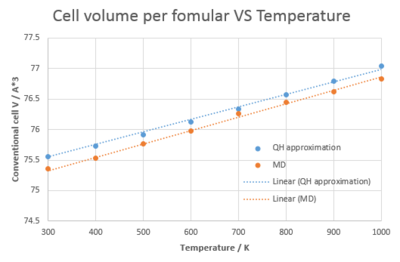
In order to reproduce the actual vibration modes of MgO crystal, molecular dynamics, which allow the atoms to vibrate in all directions, is being used to monitor the thermal expansion behavior. From Figure 6. the dependence of cell volume on temperature is perfectly linear under MD while for QH, the graph is curved at lower temperature. What's more, the MD gives a smaller cell volume at lower temperature and the difference becomes less significant at higher temperature. These phenomena may result from the fact that MD simply doesn't take into account the zero point energy. Figure 7. shows the liner region for both QH approximation and MD. The volumetirc thermal expansion coefficient calculated from QH and MD is 28.0 x 10⁻⁶ and 27.9 x 10⁻⁶ respectively and deviates 2.8 % and 3.2 % from the literature value. As a result, the QH approximation gives a more accurate computing method at low temperature.
 |
 |
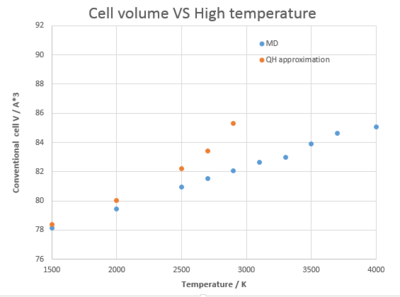
The melting point of MgO is 3125 K. [7] When examine the thermal expansion behavior at even higher temperature (1500 K to 4000 K), Figure 8. shows that the QH approximation deviate quite significantly from the MD curve and QH approximation fails when temperature is beyond the MgO melting point. QH approximation doesn't take into account the bond dissociation situation and the crystal simply expands to infinity under computation. The volumetirc thermal expansion coefficient calculated from QH and MD is 63.0 x 10⁻⁶ and 36.0 x 10⁻⁶ respectively (1500 K to 2900 K) and deviates 75.5 % and 0.3 % from the literature value 35.9 x 10⁻⁶.[8] As a result, MD, which doesn't use harmonic approximation, is a more accurate method at high temperature.
Conclusion
Ideally, the accuracy of simulation would be perfect for an infinite grid, but as a compromise need to be made between CPU time and accuracy, 16x16x16 and 32 unit MgO based super cell is chosen respectively for Qausi-Harmonic and Molecular Dynamics method.
The thermal expansion behavior of MgO crystal is being investigated by Quasi-harmonic approximation and Molecular Dynamics. Based on different assumptions and complexities, different method gives rise to different accuracy at different temperature range. Quasi-harmonic approximation, which takes into account the quantum mechanical zero-point energy, is more accurate at lower temperature. Despite the fact that it is cheaper and simpler, QH method can not simulate the bond dissociation model thus it is limited to the situation where system does not have phase transition. In comparison, Molecular Dynamics, which focuses on the classical Newtonian equation, provides a more accurate simulation at higher temperature.
Both methods have limitations and can be used specifically according to the basis of a model, the required accuracy and the temperature range. Further investigations can be made to study the thermal expansion behavior of other crystal system.
References
<references> [1]
- ↑ 1.0 1.1 S. Hunklinger Festkörperphysik De Gruyter 2014 (p. 56).
- ↑ 2.0 2.1 Zhongqing Wu and Renata. M. Wentzcovitch An efficient method to calculate the anharmonicity free energy (2006)
- ↑ 3.0 3.1 O. Madelung; U. Rössler; M. Schulz II-VI and I-VII Compounds; Semimagnetic Compounds DOI:10.1007/10681719_206 (2006)
- ↑ 4.0 4.1 O. Madelung; U. Rössler; M. Schulz II-VI and I-VII Compounds; Semimagnetic Compounds (1999) P1-3 DOI:10.1007/10681719_224 (2006)
- ↑ 5.0 5.1 Paul A., Tipler; Gene Mosca (2008). Physics for Scientists and Engineers, Volume 1 (6th ed.). New York, NY: Worth Publishers. pp. 666–670. ISBN 1-4292-0132-0.
- ↑ 6.0 6.1 M. Matsui, J. Chem. Phys., 1989, 91, 489. DOI:10.1063/1.457484
- ↑ 7.0 7.1 Analysis of ionic compounds[1]
- ↑ 8.0 8.1 R. R. Reeber, K. Goessel and K. Wang, Eur. J. Mineral., 1995, 7, 1039-1058.
