Rep:MgO:milandeleev
Abstract
Magnesium oxide was modelled at a variety of temperatures in both quantum mechanical and classical manners. The former was found to be more accurate below 600K, and the latter was found to replicate the true anharmonic behaviour of bonds much more exactly above said temperature. The quantum method, involving the quasi-harmonic approximation, was used to elucidate the thermal expansion coefficient for MgO, which was found to be ca. 2.5×10⁻⁵.
Introduction to Theory
Modelling Ideal Gases using the Harmonic Oscillator
In any scientific study, the simplest structure to thermodynamically analyse in a quantitative sense is an ideal gas. Hydrogen is the simplest element, and it has rotational, translational, electronic and vibrational degrees of freedom (although, since it is a homonuclear diatomic, it has just one vibrational degree of freedom). These vibrational degrees of freedom are characterised by the mode of vibration and an associated wavenumber, which is a measure of the energy of the vibration. The energies and modes can be simplistically modeled quantum mechanically by the harmonic approximation, which treats the bonds joining each atom as a spring and applies Hooke's law, which states that the stretching of the string is directly proportional by some factor γ to the applied force:
The potential energy can be found as it is the integral thereof between limits and zero.
Consequently, the Schrödinger equation takes the below form, replacing the mass term with the reduced mass :
The wavefunction must approach zero gently as tends to infinity, and must rapidly approach its maximum as tends to zero. This is modelled by a Gaussian form (), which can be applied to the kinetic term of the Schrödinger equation:
Since the behaviour of a spring means that its internal energy is constant, the sum of the kinetic and potential energies must be constant, and cannot depend on the position . This leads to the conclusion:
Introducing the vibrational frequency term yields:
Since can only take discrete values, the vibrational energy levels are said to be quantised.
Problems with the Model
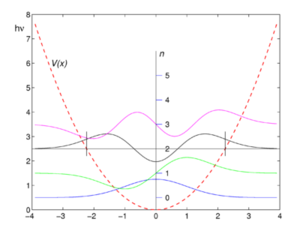
In reality, the harmonic oscillator model is problematic. (3) As seen in the adjacent graph, although the maximum and minimum bond distance increases with energy, the average internuclear separation of the two atoms modelled on the spring is constant.We know from simple logic, as well as experience that this is not true. Consequently, molecules are more often modelled as anharmonic oscillators, the left side of which resembles the left side of a parabola, but the right side of which starts parabolically, but then plateaus to allow for bond breakage(3). In fact, it is the anharmonicity of chemical bonds that provides a plausible explanation for the origin of thermal expansion. Increasing energy forces the substance out of the quasi-harmonic potential well, and the atoms begin to separate. This, in fact, disproves the logical (albeit more facile) theory that thermal expansion originates from an increase in the frequency of vibrations.
Applying the Model to a 1D Solid[1]
A linear molecule has 3N-5 modes of vibration (N referring to the number of atoms). Considering an linear polymer of hydrogen atoms of unit cell length a brings us a step closer to applying the harmonic model to a solid. This polymer would have numerous vibrational modes, which essentially form a continuous band of vibrational states. The number of vibrational states present within a given range of the band can be modelled by the DOS function, or the density of states. Mathematically, the non-trivial eigenvalue solutions to the Schrödinger equation for this system are, where N is the number of atoms and j the vibrational quantum number, which can only take discrete natural values between 1 and N[1]:
The fact that j can only take discrete values would prevent the formation of a band structure. However, invoking the correspondence principle, when the value of N becomes extremely large, the quantised levels tend to 'blur' together. To simplify the mathematics, a new variable k is defined:
This is assigned the limits above (called the first Brillouin Zone) as the periodicity of the sine squared function means that all of the other Brillouin zones are simply repeats of the first, thus their consideration is trivial. Naturally, this is based on the assumption that the solid is perfect, free of defects and periodic. Substituting this into the equation for vibrational frequency yields the below equation, which is used to plot a dispersion graph[1].
Returning to the concept of the continuous nature of k, this means that there are infinite eigenfunctions describing vibrational states (called phonons) that the lattice could adopt at any given time (allowing for energy), so long as there are infinite atoms. Each phonon is mapped to a particular value of k. Like for vibrations in a simple diatomic molecule, each phonon is characterised by a particular energy and, consequently, wavenumber, depending on its k-value. This can be deduced from the de Broglie relationship:
The free energy is calculated as a sum over every phonon of the crystal, taking into account every possible value of k (which is in turn associated with a particular phonon or set of phonons).
Extending the Model to a Diatomic in 3D
So far, we have dealt with a linear chain of homonuclear atoms, which isn't particularly useful in our case. However, the model can easily be tinkered with to form a linear diatomic chain using the following equation[1]:
The presence of the ± term means that there are two distinct dispersion relations for the chain, as exemplified adjacent. The low-frequency branch is termed the acoustic branch, and the high-frequency branch is termed the optical branch. This gives rise to the directly proportional relationship between the number of atomic species in a solid and the number of lines on the dispersion.
Extending the model to three dimensions has a similar effect: the number of bands is directly proportional to the number of dimensions. An ideal lattice of LiKO is expected to have 9 dispersion branches: the number of branches is the product of the number of atomic species and the dimensionality of the lattice in space. This is because the atoms are given second and third degrees of freedom to translate, meaning that many more phonons are available.
Problems with the Model
Like the harmonic approximation for smaller molecules, this one is also riddled with problems. Whilst it is good enough to provide rationale for neutron scattering, IR and Raman spectra, specific heat and X-ray structure factors, it cannot account for thermal expansion of a lattice, yields spring constants γ that are thermally isotropic, and gives the lattice an infinite thermal conductivity. Thus, the quasi-harmonic approximation was introduced.
The Quasi-Harmonic Approximation
(3) This model takes into account the dependence of vibrational frequencies on volume by adapting the equation for the Helmholtz Free Energy as below, which means that it is designed to change the solid volume according to the temperature. This is achieved by including some extra terms in the expansion of the anharmonic series that the harmonic approximation ignores[2].
The equilibrium volume at any temperature is found by minimising the Helmholtz free energy, which allows the definition of a thermal expansion coefficient (set at zero pressure by convention):
Problems with the Model
(3,4) It is important to understand that the QHA is a model, and is imperfect. It does not account for melting, which means that the phonons do not particularly well represent the reality of a melting ionic solid. This is because, with increasing temperature, anharmonic effects become more and more significant, and phonon-phonon interactions become more influential on the behaviour of the solid. Consequently, at temperatures past the melting point, a solid modelled with the QHA just keeps expanding. Despite this, according to a study by the American Physical Society, 'the quasiharmonic approximation provides a remarkably good description of the structural and elastic properties of...metals even near their melting points'[3], although this does not discuss ionic solids like the subject of this study.
The Final Alternative
(4) Molecular dynamics treats the atoms or ions in a solid with complete anharmonicity. However, the particles themselves are modelled clasically, as hard, charged balls, which are accelerated in time, analysed, and then repeated. This gifts the MD technique with high accuracy at high temperatures, even allowing for the modelling of the melting of solids at high temperatures[4] . However, at low temperatures, the method fails, and the QHA, which treats the particles quantum mechanically, succeeds in spades.
Experimental
The conceit of this experiment was to model a lattice of magnesium oxide between the temperatures of 100-1000K in order to calculate the lattice constant using two different methods: the quasi-harmonic approximation and molecular dynamics. This was achieved by the simulation of the lattice using DLVisualize on a Linux virtual PC, using which GULP calculations were executed. The optimisation potential ionic.lib was used, and the structures optimised for Gibbs Free Energy. The data obtained from these calculations were used to compare the two models, which were compared to the real anharmonic case.
Results and Discussion
1. Phonon Modes of MgO
After optimising the MgO structure, the density of states was initially computed using the quasi-harmonic approximation for a single k-point of to produce the DOS graph in the table below. From said table, it is clear to see that the DOS graphs become more complex as more k points are computed, and, as more data is generated, they become more complete and more complex. This means that more states become available as more k points are taken, which makes sense because one value of k is characteristic of a set of phonons (as it represents their wavevector). Computing more k values allows more phonons to be generated, thus more vibrational states are found and the density of states becomes more complete.
| Grid Size | Density of States Graph | Grid Size | Density of States Graph | Grid Size | Density of States Graph |
|---|---|---|---|---|---|
| 1×1×1 | 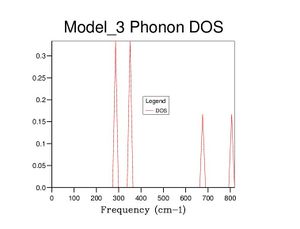 |
4×4×4 | 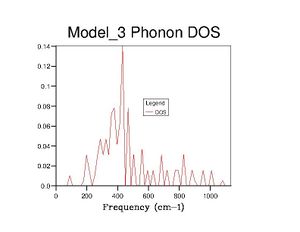 |
40×40×40 | 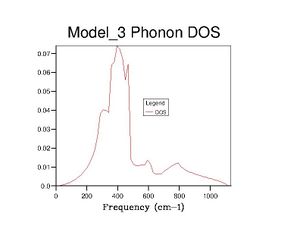 |
| 2×2×2 |  |
10×10×10 | 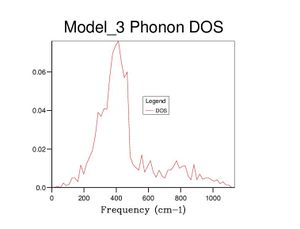 |
50×50×50 | 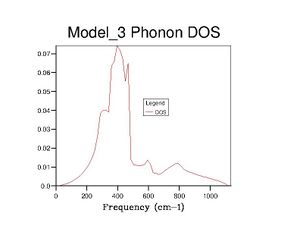 |
| 3×3×3 | 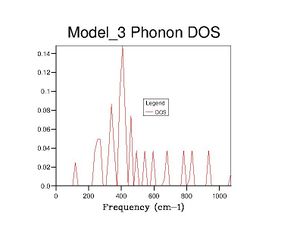 |
20×20×20 | 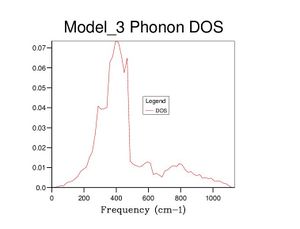 |
60×60×60 | 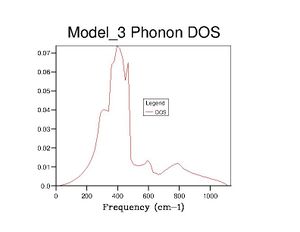 |
Realistically, the 40×40×40 grid is sufficiently accurate, showing very little difference with the 60 grid. However, in later exercises, I chose to use the 60 grid because I could not see any difference with the 100 grid. In contrast, the 40 grid has a more defined peak at ca. 800cm-1 and a slightly more well-defined shoulder at ca. 300cm-1. All three, nevertheless, are starkly smoother with fewer discontinuities than the 10 grid, which only really gets the size of the large peak right.
The DOS graphs are heavily related to the dispersion curves. The DOS graphs allow identification of how many states are available at a particular energy (indicating here that many states are available between 300-500cm-1). The dispersion curves describe the k values associated with the phonons at each frequency, and allow identification of the band gaps. The density of points in the dispersion curves at certain frequencies is proportional to the DOS at said frequencies.
The optimal size of 40×40×40 would be fine for a similar oxide like calcium oxide, as the lattice would be of similar properties and complexity. It would be more than necessary for a simple metal, which only requires calculations for one atom so the periodicity is essentially doubled, and a grid half the size could be used. Zeolites are far more complex molecules and would require a much larger grid.
NB: All the questions and opportunities to speculate for this question have been addressed under this specific heading.
2. Computing the Free Energy - the Harmonic Approximation
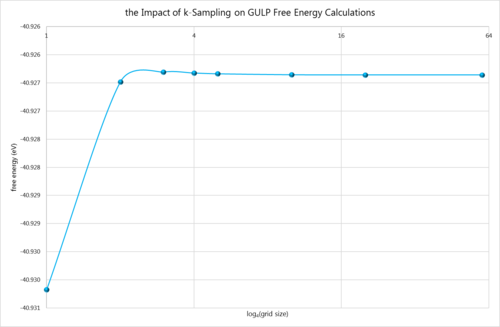
The free energy of a number of different grid sizes was computed using the quasi-harmonic approximation. It is simple to extrapolate that increasing grid sizes require increasing computational power, thus a compromise has to be struck between accuracy and time. All of the calculations below were completed at 300K.
As expected, the free energy initially decreases (becomes more negative) as the calculation method becomes more accurate. Similarly to any quantum mechanical approximation, the best models are those that cause the energy to fall. However, once reaching within 0.0001̥ of the true value, the energy essentially just hovers around that value, getting ever so slightly larger in the process. This is too small of an energy difference to matter, so the program is just refining its results. These results demonstrate that a grid size of just 2×2×2 generates a result within 1meV and 0.5meV of the true value, but a grid size of 10×10×10 is required for an accuracy of 0.1meV. Similarly to before, these grid sizes would be appropriate for a similar oxide and metal, but possibly insufficient for a zeolite since there exist simply more parameters for such a system, which would not be fully optimised with a grid size of 2×2×2.
NB: All the questions and opportunities to speculate for this question have been addressed under this specific heading.
3. The Thermal Expansion of MgO
The free energy of the MgO structure was computed at grid sizes of 4×4×4 and 60×60×60 at temperatures between 0-1000K to calculate its thermal expansion, and to provide further insight into the accuracy of smaller grids. This method, as before, employed the quasi-harmonic approximation. Firstly, the comparison of grid sampling.
| Temperature (K) | Difference between 4- and 60-Grids | Graph |
|---|---|---|
| 100 | 0.000022% | 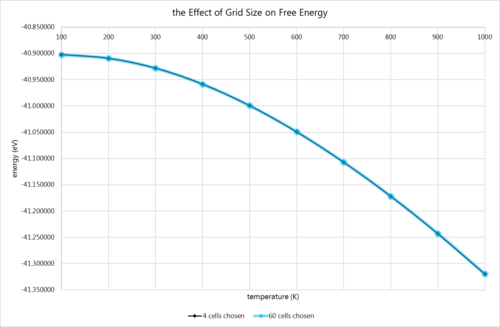 |
| 200 | 0.000051% | |
| 300 | 0.000076% | |
| 400 | 0.000098% | |
| 500 | 0.000120% | |
| 600 | 0.000144% | |
| 700 | 0.000163% | |
| 800 | 0.000180% | |
| 900 | 0.000201% | |
| 1000 | 0.000218% |
It is interesting to note that the percentage difference between the smaller and larger grids increases with temperature. This is perhaps due to the fact that more calculations are required at higher temperature, as more phonons are accessible, so the increased accuracy is desirable. It may also partly arise from the inaccuracy of this technique at higher temperatures, causing divergence of the easier calculations from the true value. However, in reality, the results are exceedingly close, as can be gleaned from the graph. In terms of the graph itself, it resembles the bottom right-hand quarter of an upside-down parabola. This was confirmed by a rapid gradient calculation between points, which revealed that the gradient was increasing between each consecutive pair of points. This suggests that the temperatures are not yet high enough for the model to show any sort of anharmonicity (if, indeed, a significant amount ever shows).
Secondly, the lattice constant was plotted against temperature.
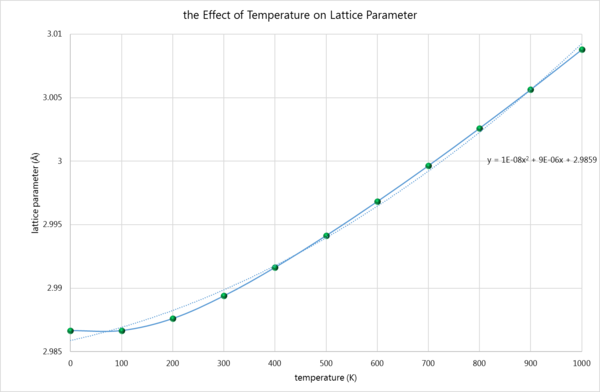
Thirdly, the coefficient of thermal expansion was computed. To do this, the unit cell volume was plotted against temperature.
From the above equation and graph, the first term refers to the intercept of the graph, which is the volume occupied at 0K, or, put another way, the 'zero point volume'. This was found to be 18.83826Å3. The second term is simply the gradient of the graph. As is plain to see, the graph is not linear at every point, but instead becomes quasi-linear at ca. 500K. Thus the gradient is taken just from those points, and was found to be 0.000545892. Thus:
The literature[5] states that the coefficient follows a quadratic relationship with temperature, taking the form below. This can be used with one of the temperatures found to be linear, and the results compared:
This result is in the same order of magnitude found with the computational method. The discrepancies are likely due to the approximations made in this method: most importantly, the Born-Oppenheimer approximation separates the variables found in Schrödinger's equation and allows them to be treated individually. Thus the vibrations are treated separately from other excited states, in spite of our knowledge of spin-vibration coupling and other phenomena that greatly influence phonon behaviour. This is known as the adiabatic approximation in the context of crystal studies.
NB: Some of the questions and opportunities to speculate for this question have been addressed in the introductory theory, which have been labelled by underlining and a bracketed reference to the particular question.
4. Molecular Dynamics
Molecular dynamics calculations were performed on a 32×32×32 grid of MgO at temperatures ranging from 100-1000K. The results and graph are below.
The results from molecular dynamics are remarkably inconsistent at the lower temperatures, reflecting the poor performance of this technique in such conditions. However, above 600K, the model begins to shine, because it begins to plateau and resemble an anharmonic oscillator. This shows how effective MD is at predicting high-temperature behaviour of materials, as it shows how something will not expand forever. If the experiment were to be run again, it would be run with a 40×40×40 cell for MD.
NB: Some of the questions and opportunities to speculate for this question have been addressed in the introductory theory, which have been labelled by underlining and a bracketed reference to the particular question.
Conclusion
Overall, the quantum calculations were successful beneath 600K, modelling a parabola as expected. The molecular dynamics computations 'filled in the gaps', generating an anharmonic-esque plateau. Unfortunately these results were not extremely close to experimental results, which belies the accuracy of such calculations. Perhaps if more timesteps were taken in MD, or larger cells in QHA, more accurate results would have been generated. Moreover, it is important to stress the importance of defects in the crystalline structure, which can have a large impact on their real-life behaviour but are obviously not accounted for in ideal calculations such as these.
References
- ↑ 1.0 1.1 1.2 1.3 P.Dean; Atomic Vibrations in Solids. In: J. Inst. Maths Applies (1967) 3, 98-165
- ↑ Alessandro Erba; Thermodynamics of Solids: Harmonic and Quasi-harmonic Approximations. In: Dipartimento di Chimica, Università di Torino (2016)
- ↑ A.A Quong, A.Y Liu; First-principles calculations of the thermal expansion of metals. In: PHYSICAL REVIEW B 56, 13 (1997)
- ↑ P. Giannozzi; Density Functional Perturbation Theory and Thermal Properties. In: Scuola Normale Superiore di Pisa and Democritos National Simulation (2006)
- ↑ A. S. Madhusudhan Rao and K. Narender, “Studies on Thermophysical Properties of CaO and MgO by -Ray Attenuation,” Journal of Thermodynamics, vol. 2014, Article ID 123478, 8 pages, 2014. doi:10.1155/2014/123478

