Rep:MgO:jjb215
Abstract
This investigation explored two computational methods: quasi-harmonic approximation (QHA) and molecular dynamics (MD), in order to calculate the thermal expansion coefficient of MgO at varying temperatures. The thermal expansion coefficients at 300 K were found to be 20.6, 31.8, 31.2 10-6 K-1 for QHA, MD and experiment, respectively. It was found that QHA is a more suitable model at very low temperatures due to it accounting for the zero-point energy. However, both methods fail at temperatures close to the melting point of MgO as QHA does not account for intrinsic anharmonic effects and MD produces a large amount of noise due to a large timestep.
Introduction
The study of solid state chemistry is essential to understanding the factors which determine the crystal structure, physical and chemical properties of solids and hence, their reactivity. Synthesis of new materials with the desired properties requires a deep knowledge of solid-state reactivity. Solid-state reactivity is mainly determined by the specific arrangement of the crystal and not so much by the individual intrinsic reactivity or concentration of the components. This is because, unlike liquids or gaseous state reactions, the components of a crystal have a fixed position.[1] Solid state reactions involve one or more of the following steps: i) adsorption (and desorption) or gaseous components on the solid surface, ii) chemical reaction, iii) nucleation of the phase and iv) mass transport through solids.[2] These reactions can also be affected by change in temperature, as the volume of the crystal lattice is temperature dependent—this relationship is described by the thermal expansion coefficient of the system.
MgO crystal lattice
The conventional unit cell of the MgO lattice is a face-centered cubic (fcc) structure—where atoms are placed on all the corners and faces of the cube and the basis vectors define a right handed-axial system. All the octahedral holes of this structure are also filled with the ion of opposite charge—corresponding to a halite structure. This conventional unit cell contains four atoms of Mg and four atoms of O—both atoms having an identical coordination of six. The crystal lattice can also be represented as a primitive unit cell that contains one Mg and one O atom. This means that the conventional cell volume can be calculated by multiplying the primitive cell volume by four.
Thermal expansion coefficient
The thermal expansion coefficient describes how the volume of a crystal lattice changes with temperature. It is an intrinsic property of the crystal lattice. Thermal expansion of a material is the result of the entropic advantage at higher temperature offsetting the energy advantage of having a small volume. A higher temperature means a higher entropic contribution and hence, an increase in volume.[3] The increase in temperature allows higher vibrational levels to be filled, which means the atoms are able to vibrate at much greater distances compared to the equilibrium bond length. And if these vibrations are modelled with some anharmonic nature, then these higher energy vibrations will cause an increase in the equilibrium bond length-- resulting in thermal expansion. This leads to an increase in the volume of the crystal lattice and hence, the entropy. The equation below is used to find the thermal expansion coefficient (α) of the system, where it is described as the change in volume with respect to change in temperature at constant pressure, and normalised by dividing by the initial volume of the crystal lattice.

Using computational methods
Solid state reactions take a longer time to complete than reactions for molecules in liquids and gases due to the low mobility of the atoms in the solid state; therefore, computational approach is used to investigate properties such as free energy, lattice volume and thermal expansion coefficient of the MgO lattice.[4] The two methods used in this investigation are quasi-harmonic approximation (QHA) and molecular dynamics (MD).
Harmonic approximation
The harmonic approximation only considers the nearest neighbour interactions of atoms. In a crystal lattice, atoms vibrate and if the translations are small compared to the unit cell length, a, the energy of the system can be found by using a Taylor series and summing over all the atoms. Only the quadratic term of the Taylor series expansion and the higher-order terms are neglected. The energy obtained from this approximation is equivalent to the energy of a set of harmonic oscillators—the higher-order terms neglected are the anharmonic terms. The problem with using a monoatomic linear chain is that the ends of the chain only have one nearest neighbour and the classic solution to this is applying the Born-von Karman periodic boundary conditions—this joins the ends of the chain. Since the solutions to the harmonic equation are sinusoidal waves, the motion of the system will correspond to a set of travelling waves and the motion of the n-th atom along the chain (including the end atoms) will be a superposition of all the travelling waves.[3] This ultimately leads to an expression that relates the angular frequency of the wave, ωk, with the wave vector, k:

, where J is the force constant, m is the atomic mass. The plot of ωk as a function of k produces dispersion curves and they are periodic with a period of 2π/a—this is equivalent to the unit cell length, a*, in the reciprocal space. The discrete values of k are in the range: -π/a < k < π/a, this is called the first Brillouin zone and it contains all the useful information about the travelling waves of the system studied.[3]
This model of a linear chain of monoatomic atoms can be extended to three dimensions in order to calculate the free energy of a crystal lattice.
Quasi-harmonic approximation
The problem with the harmonic approximation is that it fails to explain thermal expansion, as the equilibrium distance between atoms is independent of temperature. Thus, QHA is introduced—it is a model that is used to treat the phonon frequencies as volume dependent. The minimum Helmholtz free energy (F) of a crystal structure can be used to find the temperature dependence of a crystal structure. This is due to the fact that the equilibrium structure of a crystal is one with the minimum free energy.[3] The free energy can be calculated using the equation below:

The first term is the potential energy of the crystal lattie, the second term is zero-point energy and the third term corresponds to the entropic contribution of the vibrational modes of the crystal lattice.
Molecular dynamics
Molecular dynamics is based on solving Newton’s equation of motion for a set of imaginary atoms—whose initial momenta and positions are generated and then stored a computer, which are also assumed to interact according to interatomic anharmonic potential. Discrete time steps are used to create a continuous set of solutions to the equation of motion—along with the use of an algorithm to calculate new momenta and positions using previous data. The MD method can generate a collection of classical trajectories of the atoms over a time period long enough to be analysed with sufficient accuracy. Thermodynamic properties such as temperature can be obtained from the generated classical trajectories by using the atomic velocities and treating them in the classical manner. Crystal structure information can also be extracted from the simulations. The mean position of atoms can be obtained by taking an average over all unit cells over a reasonable time period— the cell unit cell volume can also be calculated using the same principle.[3]
In order to make the calculations simpler and faster, the hard sphere model is used—which means that the loosely bound outer shell of electrons is ignored.
Aims
The aim of this experiment is to initially find the optimum grid size to use for the QHA method by testing a variety of grid sizes and comparing the free energies obtained. And then to use both methods described above to calculate the thermal expansion coefficient of the MgO crystal lattice by finding the change in volume with respect to different temperatures. The two methods will be compared and the thermal expansion coefficient values obtained will also be compared with experimental values.
Programs in use
One of the programs used is DL Visualise which is a general-purpose software for visualising material structure and properties—allowing visualisation of crystals and surfaces. GULP (General Utility Lattice Program) will be used to perform multiple analytical simulations on the MgO crystal lattice. For QHA calculations, MgO.str (primitive cell) is used because a primitive cell contains all the useful information in the reciprocal space and using a larger cell would just waste processing power and increase computation time. For MD simulations, the MgO_32.str (supercell with 32 MgO units) file is used to allow more flexibility for the different vibrational modes of the system. Using a primitive cell in an MD calculation would be impractical as all the cells in the crystal lattice would be moving in-phase and it would be the same as sampling phonons at just the k-point (0, 0, 0).
Results and discussion
Phonon dispersion curves and density of states
 |
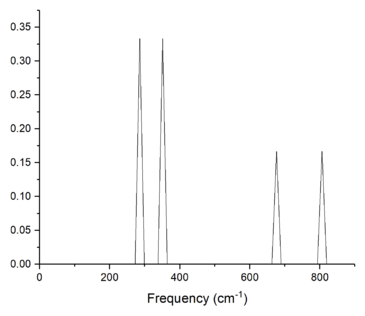 |
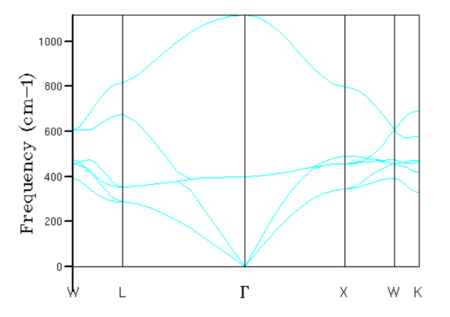
In a 1x1x1 grid, the density of states was calculated for a single k-point, this k-point can be found by correlating the frequencies of the vibrational modes seen in the density of states plot with the phonon dispersion curve, as seen in figures 1 and 2. The density of states plot reports two peaks at 286 and 351 cm-1 with an intensity of 0.333, and two peaks at 676 and 806 cm-1 with half the intensity (0.167). These four peaks correspond to k-point L on the phonon dispersion curve, as seen from figure 1. It can be seen from the phonon dispersion curve that the vibrational modes at 286 and 351 cm-1 are double degenerate due to the merging of two branches into one at k-point L. The log files of the dispersion curve and DOS confirms that the k-point L (0.5, 0.5, 0.5) is indeed the one calculated in the 1x1x1 grid and confirms the double degeneracy of the two vibrational modes-- where six vibrational frequencies are reported but 286 and 351 cm-1 are repeated twice.
The density of states and dispersion curves are related because they both have frequency as one of their axis. The density of states shows the relative number of states at each vibrational frequency that can be occupied—the vibrational frequency levels of the system can be seen on the dispersion curves as branches. In addition, as more k-points are sampled, the more accurate the density of states is and the better the dispersion curve is described in terms of the number of states the vibrational levels contain.
Finding the optimum grid size
 |
 |
 |
| Grid size | Free energy/ eV | Difference in free energy with subsequent value/ eV |
|---|---|---|
| 1 | -40.930301 | 0.003692 |
| 2 | -40.926609 | 0.000177 |
| 3 | -40.926432 | -0.000018 |
| 4 | -40.926450 | -0.000028 |
| 8 | -40.926478 | -0.000004 |
| 16 | -40.926482 | -0.000001 |
| 25 | -40.926483 | 0 |
| 32 | -40.926483 | 0 |
| 64 | -40.926483 | Converged |
| Material | Lattice constant/ Å |
|---|---|
| MgO | 4.212[5] |
| CaO | 4.8110 [6] |
| Faujasite | 24.488 to 24.242[7] |
| Lithium | 3.51[8] |
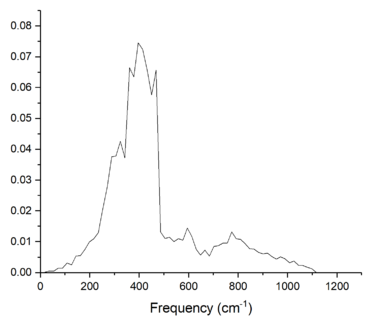
A larger grid size means that there is a larger number of k-points that are used to calculate the density of states plot—this results in a more detailed description of the vibrational band structure of the MgO crystal lattice in terms of the densities of each vibrational frequency. This be seen in figures 3 and 4, where more vibrational frequencies appear on the DOS plot, as oppopsed to only four peaks in figure 2. The DOS from a grid size of 64x64x64 produces a smoother curve compared to the one obtained from a grid size of 16x16x16; hence, it can be assumed that the DOS is more accurate for 64x64x64. However, a more quantitative argument can be made by considering the free energy of the crystal lattice with varying grid size. This is because from equation 3, it can be seen that the free energy is a sum of all the energy and entropy contributions from different k-points in the reciprocal space; therefore, calculating with more k-points and vibrational frequencies means that the free energy obtained is more accurate. Figure 5 and table 1 both show that the free energy increases initially as the grid size is increased; however, further increase in the grid size causes the free energy to decrease slightly and start to converge to a single value. It can be seen that the difference in free energy between 16x16x16 and 64x64x64 is a mere 1 µeV; hence, the 16x16x16 grid was chosen as the optimum. Although the computation time is lower when using smaller grid sizes, they do not provide sufficient accuracy for the calculated value of the free energy. Higher grid sizes than 16x16x16 would yield more accurate values of the free energy as more k-points are sampled; however, there is a large increase in the computational time and wastes processing power for an insignificant increase in the accuracy of calculation. Table 1 also shows that the 2x2x2, 2x2x2 and 3x3x3 grids are accurate to 1, 0.5 and 0.1 meV, respectively.
It is apparent that the larger the number of k-points , the better the quality of the calculation and this is achieved by increasing the grid size. And because of the definition of real and reciprocal space, a large unit cell (lattice constant) correspons to a large Brillouin zone, such that large number of k-points is required for an accurate representation of reciprocal space. Consequently, a large lattice constant means a small Brillouin zone and lower number of k-points required. Table 2 shows the lattice constants of different materials, CaO has a slightly larger lattice constant than MgO, meaning that it would require a smaller number of k-points to represent the reciprocal space; hence, the optimum grid size is smaller than 16x16x16. The lattice constant of Faujasite is very much larger than MgO-- this means that the optimum grid size to provide an optmum calculation is much smaller than 16x16x16. On the other hand, lithium has a smaller lattice constant-- leading to a larger Brillouin zone and this means that the optimum grid size for this crystal lattice is larger than a 16x16x16 grid.
QHA: Change in free energy and lattice volume with temperature
 |
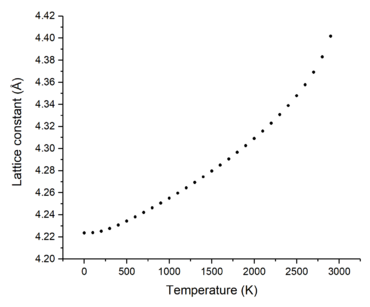 |
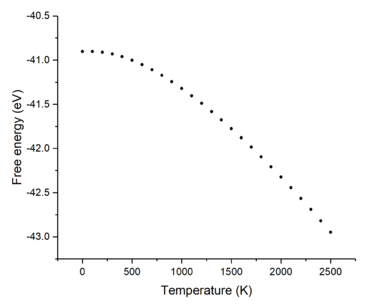
Figures 6 and 7 show how the free energy and lattice constant change with temperature, respectively. It can be seen that as the temperature increases, the free energy decreases but the lattice constant increases. The very small, non-linear decrease in free energy at the low temperature region can be explained using equation 3; at very low temperatures, the lattice potential energy and zero-point energy dominate the contribution to the free energy. However, as the temperature increases, the entropic part (third term) contributes more to the free energy and starts to dominate the shape of the curve-- the curve becoming more linear and the free energy becoming proportional to the temperature. The initially slow and non-linear increase of the lattice constant at low temperatures can be explained as being due to the fact that the temperature is not high enough to populate higher vibrational levels-- causing the vibrations of the atoms to not deviate far from the equilibrium bond length and hence, there is a very small change in the lattice constant. As the temperature increases, higher vibrational levels are filled and the atoms within the crystal lattice are able to vibrate far from equilibrium and thus, increasing the lattice constant more linearly.
QHA and MD: Thermal expansion coefficient
 |
 |
| Temperature/ K | QHA α/ 10-6 K-1 | MD α/ 10-6 K-1 | Experimental[9][10] α/ 10-6 K-1 |
|---|---|---|---|
| 0 | 15.8 | n/a | n/a |
| 23 | n/a | n/a | 0.0 |
| 50 | n/a | 31.4 | n/a |
| 73 | n/a | n/a | 3.0 |
| 100 | 17.4 | 31.5 | n/a |
| 123 | n/a | n/a | 10.8 |
| 173 | n/a | n/a | 18.9 |
| 200 | 19.0 | 31.6 | n/a |
| 223 | n/a | n/a | 25.2 |
| 300 | 20.6 | 31.8 | 31.2 |
| 400 | 22.3 | 31.9 | 35.7 |
| 500 | 23.9 | 32.0 | 38.4 |
| 600 | 25.5 | 32.1 | 40.2 |
| 700 | 27.1 | 32.2 | 41.4 |
| 800 | 28.7 | 32.3 | 42.6 |
| 900 | 30.3 | 32.5 | 43.8 |
| 1000 | 32.0 | 32.6 | 44.7 |
| 1100 | 33.6 | 32.7 | 45.6 |
| 1200 | 35.2 | 32.8 | 46.5 |
| 1300 | 36.8 | 32.9 | 47.1 |
| 1400 | 38.4 | 33.0 | 48.0 |
| 1500 | 40.1 | 33.2 | 48.9 |
| 1600 | 41.7 | 33.3 | 49.8 |
| 1700 | 43.3 | 33.4 | 50.4 |
| 1800 | 44.9 | 33.5 | 51.3 |
| 1900 | 46.5 | 33.6 | 52.2 |
| 2000 | 48.1 | 33.7 | 53.3 |
In a diatomic molecule with an exactly harmonic potential, the equilibrium bond length is not expected to increase with temperature. This is because the harmonic approximation is only valid at constant volume and hence, cannot model thermal expansion. This can be explained as being due to symmetric vibrations (magnitude of bond lengthening is equal to magnitude of bond contraction), so although the vibrations cause large displacements away from the equilibrium bond length as the temperature increases, the equilibrium bond length remains the same on average. In QHA however, the phonons are volume dependent; some anharmonic effects are included and the potential well is not a symmetric parabola (shape is akin to morse potential). As the temperature is increased, higher vibrational modes are populated-- causing the equilibrium bond length to increase on average. This is because the magnitude of bond lengthening is now larger than the magnitude of bond contraction-- this is the result of the anharmonic effects in QHA.
In MD simulations, it is also essential to find the optimum cell size and this can be done in the same way as for QHA. Different cell sizes can be used to obtain the total energy of the lattice (kinetic and potential energy) using MD and the optimum cell size can be found by looking for the point of convergence.
Figure 8 shows the change in conventional cell volume of the crystal lattice as the temperature is increased and the polynomial fits were solved to calculate the the thermal expansion coefficient of MgO in the temperature range 0-2000 K for both QHA and MD-- this data is shown in figure 9 and table 3. At low temperatures (0-200 K), it can be seen that the calculated values from QHA are closer to experimental literature values-- meaning that QHA is a better method to describe the MgO lattice at low temperatures. On the other hand, MD overestimates the thermal exansion coefficient by a large margin at this temperature range. This difference in accuracy is due QHA including the zero-point energy term in the free energy equation (equation 3); whilst, MD, being a classical method, does not include this term. The zero-point energy is a major contributor to the free energy at these very low temperatures; hence, QHA produces more accurate values of the unit cell volume and thermal expansion coefficient.
At the middle temperature range (300-1000 K), values obtained from MD simulations are closer to experimental values; thus, MD provides higher accuracy. This is because MD includes anharmonic effects in the interatomic interactions. However, the gradients of the experimental and QHA data are more similar-- which means that QHA models the relationship between the thermal expansion coefficient and temperature in MgO much more accurately. Overall, both methods provide a good representation of the thermal expansion properties of MgO at this temperature range and this is because this range is neither too low nor close to a phase transition.
At even higher temperatures in the 1100-2000 K range, the values obtained from QHA are again closer to experimental values, instead of values obtained from MD simulations. This occurs because of the very linear relationship of the unit cell volume with temperature using the MD method, as seen in figure 8. This is reflected in figure 9, where it can be seen that the gradient of the MD plot is very close to zero and this is again due to the classical nature of MD. On the other hand, the QHA provides a rather accurate model on the thermal expansion coefficients at this temperature range because this region is still very linear and well within the QHA due to its slight anharmonic nature.
At temperatures near or above the melting point of MgO, 3125 K, the QHA becomes unreliable because it cannot describe displacive phase transitions that arise due to intrinsic anharmonic effects.[3] QHA still continues to use a parabola as a model which means that the bonds cannot and the calculation will continue to assume the structure is still a solid lattice crystal, when in reality, the system has turned into liquid. As the temperature increases, the cell volume will continue to increase; however, it would not be able to calculate the increase in volume due to the phase transition to a liquid. In contrast, MD simulations start to fluctuate around 2500 K and higher-- this is due to the nature of the method. At these very high temperatures, the velocities of the hypothetical atoms are very high and if the timestep is too large then accurate representation of the vibrational modes cannot be achieved. This ultimately introduces a large error in the calculation of velocities, positions and hence, thermodynamic properties. Using a smaller timestep would allow the simulation to calculate more accurate trajectories and thermal expansion coefficients.
Conclusion
The optimum grid size for QHA calculations was determined to be 16x16x16 as it provided free energies accurate 1 μeV compared to the converged value. QHA was used to define the change in free energy and lattice constant with respect to temperature and in both plots, the curve initially has a slow increase at very low temperatures. This is the result of the small contribution of the entropic term to the free energy and the fact that higher vibrational modes are not populated.
The QHA and MD methods were used to calculate the thermal expansion coefficient of MgO at different temperatures. It was observed that the QHA method was more suitable at temperatures in the range 0-200 K due to it accounting for the zero-point energy of the crystal lattice. MD produced values far from the experimental data as it is classical in nature and does not consider the zero-point energy. In the temperature range 300-1000 K, it was found that both methods gave reasonable representation of the thermal expansion of MgO as this region was linear and far from the melting point. As the temperature was increased further to 1100-2000 K , it was found that QHA gave very accurate results when compared to experimental data-- this is hypothesised as being due to the temperature range being within the anharmonic part of the approximation. On the contrary, MD loses accuracy at this temperature range due to the very linear dependence of the unit cell volume with temperature-- this produces a small range of thermal expansion coefficients and this results from the classic nature of MD. At temperatures close to the melting point of MgO, QHA fails to model phase transitions due to intrinsic anharmonic effects. Similarly, the MD method starts to fluctuate due to the high velocities of atoms and the large timestep-- these both lead to inaccurate calculation of trajectories. An improvement to the MD experiment could be to vary and test different timesteps in order to calculate accurate trajectories at higher temperatures.
References
- ↑ C. N. R. Rao and J. Gopalakrishnan, New directions in solid state chemistry, Cambridge University Press, Cambridge ; New York, 2nd edn., 1997.
- ↑ C. A. C. Sequeira, Chem. Eng. Res. Des., 2013, 91, 318-324.
- ↑ 3.0 3.1 3.2 3.3 3.4 3.5 3.6 3.7 M. T. Dove, Introduction to lattice dynamics, Cambridge University Press, Cambridge ; New York, Digitally printed 1st pbk. edn., 2005.
- ↑ R. Dronskowski, Computational chemistry of solid state materials : a guide for materials scientists, chemists, physicists and others, Wiley-VCH, Weinheim, 2005.
- ↑ A. Cimino, P. Porta and M. Valigi, J. Am. Ceram. Soc., 1966, 49, 152-156.
- ↑ W. Martienssen and H. Warlimont, Springer handbook of condensed matter and materials data, Springer, Heidelberg ; New York, 2005.
- ↑ A. I. Biaglow, D. J. Parrillo, G. T. Kokotailo and R. J. Gorte, J. Catal., 1994, 148, 213-223.
- ↑ M. R. Nadler and C. P. Kempier, Anal. Chem., 1959, 31, 2109-2109.
- ↑ I. Suzuki, Phys. Earth Planet. Inter, 1975, 23, 145-159.
- ↑ O. L. Anderson and K. Zou, J. Phys. Chem. Ref. Data, 1990, 19, 69-83.
