Rep:MgO:Yiming Xu
The Free Energy and Thermal Expansion of MgO
Abstract
Thermodynamic calculations of materials differ from simple molecules due to their bulk properties. Even though calculations tend to be more complicated with increased system size, the periodicity of an ionic crystal such as MgO lend itself to analytical solutions via the quasi-harmonic simulation. A quasi-harmonic approximation simulation of MgO was carried at different temperatures to simulate thermal expansion, and compared to results from molecular dynamics simulation under similar conditions, as well as to literature. The thermal expansion coefficient at 300 K was calculated to be K-1, and K-1, for quasi-harmonic simulation and molecular dynamics respectively, compared to a literature value of K-1[1].
Introduction
Chemistry, as a discipline, deals with materials with huge differences in sizes and scale - spanning some 15 orders of magnitude, from the classical size of an electron to solutions in a beaker. In order to form a coherent understanding of the chemistry world, bridging and extending the knowledge from the micro scale to the macro scale is necessarily required - through statistical mechanics.
Statistical mechanics fundamentally assumes that the thermodynamic properties of a system can be inferred from the statistical averages of its microstates. For simple molecular properties, such calculations can be done by an atomic basis. For a material, however, various other methods are used to calculate or simulate the properties due to the large number of atoms involved.
In this experiment, some properties of an MgO crystal was obtained. Its vibrational properties (density of states and phonon dispersion) was first established at 0K using the Buckingham potential. Thereafter, the free energy of the crystal at 300 K was calculated analytically using the quasi-harmonic approximation for a temperature range between 0 K - 3000 K to simulate heating and measure the thermal expansion coefficient. Finally, a molecular dynamics simulation was repeated at the same conditions to provide a comparison with the quasi-harmonic approximation calculations.
Theoretical Background
The vibrational properties of a material is related to many of its properties. Some of the properties are directly transmitted through vibrations, such as thermal conductivity and expansion, while others can be inferred from vibrational properties, such as phase transition and electronic transport. Vibrations are often modelled as atoms joined up by springs:
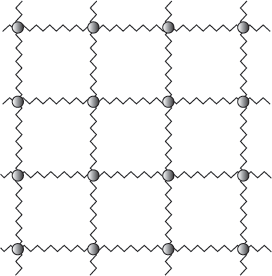
Calculations made in this manner is called the harmonic approximation, and is valid for small deviations from the equilibrium position. The “spring constant”, which is the force of the interaction, is given by the second derivative of the potential force field ( i.e. the Buckingham Potential, ). Changes in position of each atom will propagate through the lattice as a wave, termed as phonons.
The approach to describing phonons in a solid is similar to the description of electronic properties of solids. In a finite lattice, phonons occupy discrete energy levels. These energy levels are filled by phonons of different energies, characterised by their wavevector, , with a total energy . As the lattice size extends to infinity, the energy levels form a continuum, (i.e band) and the phonon simply occupy available states along the continuum.
Classically, these can be undertood as atoms vibrating around their equilibrium positions. More atoms gives rise to more vibrational modes, and a finite number of atoms have a finite number of vibration modes. In an infinite system, there is an effectively infinite number (‘continuum’) of vibrational modes.
The behaviour of the materials thus depends on the population of these energy bands by phonons, which in turn, affects various physical properties of the material as described in the introduction.
Experimental Methods
General Utility Lattice Program (GULP, v1.4.43) on Red Hat Enterprise Linux (v7.2) in VMware (v12.5.0 build-4352439) was used. An ideal, defect-free periodic face centered cubic (fcc) lattice of MgO () was used for calculations and simulations. A simple coulombic Buckingham potential (Cutoffs: min: 0 Å, max: 12 Å, Mg: A = 0.130 x 10⁴, B = 0.3, C = 0, O: A = 0.228 x 10⁵, B = 0.149, C = 27.9) was used to model the interaction between the ions.
Molecular dynamics simulation was carried out under similar potential, with a total of 32 primitive cells (64 atoms) to increase simulation accuracy. An equilibration time of 5.0 ps was used, with a production time of 0.5 ps and a timestep of 1.0 fs. The equation of motion was integrated using the leapfrog Verlet algorithm.
Data collected was analysed with NumPy (v1.13.3) on Python (v3.6.3). Noisy data was smoothened with Savitzky-Golay filter with a windows size of 51 and polynomial order of 3 from SciPy (v1.0.0). Where possible, GULP was run automatically through a bash script with the output kept for analysis.
Lattice Vibrations - Computing the Phonons
Phonon Dispersion Diagram
The phonon dispersion in MgO was calculated with 50 k points, and is shown in the graph below. The various points on the x-axis represents high symmetry points of the fcc lattice. Their directions in k-space are: Γ [000], X [] , W [], K [], L []
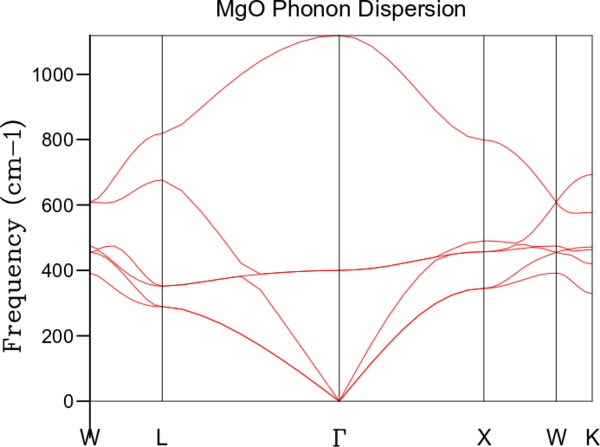
The graph (Fig 2) shows the phonon dispersion within MgO. The total number of branches could be identified from the low symmetry regions, with 6 branches in total. This corresponded with the expected number of 6 branches in total. The number of branches can be found by solving the equations of motion for the 3D lattice, and can be understood as each branch being a vibrational band, and each atom has 1 branch in each dimension.
Different branches could be identified from the dispersion diagram. These arose from in-phase and out-of-phase overlaps of vibrations of the different atoms. The less energetic band was called the acoustic band (A), drawing analogy to sound waves where the particles moves with the direction of the wave. The more energetic band was called the optical band (O) due to the fact that the energy was that of infrared radiation in ionic solids. Another distinction in the feature between the acoustic and optical band was the energy of the acoustic band being much more strongly depending on k , whereas the energy of the optical band remained fairly constant. The existence of transverse vibration waves is characteristic of solids, and its amplitude is related to its shear modulus. The properties of these vibrations are often used in geophysics to locate origins of vibrations (earthquakes).
In addition, there were also two different modes of propagation - longitudinal(L) and transverse(T) in unit cells with a two atom basis. Generally, the transverse wave is lower in energy than the corresponding longitudinal waves. Thus, the branches were arranged in increasing energies as TA, LA, TO, LO. Another point of note was that the graph showed six branches in total - the other two branches are another set of TA and TO branch. This was due to the fact that the transverse wave can propagate in two different directions in a 3D lattice. These two branches could merge depending on symmetry.
It can be seen that at certain points, such as along , there are degenerate branches with the same energy. The degeneracy reflects the symmetry of the crystal and can be used to correlate with the geometry of the unit cell used.
Different numbers of k points can be used to calculate the dispersion diagrams - giving rise to a similar diagram, but different calculated energies. 25 k points were initially used, and doubled for each run until 12800 k points.
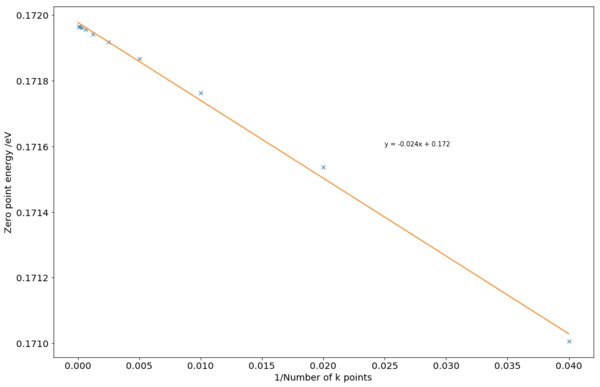
The graph of the calculated zero point energy against the reciprocal of the number of k points used (Fig 3) show a clear trend. As more k points were used, the numerical calculations become more precise, converging to a specific value for the material. From the graph, the convergent ZPE appeared to be slightly below 0.172 eV. Using a nominal convergence criterion of 0.1 meV, 800 k points were sufficient to obtain a sufficiently accurate value. This compares with an experimental value of 0.15 eV, illustrating an error of about 15%. This difference could be from the parameters used in the Coulombic-Buckingham potential, and a more accurate potential could improve accuracy.
Phonon Density of State
While the dispersion diagram (E(k) vs k, Fig 2) was able to describe the symmetry and vibrations within the material, and show important properties in materials, other properties may only depend on the number of energy states available. The measurement of , the marginal increase in the number of available state as energy increases, is the density of state (DOS).

The graph above showed the DOS measured at different shrink factors. The different graphs were normalised to have the same height of 1 to enable comparison. They can be broadly thought as the project of the phonon dispersion down to its y-axis, and can be analysed in a similar manner.
The DOS showed a broad peak near a frequency of 400 cm-1. Comparing to the phonon dispersion, this corresponds to the optical band. As the energy of optical band remains relatively constant, it results in a large number of states with similar energies, showing up as a peak in DOS. Comparing with literature experimental data, [2] show significant differences. While increasing the grid size (shrinking factor) did improve the resolution of DOS, the fundamental differences in shape probably arose from the force field used, with the best calculations often based on the density functional theory (DFT).
The DOS calculation can be carried out with different “shrinking factors”. These “shrinking factors” functions as a grid within the k space at which the DOS is sampled. A larger grid size meant that more points within the k space was sampled, leading to a more precise result as grid size increases. The shape of the DOS remained effectively identical from a grid size of 32x32x32 to 64x64x64, implying that the 32x32x32 grid size was the optimal grid size as it required less computational resources. However, a grid size of 8x8x8 would be minimally required to show an reasonable approximation of the shape of the DOS of phonons of MgO.
The preferred grid size could also be found using a convergent criterion later. A higher grid size would mean that more points within the k space are sampled, leading to a more detailed, more precise and smoother diagram. A smaller grid size may overrepresent sampled points and miss other important features, such as a horizontal band (a “singularity”) that could be very important in the properties of the material.
For a grid size of 1x1x1, a single k point is sampled at (0.5, 0.5, 0.5) of a period in k space which is []. The result could thus be correlated with the dispersion diagram - where indeed two low-energy degenerate band was identified, and represented on the DOS with a tall peak near 300 cm-1 and 375 cm-1. The two other higher energy and smaller peaks on the DOS corresponds to the higher energy bands on the dispersion diagram.
For different materials, the optimal grid size may be different. A similar ionic compound such as CaO would have phonon dispersion and DOS, although the slightly larger lattice parameter of CaO due to a larger cation would result in different phonon behaviour. For a material with a larger unit cell, such as a zeolite, the k space, which corresponds to the reciprocal lattice space, is smaller. This would mean that fewer samples per unit cell is required than that of MgO. By a similar argument, a metal such as lithium which has a smaller unit cell would need a bigger optimal grid size to obtain a reasonable DOS.
Calculating the Free Energy in the Harmonic Approximation
Introduction to the Quasi-Harmonic Approximation
The harmonic approximation is one of the most powerful tools in statistical physics. It relies upon the assumption that the behaviour of atoms of particles in a potential can be approximated by that of an harmonic oscillator. The potential under harmonic approximation is a parabola, with an identical curvature, and thusly force, as that of the actual potential, as long as the following conditions are fulfilled:
- the atoms moves about its equilibrium position; and
- the atoms do not move far away from its equilibrium position.
Moving away from equilibrium position is often described as anharmonicity, and show up as deviations from that harmonic approximations. The harmonic approximation is useful because it often offers analytical solutions to problems encountered. However, it has several well-known problems, such as the lack of thermal expansion and infinite thermal conductivity. The reason for the lack of thermal expansion from the harmonic approximation was intuitively obvious - as temperature increases, the atom vibrations about the same equilibrium position, and no expansion could result. This solution is exact for a diatomic molecule with an exact harmonic potential, but it would not be accurate for a solid material.
Using the harmonic approximation as the potential, the quasi-harmonic approximation (QHA) can be established to give the free energy of the material. This allows the vibrational frequency to take into account volume of the material, by including the entropic component to the material. The partition function of a single harmonic oscillator is:
With N harmonic oscillator, we have
And the free energy of vibration can be obtained:
The quasi-harmonic approximation in this simulation can be obtained by considering the zero point energy of the vibrations and replacing the energy level by vibration frequency:
Results and Discussion
Table 1. A lot of Helmholtz free energy against shrinking factor for numerical integration sampling. Decimals are seperated per 3 digits for ease of comparison.
| Grid Size (n x n x n) | Helmholtz Free Energy /eV |
|---|---|
| 1 | -40.930 300 81 |
| 2 | -40.926 609 08 |
| 4 | -40.926 449 56 |
| 8 | -40.926 477 59 |
| 16 | -40.926 482 32 |
| 32 | -40.926 482 95 |
| 64 | -40.926 483 03 |
From Table 1, it can be seen that calculated Helmholtz free energy converge quickly as the grid size increases, roughly an order of magnitude for every doubling of the linear grid size (8 times as many points). A higher grid size would be more computationally intensive to compute, thus a smaller grid size was preferred where possible. With different convergent criteria of 1 meV, 0.5 meV and 0.1 meV, grid sizes of 2 x 2 x 2, 4 x 4 x 4 and 8 x 8 x 8 would be sufficient and suitable. For further experiment, a gridsize of 32 x 32 x 32 would be used, for a precision of 1 μeV.
Similar to the previous section, different materials would require different grid sizes to achieve the same level of precision. A similar oxide such as CaO would require similar grid sizes for similar precisions. For a material such as zeolite with a larger unit cell, a smaller grid size, is required than that of MgO. A metal such as lithium with a smaller unit cell would need a bigger optimal grid size to obtain a reasonable free energy.
The Thermal Expansion of MgO
The cell volume and cell lattice parameter was determined using QHA at different temperatures:

The cell used for calculation and simulation is the primitive cell, which was smaller and simplifies calculation. The cell parameter of the conventional cell could be recovered by multiplying the reduced cell parameter by . The shape of both the cell volume and the cell parameter display similar trend - which was expected, as the cell volume was a function of cell parameter. The high overlap between the curves was due to the scale used.
From the graph, it could be seen that the cell volume and lattice parameter increased slowly until about 200K, after which there was a relatively linear increase in cell volume from 500 K to 2000 K, beyond which the graph increased sharply upwards.
This phenomenon could be explained by considering the physical origin of thermal expansion from a classical picture. At all temperatures, as temperature increases, the amplitude of the vibration of the atoms increases. At low temperatures, the oscillations are small and are well confined to within the harmonic region. Oscillations do not change the average distance of interatomic separation significantly in an harmonic well, and the volume of the material thus stays the same. At a higher temperature, the atoms oscillate more strongly, and the materials expands more to reduce interatomic repulsion. This effect is more pronounced at increasingly higher temperatures, until the melting point at which the QHA breaks down completely.
The thermal expansion could also be rationalized from a free energy perspective. As temperature rises, phonons become more energetic and occupy higher energy states. An expansion in cell volume, while reducing interatomic potential, would reduce phonon energy and reduce overall free energy. The free energy driven optimization was the analytic geometry optimization algorithm used in lattice dynamics with QHA. Entropically, it can be understood as the increase in volume leading to decreasing vibrational frequencies, which increases the vibrational entropy and is favoured.
The breakdown in QHA was due to the anharmonicity of the actual potential. As temperature rises, the atoms would have higher kinetic energy, vibrating further from their equilibrium position and thus deviate further from harmonic approximation [3]. In addition, harmonic approximation does not exhibit bond breaking behaviour, as the potential rises to infinity at large deviations ( as ). Near melting point, atoms would break free of their bonds - which was not modelled. This differs from a more “realistic” potential such as the Buckingham potential or the Lennard-Jones potential. This was the main approximation made in the calculation.

From the cell volume, the thermal expansion coefficient was found. The thermal expansion coefficient describes how the volume of a material changes. The volumetric thermal expansion coefficient, , is defined as:
Computationally, given the volume of a lattice at different temperatures, the volumetric thermal expansion coefficient can be calculated as:
where is the optimized cell volume [4] of the simulation. These can be compared with literature at different temperatures[5].
From the data collected from QHA, it can be seen that the thermal expansion coefficient is different at different temperatures. The behaviour of the curve could be explained by looking at the major contributors to the volume expansion, which was the vibrational contribution. The thermal expansion coefficient at 300 K was calculated to be K-1. Literature value at this temperature was K-1$[1].
At low temperatures, the most significant vibrational modes involved is the ground state, which is the zero point energy ( eV). This is much larger than the thermal energy (0.026 eV at 300 K). In fact, at and near room temperatures, more than half the phonons are in the ground state [6]). As can be seen from the graph, the free energy contribution by the zero point energy at low temperature is negligible. As vibrational energy was the source of volume expansion under QHA, little expansion was expected, and a small thermal expansion coefficient was indeed observed at low temperatures.
As temperature rises, the thermal expansion coefficient will increase. The increase would depend on several factors [7]:
where is the bulk modulus, and is the number of phonons at that state.
Effectively, the formula says that the thermal expansion coefficient would be due to i) how much the vibrational energy changes as volume changes, and ii) how the occupancy of the states change as temperature changes. As would be seen later on, factor i) is small and constant. However, factor ii) would be large as temperature gets higher, as the phonons now have sufficient energy to occupy more energy vibrational modes, and the system expands to minimize its free energy.
Comparing the graph and the DOS of phonon, it was indeed the case. The ramp up in thermal expansion coefficient at low temperatures corresponded to filling of the main peak (< 400 cm -1, high factor ii). As the available states were filled up, the thermal expansion coefficient then stayed relatively constant, before the thermal expansion coefficient diverging from experimental results at high levels. A small peak could be identified at 2750 K, and may correspond roughly to the melting point of MgO.
The data from QHA, while showing a similar trend, was different from the experimental result obtained. One reason why this may be the case was due to the different atmospheric pressure, however atmospheric pressure has a negligible effect on the volume at 1 atm [8].
QHA was seen to systematically underestimate the actual thermal expansion, up to the point where QHA diverges. The systematic underestimation may come from several sources, such as neglecting phonon-electron interactions, phonon scattering, and electronic interactions. Including more terms into the free energy (through extended QHA) would result in more accurate result. In addition, QHA using a more accurate model using density functional theory (DFT) may also provide better results. However, limitations involved in QHA fundamentally limits its usefulness[9].
Molecular Dynamics
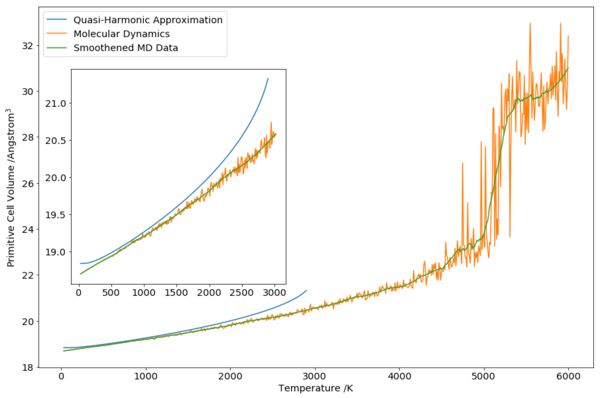
Molecular dynamics (MD) simulation was carried out from 20 K to 6000 K at 10 K timesteps. From the graph, it can be seen that MD results were similar to QHA results from about 400 K to about 1500 K, before QHA diverges at temperature increases further. The divergence of QHA was detailed previously, and was due to the anharmonicity of the actual potential increasing the number of phonon modes available, which was not accounted for in an harmonic potential in QHA. On this aspect, as MD accounts for the potential at fully (although an approximate one), especially long-range and higher temperature behaviours, MD was able to produce a better and more accurate result than QHA.
Cell Volume
The low temperature region of the MD graph (Fig. 7)shows lower cell volume than that of QHA. This is due to the low temperature regime being the “quantum regime”, where quantum effects, such as the zero point energy of vibrations are important. As MD do not simulate zero point vibrations, the atoms are closer together, leading to lower volume than that of QHA.
As described above, classical regime became important at about 300 K (where the factional contribution from zero point vibrations fell to less than half). From the comparison between MD and QHA, the agreement did improve from about 300 K onwards, according to our expectations.
As temperature increase, more noise was present due to larger cell volume and greater atomic vibrations. The solid-liquid transition expected at around 2800 K was not seen in the cell volume data. A significant increase in cell volume was seen starting from about 4000 K. This corresponds to the expected boiling point of MgO, with the cell volume increasing significantly as temperature increase further. While simulation was carried out until 6000 K, the data in this region was not expected to be accurate as insufficient equilibration time to equilibrate the input solid lattice all the way to a high temperature vapour phase MgO.
The liquid-vapour transition could be more easily seen if the potential energy of the lattice was plotted instead.
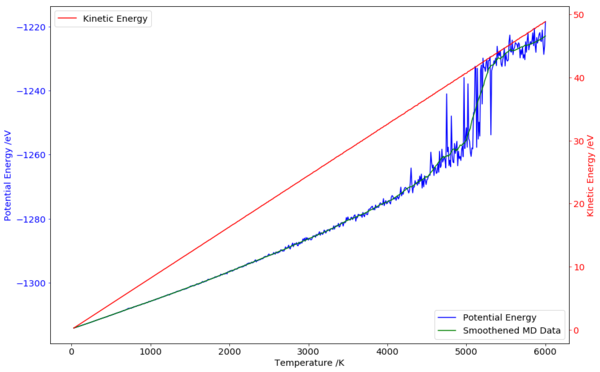
From the graph (Fig. 8), the noise in internal energy picked up significantly at about 4000 K, signifying a more disordered phase. In addition, the solid-liquid phase transition was also barely visible from the increase in fluctuation at about 2800 K. A better indicator of the transition could be the mean square displacement (MSD). However, the data was not easily obtained from the output file provided. In addition, the kinetic energy within the lattice was also obtained, and increased linearly with temperature as expected. This is in contrary to the trend seen with ZPE, which decreases with increasing temperature, due to its linear dependence on cell volume. This shows that the population of higher energy phonon modes were being filled up as energy increases.
Thermal Expansion Coefficient
From the cell volume data, the thermal expansion coefficient could be extracted in a similar manner as compared to what was done for QHA:
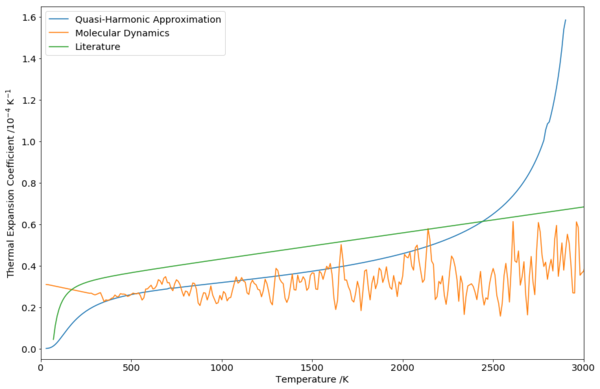
Due to the noisy nature of the cell volume graph of MD (Fig. 9), the thermal expansion coefficient calculated using a similar strategy similarly fluctuates. However, it could be seen that the thermal expansion coefficient calculated with MD was more constant and stable over a longer range of temperatures. The underestimation of the simulation data was still present; however, the trend was more similar to the experimental data.
To extract the thermal expansion coefficient of MD, a linear fit was carried out using the region that was known to be accurate, before melting point:
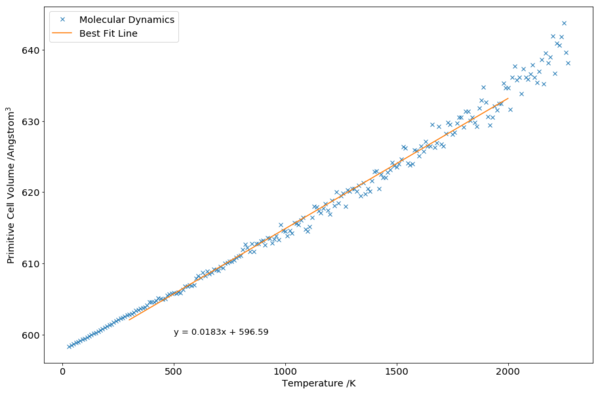
From the gradient of the best fit line (Fig. 10), the thermal expansion coefficient was calculated to be K-1. This was close to the literature value of K-1[1].
Sources of Error and Future Work

Some of the sources and error and potential improvements had been listed above in their respective sections.
The data as presented by MD show significant noise. This was unexpected, as a long equilibration duration (5 ps) was expected to generate neat data points. The origin of the noise could be explained by looking at the actual change in cell volume during an MD run (Fig. 11). It was evident that the cells undergo oscillatory motion as it expands and contracts over time. At different temperatures, different amount and phase of the oscillatory motion was captured for the cell at different temperatures, leading to noise. Potential improvements include introducing randomness within the cell, allowing different atoms to vibrate differently and averaging out the motion or by taking a much longer production duration. A further possibility is running subsequent simulations using the result of previous (lower temperature) simulations, thus saving computation time.
From the cell volume against timestep graph (Fig. 11), it was also clearly evident that some temperatures have significantly different cell volumes as compared to the rest, thus showing its physical phase. In addition, heat capacity could also be calculated from the energy fluctuations, and could be attempted in the future.
Conclusion
Simulations of MgO was carried out using quasi-harmonic approximation and molecular dynamics in order to determine its thermal expansion coefficient. The thermal expansion coefficient at 300 K was calculated using quasi-harmonic simulation to be K-1, and the coefficient calculated with molecular dynamics was K-1, compared to a literature value of K-1[1]. However, systematic error present in higher temperatures in both molecular dynamics simulation and quasi-harmonic approximations, wih the quasi-harmonic approximiation breaking down and diverging near the melting point of MgO. Sources of errors were discussed, and future work could be done to improve the accuracy of the existing simulation, and extract more relevant thermodynamic properties.
References
- ↑ 1.0 1.1 1.2 1.3 M. Durand, Physics, 1936, 7, 297-298.
- ↑ A. Bosak and M. Krisch, Physical Review B, 2005, 72.
- ↑ T. Tsuchiya and X. Wang, Journal of Geophysical Research: Solid Earth, 2013, 118, 83-91.
- ↑ C. Fang, G. de Wijs, H. Hintzen and G. de With, Journal of Applied Physics, 2003, 93, 5175-5180.
- ↑ G. Fiquet, P. Richet and G. Montagnac, Physics and Chemistry of Minerals, 1999, 27, 103-111.
- ↑ Collaboration: Authors and editors of the volumes III/17B-22A-41B () Magnesium oxide (MgO) Debye temperature, heat capacity, density, melting and boiling points, hardness. In: Madelung O., Rössler U., Schulz M. (eds) II-VI and I-VII Compounds; Semimagnetic Compounds. Landolt-Börnstein - Group III Condensed Matter (Numerical Data and Functional Relationships in Science and Technology), vol 41B. Springer, Berlin, Heidelberg
- ↑ M. Scheffler, A. Tkatchenko and P. Rinke, Theoretical Material Science, Fritz Haber Institute of the Max Planck Society, Berlin, 1st November, 2012 edn.
- ↑ J. Zhang, Physics and Chemistry of Minerals, 2000, 27, 145-148.
- ↑ A. Seifitokaldani, A. Gheribi and M. Dollé, Solid State Communications, 2016, 247, 78-81.
