Rep:MgO:XL
Introduction
Magnesium oxide naturally exists as crystal based on face-centred cubic lattice with the lattice points taken by Mg2+ and the octahedral holes filled with O2-.

| Type of Unit Cell | Shape | Parameter | Internal Angel | Volume | Number of MgO |
|---|---|---|---|---|---|
| Conventional | Cube | ac = bc = cc = 4.212 Å | αc = βc = γc = 90• | Vc = 74.725 Å3 | Nc = 4 |
| Primitive | Rhombohedron | ap = bp = cp = 2.978 Å | αp = βp = γp = 60• | Vp = 18.6812 Å3 | Np = 1 |
Vibrations of a solid system are related to many of its physical properties such as free energy, heat capacity, expansion, phase transition, thermal conductivity and dielectric phenomena at low frequencies. This study compares two methods for simulation of MgO crystal vibrations. The quasi-harmonic approximation (QH) considers vibrations as phonons representing elementary vibrational modes in which a lattice of particles uniformly oscillates at a single frequency. The molecular dynamics (MD) allows the particle in the system to interact for a given time period and the coordinates of the particles are numerically solved based on Newton's Laws Rfinal = Rinitial + vfinal*dt = Rinitial + vinitial*dt + a*dt2 = Rinitial + vinitial*dt + (F/m)*dt2. Both methods were conducted on Linux based programme GULP (General Utility Lattice Program) via the user interface for constructing and visualizing provided by DL Visualize.
Theory
In statistical mechanics, the physical properties of a system are in Boltzmann Distribution ni / N = exp (-βui) / q where β = 1 / (kbT) and q = Σj=1levels exp (-βuj). This means that once the partition function q is correctly expressed, the properties of the system can be calculated.2 For example in this experiment, in accordance with harmonic oscillation model, the vibrational frequency ω must be quantised and summing over the frequencies will lead to the partition function, and the Helmholtz free energy A can be obtained using A = E0 + 1/2 Σj,kћωj,k + kbT*Σj,kln[1-exp(-ћωj,k/kbT)]
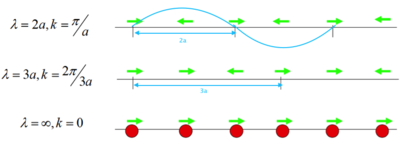
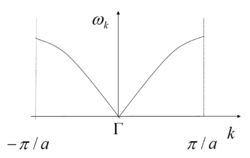
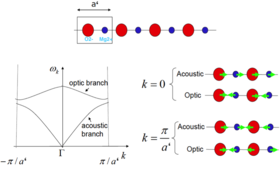
MgO crystal is made of repeating unit cells, so it is sensible to start with the simplest model first to see how frequency ω is related to the repeating structure. When a 1-dimensional chain of one kind of atom vibrate, they can have several different states of vibrations and each one can be described as a wave with a wavelength equal to the length of the repeating unit (Fig.2) and plotting the vibrational frequencies VS the k-vectors (showing directions and wavelengths of vibrations) gives a graph like Fig.3. If each atom in this chain is superseded by a MgO, there is now a pair of ions in each repeat unit, a' = 2a, hence -π/(2a) < k < π/(2a) and folding branch occurs (Fig.4).
Both structures mentioned above are limited in 1 dimension. When the structure is expanded to two dimensions, particles can vibrate up and down with respect to the horizontal axis more than just along the axis, hence k-vectors are expressed as (kx, ky) in a Cartesian coordinate system, and the ω(k) plot becomes a dispersion surface with frequency ω showed in z-axis. It is now easy to see that for 3-dimensional MgO crystal, k points includes (kx, ky, kz), and there will be four Cartesian axises for a ω(k) plot, which is not able to show in real life. In this case, a certain path in the 3-dimensional solid is set and the coordinates through the path are set as the k points, thus ω(k) can be plotted against the path and it is again back to the dispersion curve.
Once the all the vibrational branches are obtained, sum over them to form the partition function, hence the Helmholtz free energy and the cell volume.
Results and Discussion
The lattice energy of MgO calculated is -41.075 eV, and this is the potential energy holding the lattice together induced by electrostatic interaction between Mg2+ and O2- ions, which means to move all the ions in the lattice apart to infinity requires an energy of 41.075 eV (lit3.41.197 eV). Also, this equals to the internal energy of an ideal MgO lattice as perfect crystals have no vibrations, but ions in the real solid crystal do not stay still.
As mentioned in the theory part, to understand the variation of vibrational frequencies with k, a dispersion curve is essential. To deal with the 3-dimensional MgO infinite lattice, a conventional path in the k-space is used to compute the vibrational modes, and for Fig.5, 50 points along the path was computed and shows all the phonon modes.
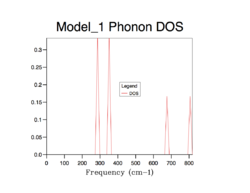
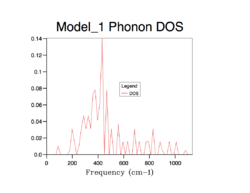
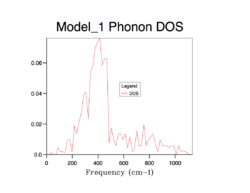
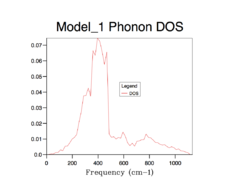
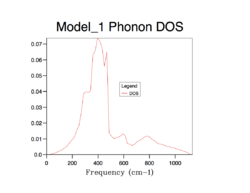
The strategy to sum up the phonon modes is to construct the Density of Sate (DOS), indicating the probability of a phonon to be in a certain state (i.e. frequency). It is important to sum up phonons for an adequate number of k points so that the distribution of them can be represent the distribution of phonons of an infinite lattice. The following shows the process of finding the best number of k points for computing DOS.
As the grid size increases, more possible vibrations are sampled and the distribution is smoothened, nevertheless, the change in DOS decreases each time the grid size is doubled. Computing over more k-points requires more resources and time, which is obvious from grid 32*32*32 to 64*64*64. A compromise can be grid 32*32*32 which can give a good enough distribution as a close approximation to the infinite lattice economically.
Since there is a way (the quasi-harmonic approximation) to compute all the phonon modes in MgO infinite lattice, the free energy of it can also be calculated, and GULP is able to search for the minimum free energy with respect to the structure via calculating the internal energy and phonons at a sequence of geometries. Similarly, the computing path in k-space is the same as that for computing DOS, so there is also the grid size problem.
| Shrinking Factor | Helmholtz Free Energy (eV) | Accuracy |
|---|---|---|
| 1 | - 40.930301 | 100 meV |
| 2 | - 40.926609 | 1 meV |
| 3 | - 40.926432 | 0.5 meV |
| 4 | - 40.926450 | 0.1 meV |
| 5 | - 40.926463 | |
| 6 | - 40.926471 | |
| 7 | - 40.926475 | 0.01 meV |
| 8 | - 40.926478 | |
| 9 | - 40.926479 | |
| 10 | - 40.926480 | |
| 11 | - 40.926481 | convergence |
| 12 | - 40.926481 |
A grid size of 11*11*11 was chosen for the following calculations based on the QH method. The Helmholtz free energy and the cell volume were optimised to observe the variations with different temperature. As temperature is raising, the Helmholtz Free Energy becomes more negative, while the cell volume is expanding, Both of the variations can be well expressed by polynomial equations. Calculation failed when temperature is close to the melting point of MgO (lit4. 3125 K). The reason could be the vibrations was so large that atoms clashed into each other causing computing errors.

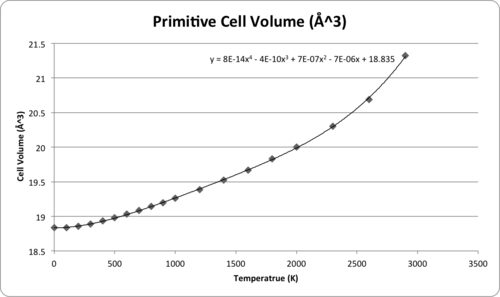
| Temperature (K) | Helmholtz Free Energy A (eV) | Lattice Volume (Å3) |
|---|---|---|
| 0 | -40.9019 | 18.8365 |
| 100 | -40.9024 | 18.8383 |
| 200 | -40.9094 | 18.8562 |
| 300 | -40.9281 | 18.8900 |
| 400 | -40.9586 | 18.9325 |
| 500 | -40.9994 | 18.9801 |
| 600 | -41.0493 | 19.0312 |
| 700 | -41.1071 | 19.0851 |
| 800 | -41.1719 | 19.1413 |
| 900 | -41.2430 | 19.1997 |
| 1000 | -41.3110 | 19.2601 |
| 1200 | -41.4887 | 19.3872 |
| 1400 | -41.6755 | 19.5233 |
| 1600 | -41.8780 | 19.6698 |
| 1800 | -42.0944 | 19.8287 |
| 2000 | -42.3237 | 20.0029 |
| 2300 | -42.6895 | 20.3047 |
| 2600 | -43.0800 | 20.6889 |
| 2900 | -43.4948 | 21.3217 |
In order to compare the computing thermal expansion with the literature values, several cell volumes were obtained by substituting some specific temperatures into the trend line equation in Fig.7, and the predicted cell volumes were then transferred into molar volume by multiplying Avogadro constant NA with the units changed to what is used in the literature.
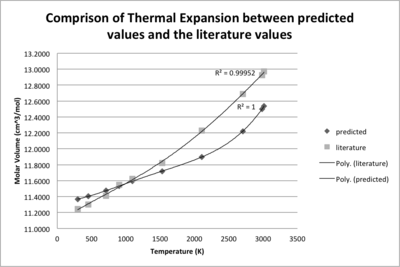
| Temperature (K) | Cell Volume (Å3) | Molar Volume (cm3mol-1) | Literature5 Molar Volume (cm3mol-1) |
|---|---|---|---|
| 298 | 18.8851 | 11.3688 | 11.2434 |
| 455 | 18.9425 | 11.4034 | 11.3004 |
| 710 | 19.0601 | 11.4742 | 11.4109 |
| 1096 | 19.2570 | 11.5927 | 11.6211 |
| 1527 | 19.4673 | 11.7193 | 11.8218 |
| 2106 | 19.7624 | 11.8970 | 12.2287 |
| 2703 | 20.3014 | 12.2214 | 12.6887 |
| 2986 | 20.7658 | 12.5010 | 12.9244 |
| 3015 | 20.8248 | 12.5365 | 12.9723 |
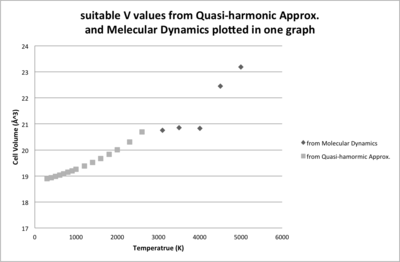
As mentioned in the introduction part, another simulation method MD was also used to calculate the equilibrium energy and volume. The MD obtained values before the melting point of MgO are similar compared to those obtained by QH, and after the m.p., MD can compensate the failure of QH. Around the m.p., there is a range where the volume almost keeps constant, indicating phase changing. When T reaches 4000 K, the volume is lifted by more than 10 Å3 higher, indicating phase change is completed and the volume of liquid phase will continue increase with the raising temperature but with a steeper gradient. If the temperature goes on increasing, the volume will become infinite as the gas phase does not have a volume without any pressure.
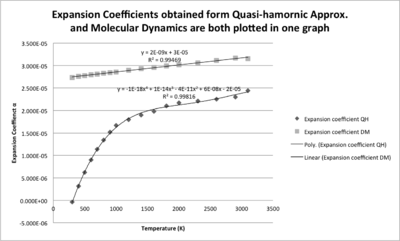
The change of cell volume can be describes as thermal expansion coefficient αV=(1/V0)(dV/dT). This property can be calculated for both of the data sets obtained from different methods, and V0 is the zero-point volume in each case and the (dV/dT) is the gradient of the trend lines.
Conclusions
This experiment found that the cell volume (i.e. the separations) of MgO crystal increases with the rising temperature, and this causes the thermal expansion. The original of thermal expansion is the anharmonic vibrations due to the asymmetric interatomic potential. The QH method assumes that all the vibrations are harmonic so the cell volume will not change much, but it is true only when the temperature is relatively low; while the MD method is closer to the real life but less economic, it should be used for simulation of vibrations at higher temperature.
To use statistic method to study a system needs a large enough ensemble, or else the average property will not be a good approximation.
Reference
1. Prof N. M. Harrison’s Lectrure Notes: Vibrations in crystals
2. J. M. Seddon and J. D. Ga, Thermodynamics and Statistical Mechanics, the Royal Society of Chemistry, Cambridge, 2001
3. B. K. Vainshtein, V. M. Fridkin and V. L. Indenbom, Modern Crystallography 2: Structure of Crystals, Springer, London, 3rd Edn., 2000, pp. 64.
4. Chemistryworld, http://www.rsc.org/chemistryworld/2014/08/magnesium-oxide-mgo-podcast, (accessed Nov. 2015)
5. L.S. Dubrovinsky and S.K. Saxena, Phys Chem Minerals, 1997, 24: 547–550

